

Issue 2: Analysis of photovoltaic and heat pump data - August 2022
Issue 2: Analysis of photovoltaic and heat pump data - August 2022
A deeper look into what a private roof-top photovoltaic system and heat pump can do.

Some of the readers might remember the detailed and critical analysis I’ve done on Twitter for my photovoltaic system and heat pump data. I’d like to continue with it on this platform. My intention is to give an honest, sometimes critical, insight into what a photovoltaic system and heat pump can do.
A detailed overview of the system under analysis here can be found in this previous text: My Energiewende.

What a summer in Germany! Hot, dry and sunny. Climate change isn’t a remote threat anymore. It’s actually here and affects all of our lives. It also affected the photovoltaic system on my roof positively: the yield was excellent so far.
Photovoltaic & Battery System
Sunshine hours Jan-Aug 2021: 1.486 hrs (source: Munich Airport weather data)
Electricity harvested Jan-Aug 2021: 12.547 kWh
Sunshine hours Jan-Aug 2022: 1.798 hrs
Electricity harvested Jan-Aug 2022: 14.142 kWh
That’s 1.595 kWh more in the same period in 2022. But weather is volatile, of course. The following graph shows that most of the months in 2022 were better than 2021, but not all of them.

In that regard, I’d like to mention that similar graphs in my analysis will use similar scaling, to make the comparable as much as possible.
As a result my house produced a significant surplus of energy, which was fed into the grid, while using much less electricity from the grid. However, this surplus exists as an annual balance, there’s still the need for a significant amount of grid electricity during winter time, especially for the heat pump.

My house enjoys a very high level of energy autarky during the summer months, not so much during winter.

Overall autarky in 2021 was 68%, which was a bit disappointing. I expected > 70%. In 2022 the autarky so far has been 81%. But keep in mind this is a snapshot by end of August, it will get worse until end of the year.
Another relevant question is the utilization of the battery. As it’s an expensive asset, a high utilization would be desirable.
The net capacity of the battery is 13,5 kWh. In a month of 31 days it could provide a maximum of 418,5 kWh energy if if does a full charge/discharge cycle every 24 hours. In reality it’s mostly less as the following graph shows.

Surprisingly the lowest utilization was during winter and not so surprising, the highest during spring and fall. During winter the photovoltaic harvest was very low, while at the same time the consumption of the heat pump was high, leaving little surplus to charge the battery. In contrast to this, during summer the electricity consumption was so low, that the battery only got partially discharged over night.
This shines a light on the choice for the battery size: a bigger battery seems desirable from a technical perspective, but its utilization would be rather low for most of the year and thus not so desirable from a financial perspective.
Heat Pump
Let’s look into the data provided by the heat pump. Luckily it provides separate energy data for heating, cooling and hot water. As a reference the graphs will show the average ambient temperature (source: Munich Airport weather data).

No surprise, that the energy consumption of the heat pump for heating is high during winter and mostly zero during summer. The correlation with the ambient temperature is obvious and doesn’t need much explanation.
The relevant parameter to judge the efficiency of a heat pump, is the “Coefficient of Performance” or in German “Arbeitszahl”.

The COP remained well above 3 for most of the months. September 2021 can be considered an outlier. The heating was hardly used in this months, so the data is not reliable. In the summer month heating was off, so no data for COP.
In theory the COP should be higher at hight ambient temperatures. The graph indicates that to some degree, but the correlation isn’t very strong and there are outliers like March 2022 with a lower COP than March 2021 despite similar temperatures. The reason for this surprisingly low correlation is unclear at this point and might be a subject to further investigation.
A heat pump can’t just heat, modern models can also reverse and provide limited cooling. Not as powerful as a real air-condition and restricted by the dew point, it’s a nice feature during hot summers. Real air-conditions are rather rare in residential buildings in Germany.
Using the heat pump for cooling consumes energy, of course. 129 kWh of electricity were used by end of August.
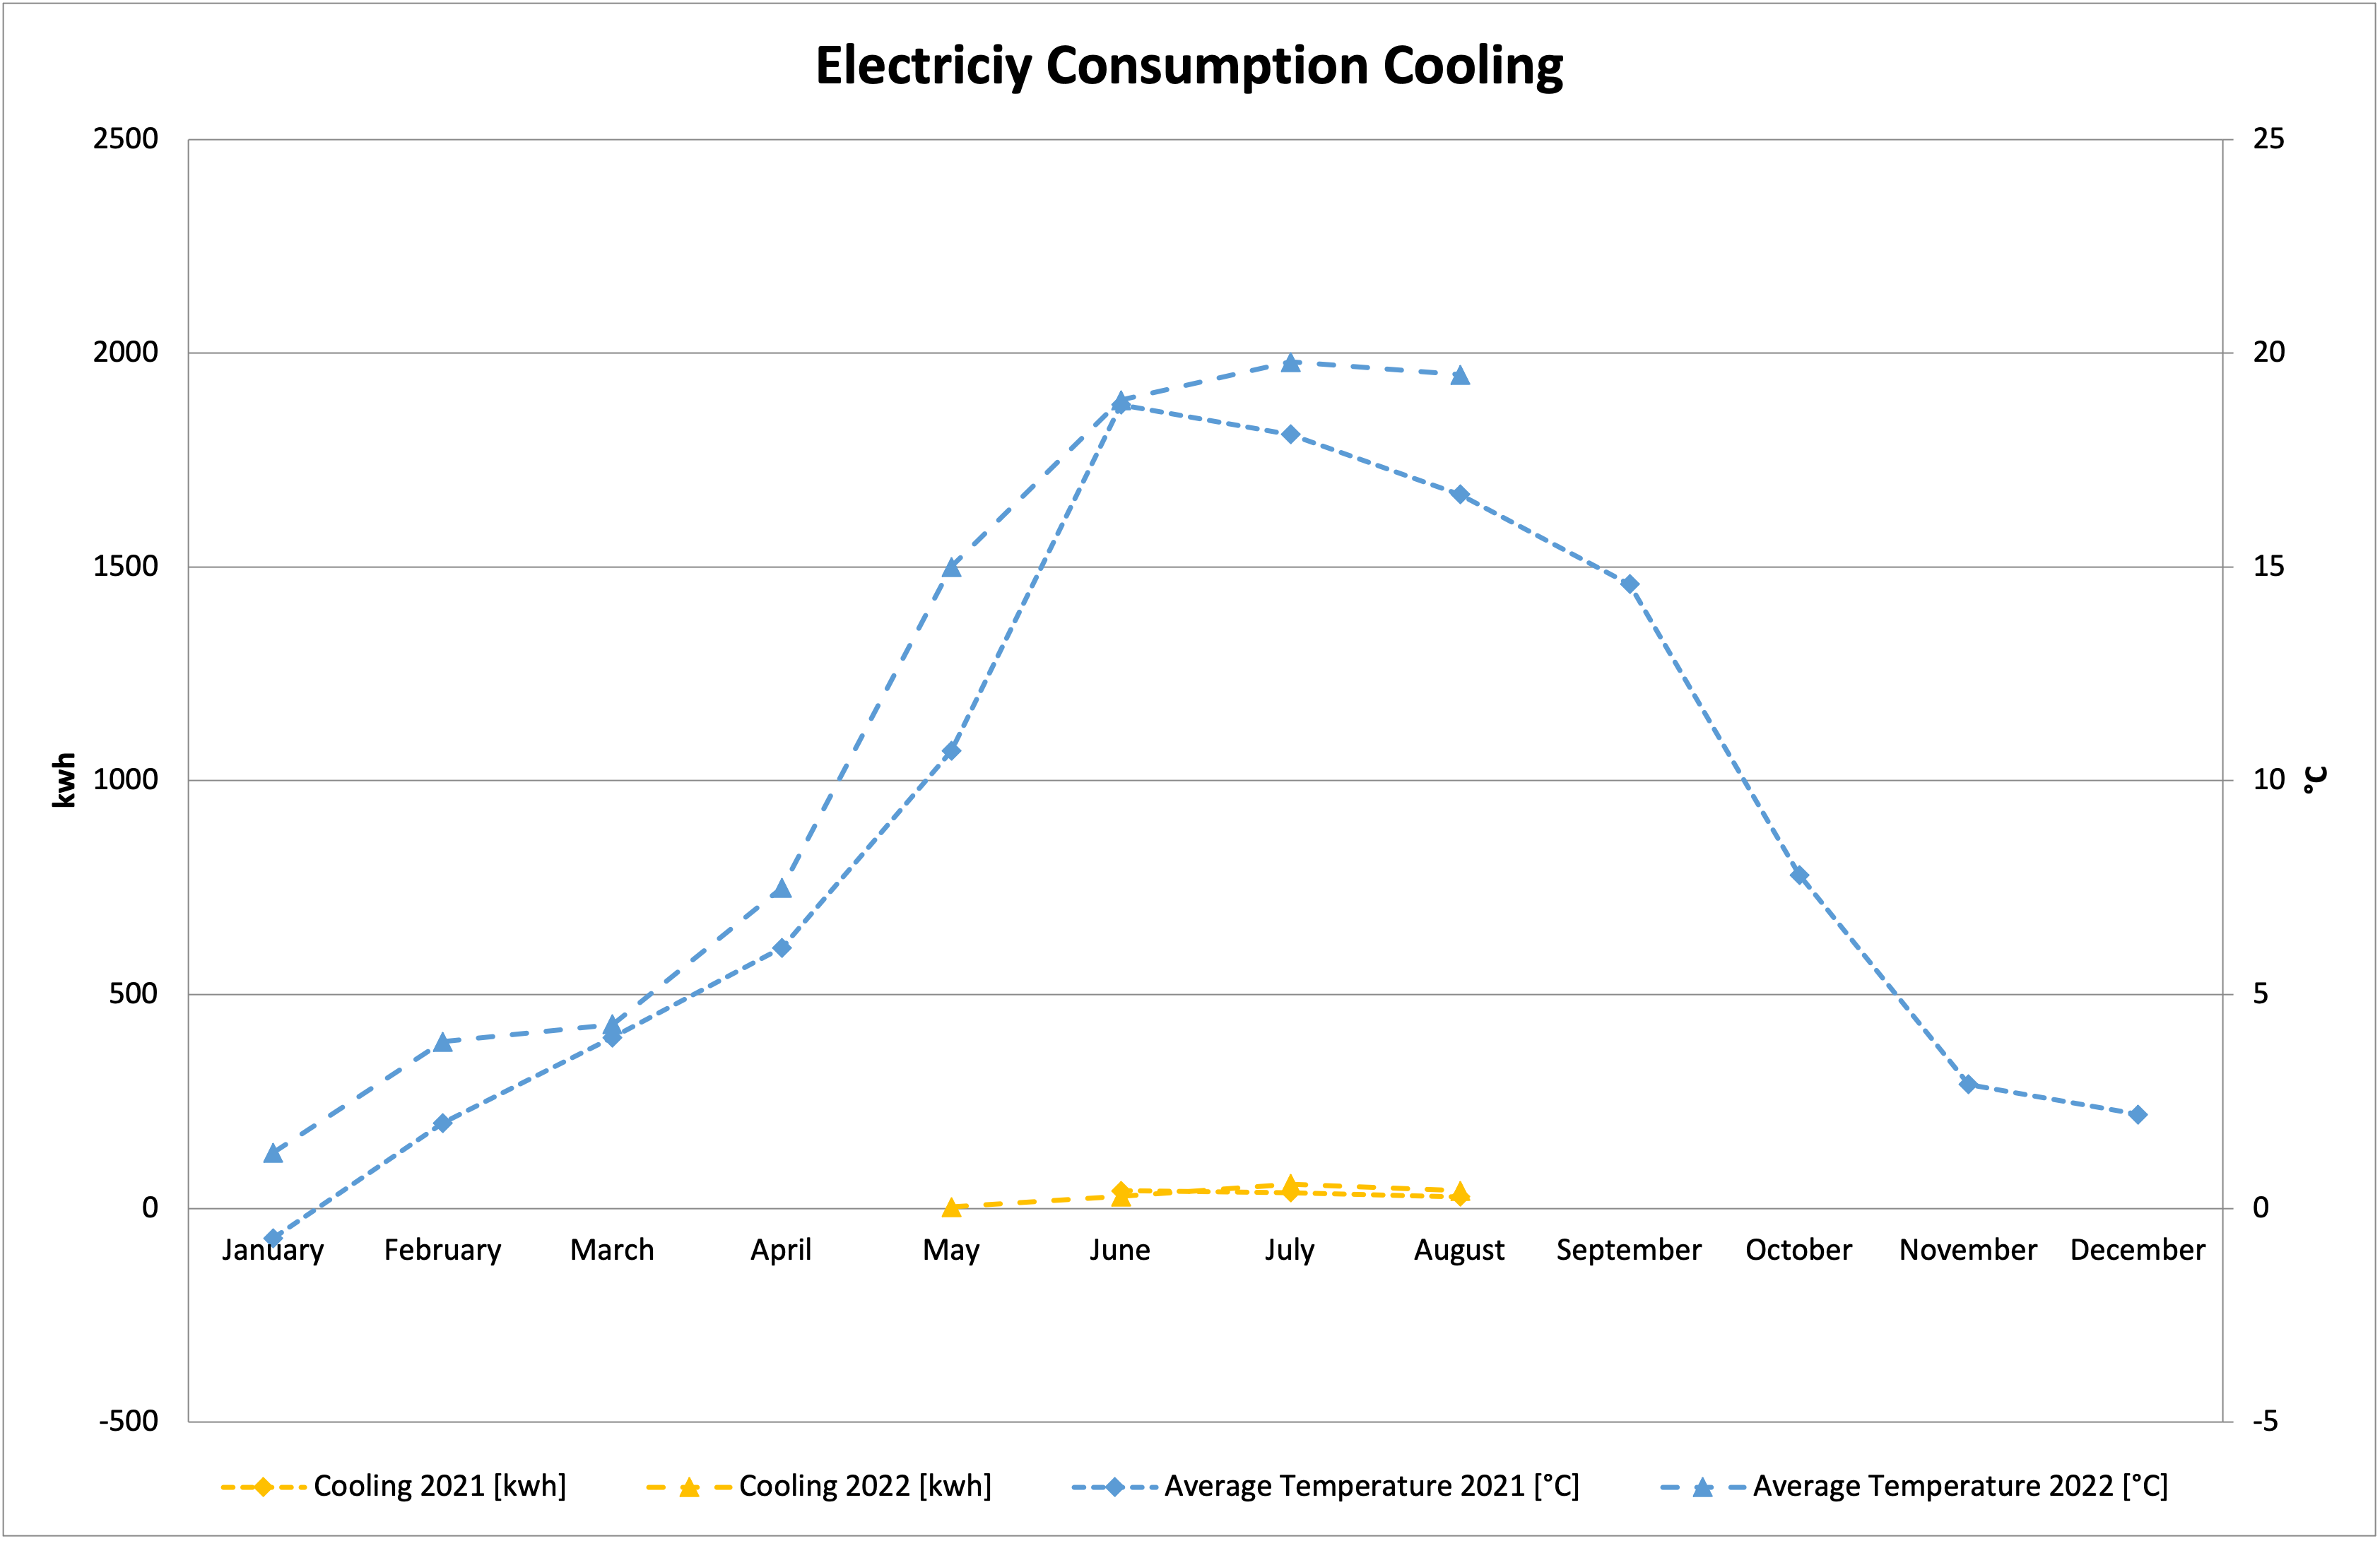
Using a cooling of any sort together with a photovoltaic system has a big advantage: high consumption correlates perfectly with high photovoltaic production. Therefore the 129 kWh mentioned above were consumed completely at the expense of grid feed-in, which only a small compensation is being paid for. Therefore cooling my house comes with really cheap operating costs.
Providing hot water is another relevant use of the heat pump, which will consume energy all year.

The consumption of energy for hot water changes over the course of the year, even though the consumed hot water volume is mostly constant. This has two reasons: 1. Fresh water is colder in winter, needs more energy to heat up to the target temperature. 2. Colder ambient temperatures lead to a lower COP for hot water heating.

The graph above shows a clear correlation of the COP for hot water heating and the ambient temperature. Note that the COP for hot water is in winter significantly lower than the COP for heating in the same time period. This is caused by the higher temperatures the hot water must be heated to.
Finally let’s look into the comparison of heat pump consumption and photovoltaic production.

Obviously the winter is a problem: the photovoltaic system is not able to provide enough energy for the heat pump during the winter months - this graph doen't even consider the household consumption and my electric vehicle. Thus the electricity needs to come from the grid and must be produced elsewhere.
This is a critical aspect of heat pumps, we must not forget: the consumption goes up during winter, at a time when photovoltaic delivers less, much less, energy. This fact must be considered in future grid planning.
Conclusion
Photovoltaic and heat pumps might have their downsides as mentioned above and thus, they are no “one size fits all” solution. But they are main building blocks of a renewable energy system, which brings us forward toward a sustainable energy system, helps the climate and make our energy system more resilient.
Finally I hope this text will convince my dear readers that Phtovoltaic is cool, fun and useful for our future. If you have the opportunity to build a photovoltaic system, do it! Don’t hesitate to ask me for an advice.
Comments are welcome and I’m looking forward to interact with my readers.
With sunny regards,
Andreas