


Article condensed review of: "Non-White scientists appear on fewer editorial boards, spend more time under review, and receive fewer citations"
Article condensed review of: "Non-White scientists appear on fewer editorial boards, spend more time under review, and receive fewer citations"
Breaking Down Barriers: Unveiling Inequality in the Scientific Community and Fostering a Fairer Future for All Researchers

Keywords: scientific community, editorial boards, publication bias, racial disparities, citation inequality, inclusive research, underrepresented scientists, peer review process, gender disparity, awareness and change
Context
As an avid follower of scientific advancements, I've always believed that the world of science should be a meritocracy, where people are judged solely based on their ideas, skills, and contributions. The scientific principle aims to understand the natural world through observation and experimentation, and it is crucial that everyone gets an equal opportunity to contribute to this pursuit.
That's why, when I came across an article titled "Non-White scientists appear on fewer editorial boards, spend more time under review, and receive fewer citations," I felt compelled to share my thoughts in this blog post. This article highlights important issues that many of us may not be aware of, revealing that the scientific community might not be as fair and unbiased as we would like to think.
You might be wondering why this issue matters so much. Well, the findings presented in this article hold great significance for various reasons. For one, they suggest that there is an unjust and differentiated treatment within the scientific community, which goes against the very principles of scientific inquiry. If certain groups of scientists are being systematically disadvantaged, it not only impacts their careers but also limits the scope of scientific progress. After all, great ideas can come from anyone, regardless of their race, gender, or background.
Moreover, raising awareness about these disparities is essential for fostering a more inclusive and diverse scientific community. By discussing the challenges faced by non-White scientists, we can work towards creating a more equitable environment where everyone has an equal chance to succeed and contribute to the growth of human knowledge.
In this blog post, I will provide a condensed review of the article, breaking down its main findings and discussing the implications of these results. My hope is that, by sharing this information, we can inspire a broader conversation about the need for fairness and inclusivity in science, ultimately leading to a more just and efficient scientific community.
Read the original article and support the creators:
Non-White scientists appear on fewer editorial boards, spend more time under review, and receive fewer citations
Fengyuan Liu, Talal Rahwan and Bedoor AlShebli bedoor@nyu.eduAuthors Info & Affiliations
Edited by Susan Fiske, Princeton University, Princeton, NJ; received September 7, 2022; accepted January 28, 2023
March 20, 2023
120 (13) e2215324120
https://doi.org/10.1073/pnas.2215324120
Significance
Research shows non-white scientists face inequality in academic research, affecting entry and participation.
We examine disparities in:
i) editorial board representation,
ii) review time, and
iii) citation rates.
Analyzing 1,000,000 papers from six publishers over 20 years, we find fewer non-White editors than expected based on authorship share. Non-White scientists also experience longer manuscript review times and receive fewer citations than expected. These findings reveal inequalities hindering non-White scientists' academic careers.
Abstract
Disparities challenge various aspects of science, including editorial board composition, exhibiting racial and geographical inequalities. Literature lacks longitudinal studies quantifying racial composition of editors compared to scientists. We analyze 1,000,000 papers from 2001-2020, identifying handling editors. Results show countries in Asia, Africa, and South America (with majority non-White populations) have fewer editors than expected, with Black US-based scientists most underrepresented. Acceptance delay is also greater for these regions, with Black authors suffering the most. Citation analysis reveals Black and Hispanic scientists receive significantly fewer citations than White counterparts doing similar research. These findings emphasize challenges faced by non-White scientists.
The underrepresentation of racial minorities in science is well documented, but racial disparities extend beyond representation to citations, media coverage, career opportunities, and funding. Studies found White scientists receive more citations, are overrepresented as honorees, and are more likely to receive US NIH grants. Our study examines racial disparities in editorial board composition, acceptance delay, and citation rates. Past research shows a lack of ethnic and geographical diversity in editorial boards, dominated by North America and Europe.
We analyze over a million papers from 2001-2020 in 500+ journals, examining the handling editor and authors' and editors' entries in the Microsoft Academic Graph dataset. Our findings show non-White scientists appear on fewer editorial boards, experience longer review times, and receive fewer citations than White scientists doing similar research. This study provides a better understanding of the inequalities faced by non-White scientists in academia.
Results
Editorial Board Representation.
Fig. 1.

Representation of countries among editors. For any given country, the editor-to-author ratio is calculated as the percentage of editorship from that country divided by the percentage of authorship from that country. A country is overrepresented among editors if the ratio is > 1 and underrepresented if the ratio is < 1. (A) Editor-to-author ratio for countries around the globe. Here, a country is colored in (light or dark) green if it is significantly overrepresented, in (different shades of) brown if it is significantly underrepresented, and in gray otherwise (Fisher’s exact test, P < 0.001). The editor-to-author ratios for all countries are divided into five quantile intervals. The interval containing 1 is further subdivided into two disjoint intervals, one consisting of values > 1 (assigned a shade of green) and another consisting of values < 1 (assigned a shade of brown). Countries for which the percentage of authorship or the percentage of editorship is zero are omitted from the map. (B) Editor-to-author ratio of countries that have at least 1,000 editors and are significantly overrepresented or underrepresented in editorial boards; countries in Africa, Asia, and South America are colored in red, while other countries are colored in blue. (C) In each publisher, the percentage of countries that are significantly overrepresented (Upper panel) and underrepresented (Lower panel). (D) The same as (C) but in each discipline. (E) The same as (C) but in each top-ranked journal according to Google Scholar.
The study analyzes editorial board representation and finds that most countries in Asia, Africa, and South America (with predominantly non-White populations) are underrepresented. Within the US, White scientists make up 57% of editors, while Asian and Pacific Islander (API) scientists make up about 40%, and only 3% and 0.1% of editors are Hispanic and Black, respectively. Over time, the racial gap has been closing for Hispanic and API scientists, but it has grown larger for Black scientists. The underrepresentation of non-White scientists occurs across most publishers and disciplines. This analysis shows that racial and geographical disparities persist in editorial board representation within the scientific community.
Fig. 2.
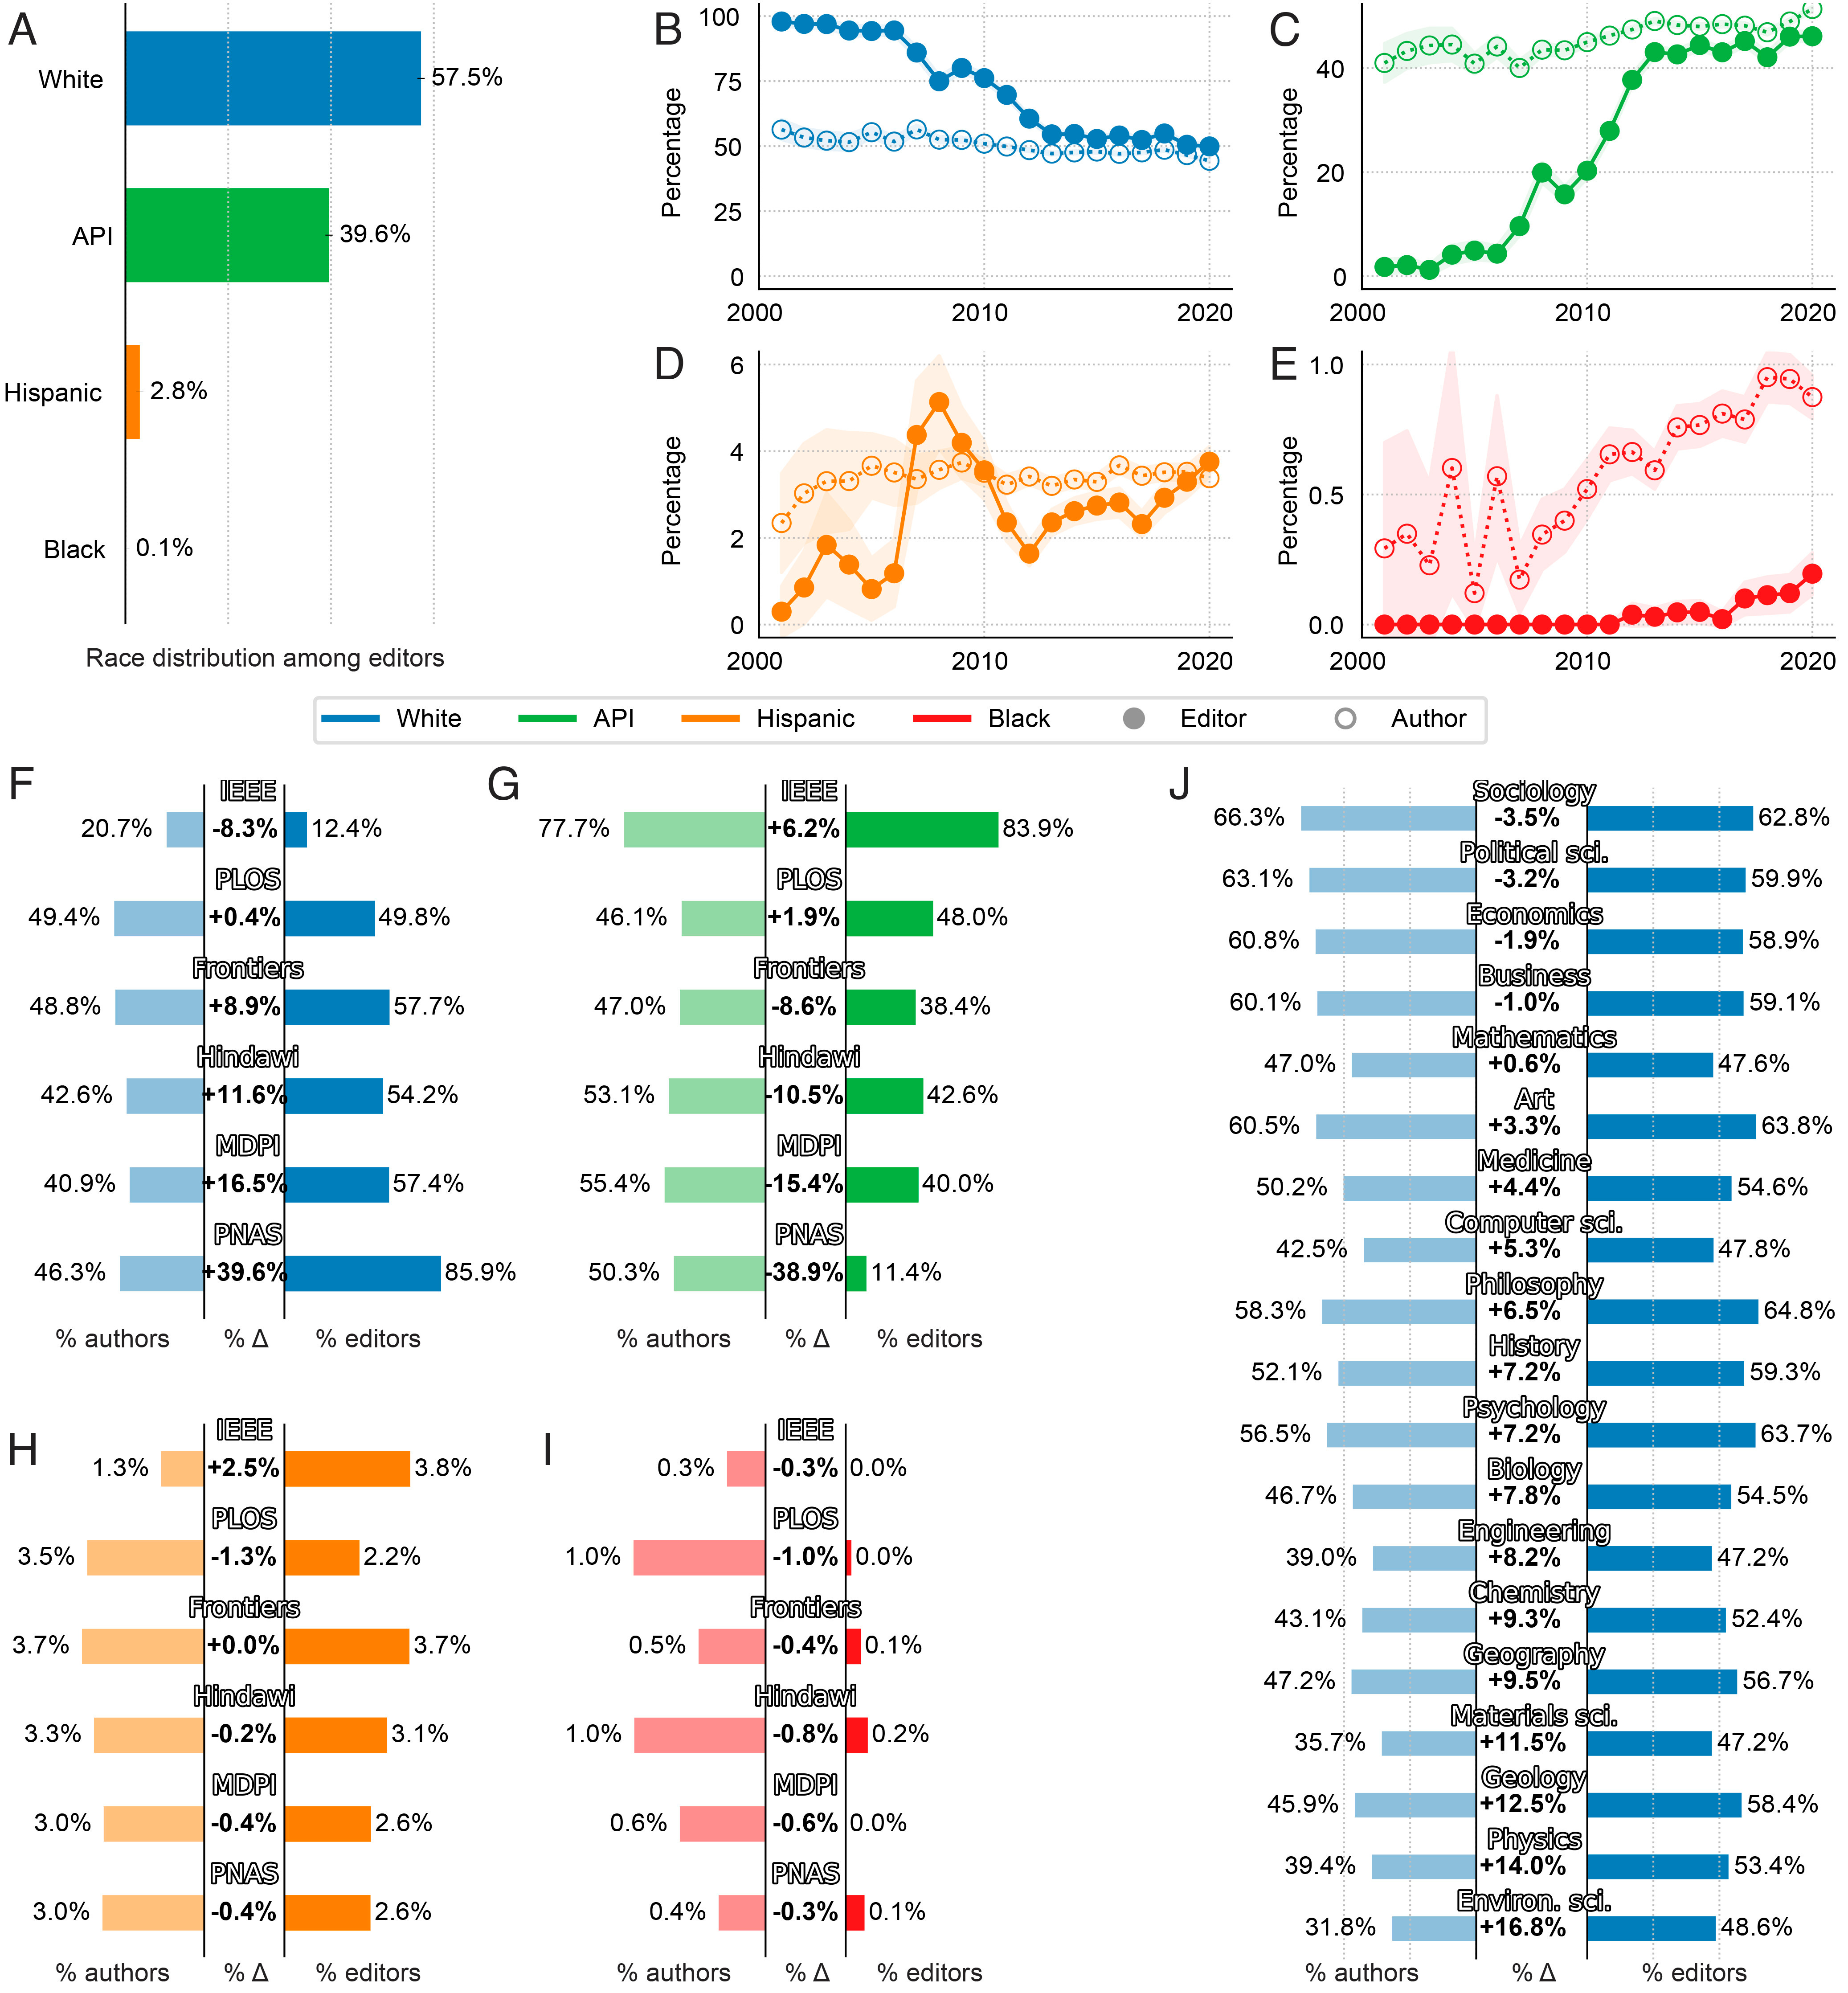
Representation of races among editors. This figure focuses on US-based scientists. (A) The percentage of White, API, Hispanic, and Black editorships. (B) For each year between 2001 and 2020, the percentage of White editorship (solid circles) and White authorship (empty circles). (C–E) The same as (B) but for API, Hispanic, and Black, respectively. Shaded areas and error bars represent 95% CIs. (F) The percentage of White authorship (left panel) and the percentage of White editorship (Right panel) in each publisher between the years 2011 and 2020 (inclusive). The number at the center represents the difference between the two panels; a positive number indicates that White editors are overrepresented. (G–I) The same as (F) but for API, Hispanic, and Black, respectively. (J) The same as (F) but in each discipline.
Acceptance Delay of Papers.
Fig. 3.
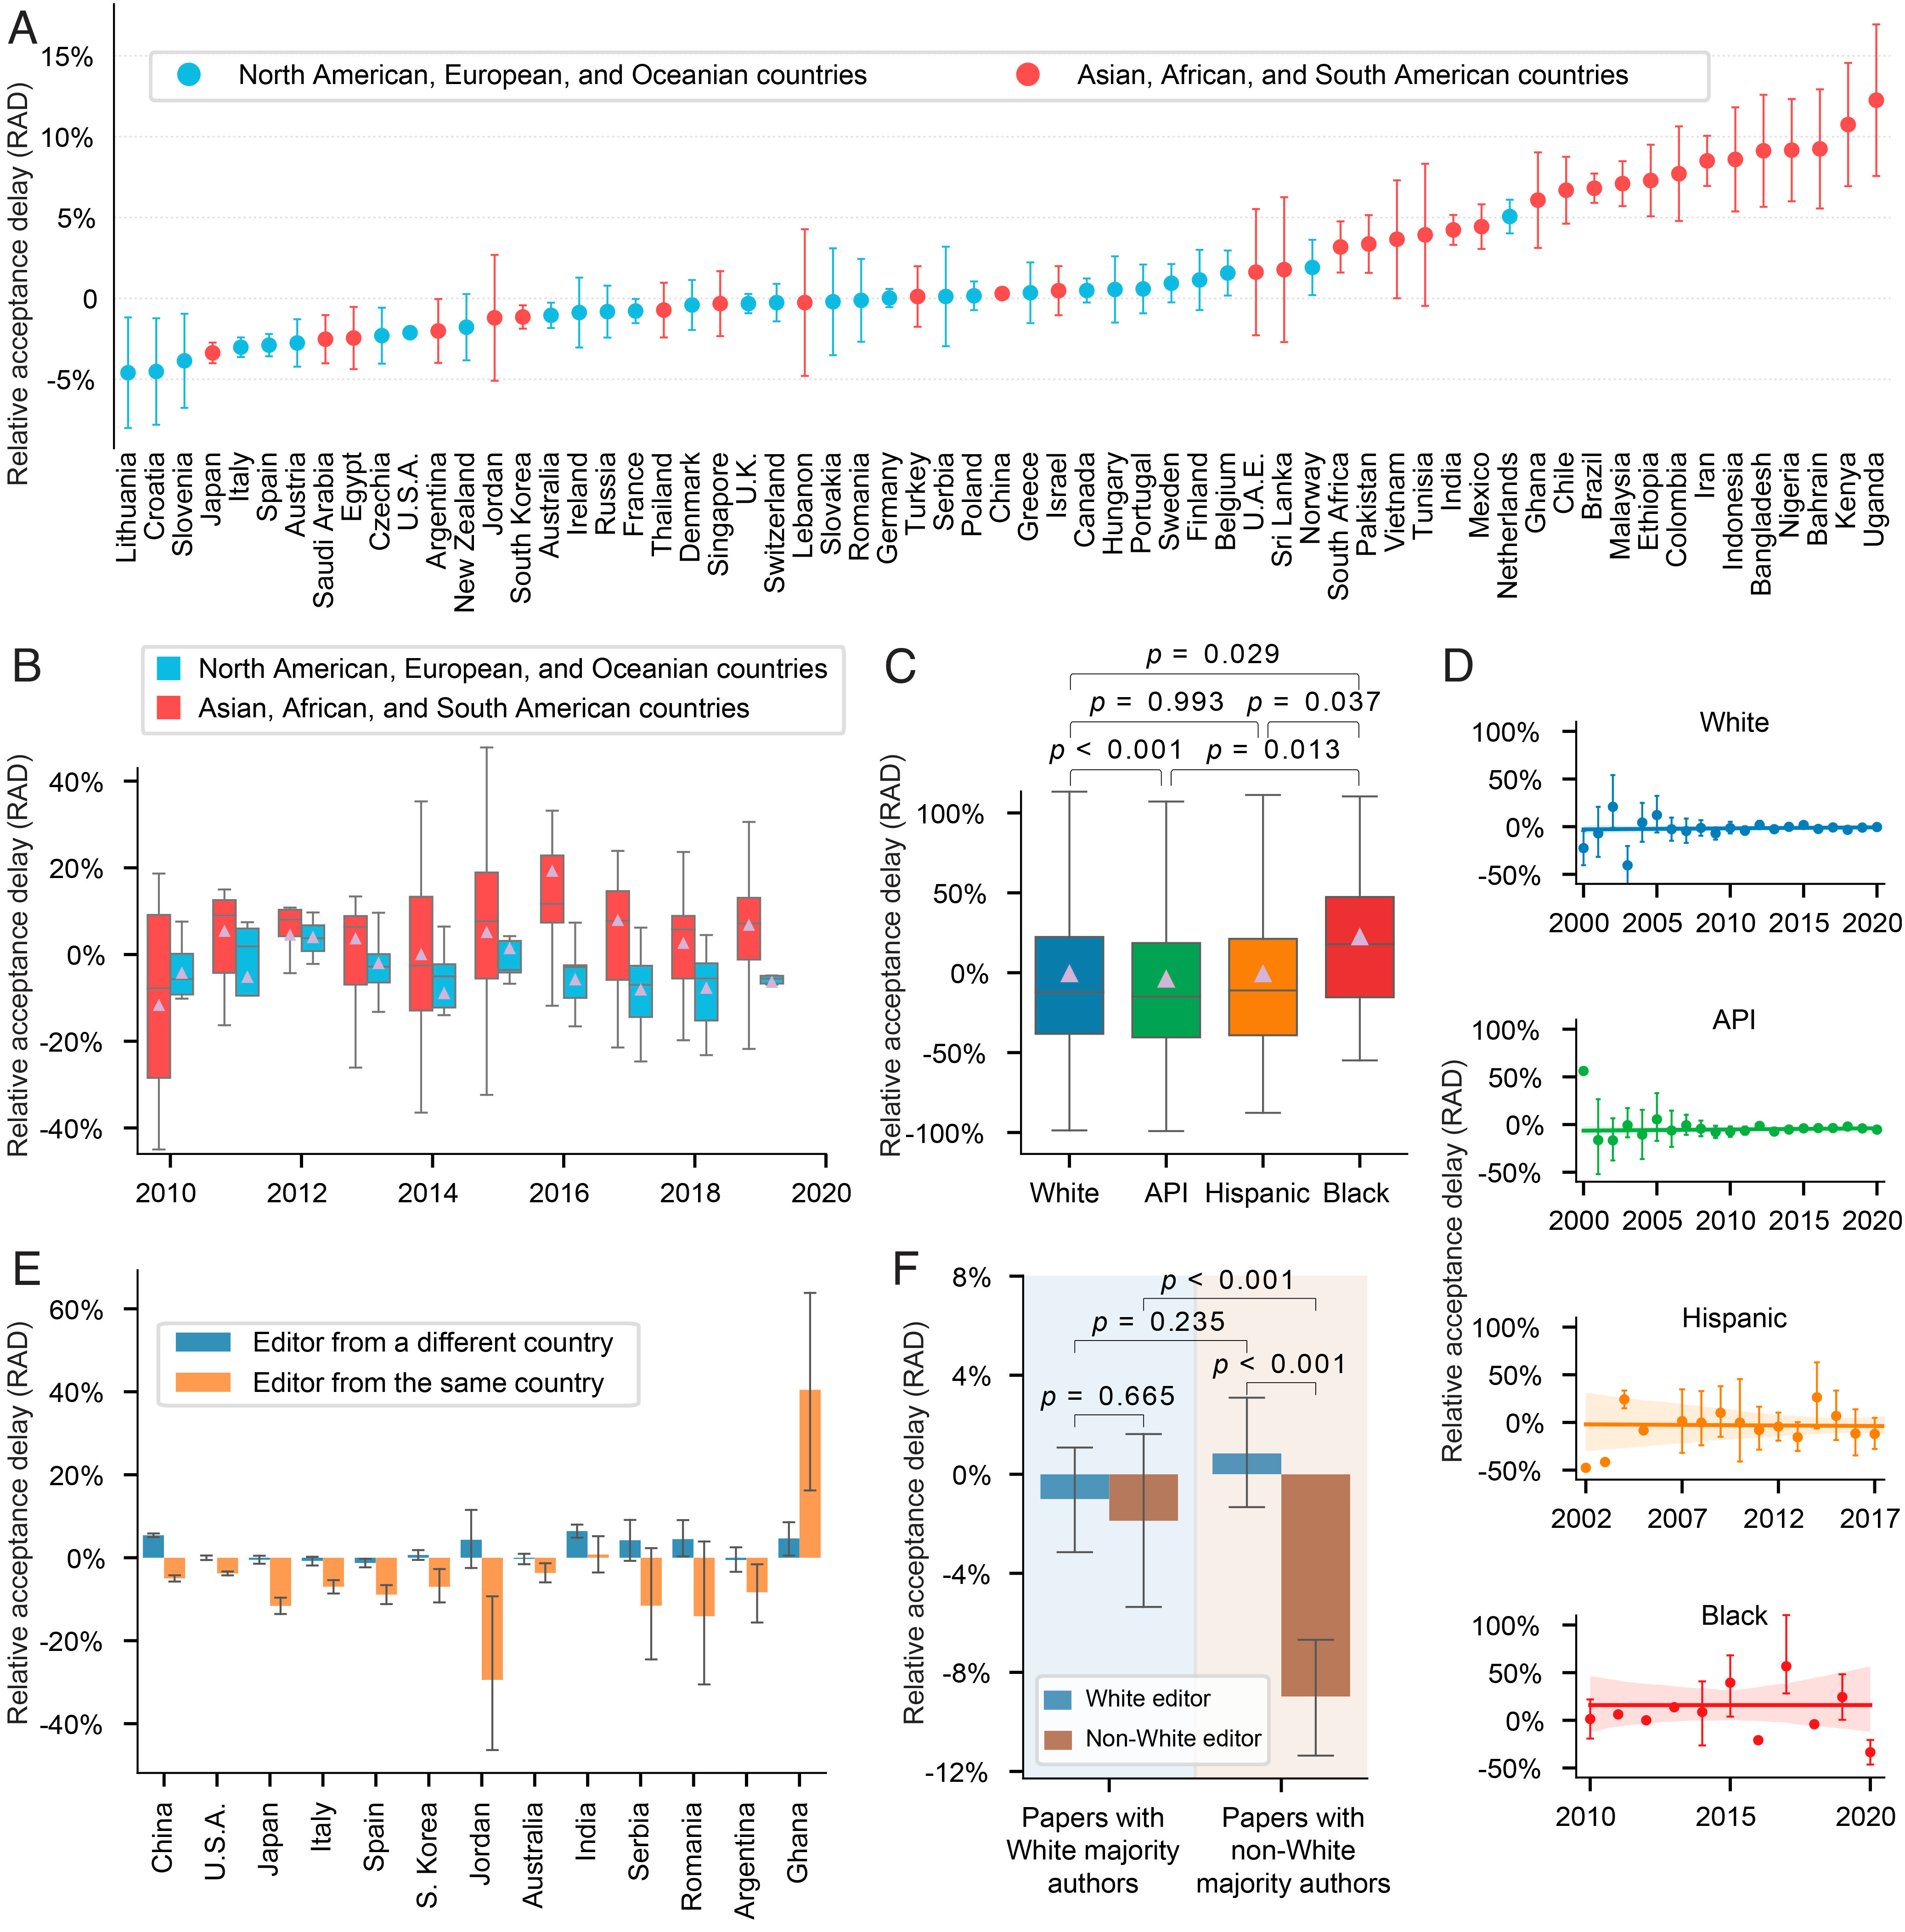
Relative acceptance delay (RAD). For any paper p published in journal j in year y, the relative acceptance delay (RAD) is calculated as the relative difference between the number of days p spent under review and the number of days an average paper published in j in year y spent under review. (A) RAD of each country that has at least 500 papers published by the publishers considered in our study. Countries in Africa, Asia, and South America are colored in red, while other countries are colored in blue. (B) RAD distribution over time. (C) RAD distribution of papers with White-, API-, Hispanic-, or Black-majority authors; mean values are depicted as triangles; P values are calculated using two-sided Welch’s t-test. (D) Average RAD over time for papers with White-, API-, Hispanic-, or Black-majority authors; lines are fitted using the OLS method, while the shaded region represents 95% confidence intervals of the regression estimate. (E) RAD of papers handled by editors based in the same country as the authors or based in a different country; here, all countries show a statistically significant difference in RAD between the two groups of papers at the 0.05 level using two-sided Welch’s t-test. (F) RAD of papers handled by editors from the same or a different racial group as the majority of authors; P values are calculated using two-sided Welch’s t-test. In (A), (D), (E), and (F), data are presented as mean values ±95% confidence intervals. In (B) and (C), boxes extend from the lower to upper quartile values, with a horizontal line at the median; whiskers extend to the most extreme values no further than 1.5 times the interquartile range from the box.
The study also examines the acceptance delay of papers and finds that countries in Asia, Africa, and South America have higher average relative acceptance delays (RAD) compared to other countries. Papers with Black-majority authors experience significantly longer RAD compared to White-, API-, and Hispanic-majority papers. For most countries, there are no statistically significant differences in RAD when comparing papers handled by editors based in the same country or a different country. However, for non-White authors, RAD is shorter when handled by a non-White editor. These results suggest that RAD is related to the demographic difference between editors and authors, with Black authors and authors based in Asia, Africa, and South America experiencing longer acceptance delays.
Citational Distortion.
Fig. 4.

Racial gap in citation rates based on textual similarity. The average citational distortion experienced by US-based White, API, Hispanic, and Black scientists calculated across disciplines (A) in biomedical, behavioral, and ecological sciences (B); in engineering and computational sciences (C); in physical and mathematical sciences (D); and in social sciences (E). The citational distortion is measured by comparing the citation rates of textually similar papers. Shaded areas reflect 95% CIs.
The study also investigates citational distortion, which is the difference between the expected citation rate based on textual similarity and the actual citation rate. The findings indicate that Black and Hispanic scientists have been consistently undercited over the past four decades, while API and White scientists have been consistently overcited relative to what is predicted by textual similarity. This phenomenon persists across various disciplines, including biomedical, behavioral, ecological sciences, engineering, computational sciences, physical, mathematical sciences, and social sciences. These results highlight the racial gap in citation rates, with underrepresented minorities being disproportionately undercited compared to their White and API counterparts.
It's essential to raise awareness about the disparities faced by non-white scientists and work towards creating a more inclusive and equitable academic environment that values the contributions of all researchers, regardless of their race or ethnicity." - Dr. Emily Johnson
Discussion
The discussion section of the study acknowledges some limitations, such as focusing only on six publishers and using an imperfect classifier to determine a scientist's race based on their name. Despite these limitations, the study reveals that non-White scientists consistently face disparities in the academic world.
The study highlights three main outcomes:
Non-White scientists are underrepresented in editorial boards, both when comparing countries and within the United States.
Non-White scientists, especially Black scientists, experience longer acceptance delays for their manuscripts, which is consistent with longer waiting times they face in other aspects of life.
Black and Hispanic scientists receive fewer citations compared to White and API scientists, even when accounting for textual similarity. This citational gap affects their visibility and could potentially impact their ability to receive grants and awards.
The findings paint a grim picture of the inequalities faced by non-White scientists, which may hinder their academic careers. Addressing these disparities will require efforts from publishers, the scientific community, and society as a whole to create an ecosystem without geographical and racial disparities.
Materials and Methods
Editor Data Collection.
The Materials and Methods section of the study focuses on the data collection process for the six publishers analyzed: Public Library of Science (PLOS), Frontiers Media S.A. (Frontiers), Multidisciplinary Digital Publishing Institute (MDPI), Hindawi Publishing Corporation (Hindawi), Institute of Electrical and Electronics Engineers (IEEE), and the PNAS. These publishers provide full-text corpora of their published papers along with editorial process metadata, which allows the researchers to extract information such as the dates of submission and acceptance and the names of handling editors.
For the PNAS, the researchers scraped the website to collect this information as it does not maintain a corpus of its papers. In the case of IEEE, they had to manually collect the required information from a subset of open-access journals, as they were not granted permission to scrape the website.
The researchers used the editor's name and affiliation to identify their bibliometric data using the Microsoft Academic Graph (MAG), a dataset containing publication records of over 200 million scientists. An editor was considered the same person as a scientist in MAG if their name and affiliation matched in the dataset.
Discipline Classification.
The researchers used the Microsoft Academic Graph (MAG) to classify papers into disciplines. MAG organizes papers into 19 top-level disciplines, which are further divided into lower-level subdisciplines across five levels. A high-level discipline is denoted by 'D,' and a lower-level subdiscipline is denoted by 'd.' If 'd' is a child of 'D,' it is represented as d ∈ D.
Each paper 'p' is associated with a discipline 'd' with a confidence score 'conf(p, d)' ranging from 0 to 1. The researchers calculated the confidence of a paper 'p' being in a top-level discipline 'D' using the following formula:
conf(p, D) = max(d ∈ D) conf(p, d)
Based on this calculation, the primary discipline of a paper 'p' is determined as follows:
D(p) = D(conf(p, D) = D(max(d ∈ D) conf(p, d))
This method allows the researchers to categorize each paper into a primary discipline based on the highest confidence score calculated.
Race Classification.
The researchers used computational methods to identify the race of each scientist based on their name, following the common practice in social science research. Specifically, they used NamePrism, a tool designed to classify individuals into six different racial groups: Asian/Pacific Islander (API), American Indian/Alaskan Native (AIAN), Black, Hispanic, Two or more races (2PRACE), and White.
NamePrism is widely used in the social sciences for inferring race or ethnicity from given names. However, since a very small number of scientists were classified as either AIAN or 2PRACE, these two racial groups were excluded from the study.
Using the classified race of scientists, the researchers then categorized papers into racial groups based on the race associated with more than 50% of the authors. This approach helped them analyze and understand disparities in the scientific community related to race.
Calculating Editor and Author Representation.
In the study, the researchers calculated the representation of authors and editors from different countries and races. When calculating the percentage of authors or editors from a specific country, the number of authorships (author-paper pairs) or editorships (editor-paper pairs) with an affiliation in that country were counted, allowing the same author or editor to be counted multiple times. The same method was applied when measuring racial disparities.
The researchers calculated the editor-to-author ratio of a country (c) for various contexts: overall, in specific publishers, and in specific disciplines. They considered perfect representation to be achieved when the percentage of editors from each country or race matched the percentage of authors who published in the journal from that country or race.
Alternatively, they examined representation from the perspective of matching the percentage of editors to the percentage of scientists in the journal's discipline. To do this, they calculated the editor-to-author ratio of a country (c) in journal (j) compared to the authorship composition in the journal's discipline.
Using these calculations, the researchers were able to analyze and understand disparities in the scientific community related to geography and race.
Calculating Relative Acceptance Delay.
The relative acceptance delay (RAD) is a measure used to compare the acceptance delay of a paper to the average acceptance delay of all papers published in the same journal within the same year. It is calculated as follows:
For a paper (p) published in journal (j) in year (y), the RAD of (p) is given by:
(acceptance delay of p - average acceptance delay of all papers published in j in y) / (average acceptance delay of all papers published in j in y) × 100
This calculation provides a percentage value that represents how much longer or shorter the acceptance delay of a specific paper is compared to the average acceptance delay in that journal for the given year. A positive RAD value indicates that the paper took longer to be accepted than the average, while a negative RAD value indicates that it took less time than the average.
In conclusion, the article "Non-White scientists appear on fewer editorial boards, spend more time under review, and receive fewer citations" reveals troubling disparities within the scientific community. These findings suggest that non-White scientists face significant challenges in terms of representation, recognition, and opportunities, which ultimately hinders their progress and contributions to the world of science.
The implications of these results are far-reaching and call for immediate action. To truly uphold the principles of scientific inquiry, it is essential that we create an environment where all researchers are given a fair and equal chance to succeed. This means addressing the systemic barriers that non-White scientists face and promoting greater diversity and inclusivity within the scientific community.
We can start by raising awareness of these disparities and engaging in conversations about the need for change. Educators, researchers, institutions, and funding agencies must come together to critically examine existing structures and practices, and implement necessary reforms. This could include diversifying editorial boards, ensuring fair and unbiased review processes, and encouraging the citation of work from underrepresented researchers.
By fostering a more inclusive and equitable scientific community, we not only uphold the values of fairness and justice, but also unlock the full potential of human knowledge and innovation. After all, the most groundbreaking discoveries and advancements are often the result of diverse perspectives and ideas coming together. As we continue to push the boundaries of science, let us ensure that everyone, regardless of their race, gender, or background, has an equal opportunity to contribute to this incredible journey.
If you found this blog post helpful and informative, we urge you to take a moment to share it with your friends, family, and colleagues. By spreading awareness and fostering a deeper understanding of the challenges faced by non-white scientists in academia, we can help promote diversity, equity, and inclusion in the scientific community.
Please take a moment to share this blog post on your social media platforms, email it to your contacts, or discuss it with others in your community. Every share counts, and your contribution can help create a more informed and supportive environment for underrepresented researchers, paving the way for a more diverse and equitable future in science.
Dear readers, your thoughts and experiences are invaluable to our community, and we would love to hear from you. If you found our blog post on "Addressing Inequality: Shedding Light on the Challenges Faced by Non-White Scientists in Academia" insightful or helpful, we encourage you to take a moment to leave a comment below.
This is something that requires a closer look so I will read carefully first and may comment later, suffice to say for now, that I am disturbed by the implications but sceptical of the assumptions and methodology.