


How Low Could Tesla Go? The Case For $20
How Low Could Tesla Go? The Case For $20
Bulls see the bottom at $180; Bears eying levels under $100; Ultimate low could be $20

As Tesla fell by 16% into its January 24th earnings results, the bulls were resolved on buying more Tesla shares if it “falls below $200”. Both the earnings results and 2024 outlook were diabolically bad, so the bulls got their wish of an “under-$200” entry point.
The stock is now consolidating around the $185 level and many of the bulls are declaring that Tesla’s price has “bottomed”. A bounce in the shares is certainly in order, given their 25% decline year-to-date against the Nasdaq 100’s 6% rise.
However, given the weak fundamentals at Tesla (which already cut prices by 6% in China and the EU last month), it’s hard to imagine a sustained rally in Tesla’s shares. In fact, the stock is still egregiously overvalued when compared to rival automakers, which trade at a fraction of Tesla’s valuations and have superior profitability and growth outlooks.
Before discussing what fair value for Tesla could be based on normal automotive valuations, a few points about its weak fundamentals and how far removed consensus estimates are from reality:
Old Models Don’t Sell Without Discounts: Tesla has an old model lineup that last year required 5 price cuts in the US, 3 in China, and 2 in Europe to keep its factories running. This won’t change anytime soon as Tesla has no new products in its pipeline until 2026, at the earliest. If it stops cutting prices, volumes will drop and the capacity utilization at its new factories in Texas and Germany—which operated at 47% and 38%, respectively, last year—would fall even lower.
Lower Prices and Lower Growth in 2024: While price cuts last year led to delivery growth of 38% YoY, pre-tax profit dropped by 27% YoY. With Tesla itself saying that 2024 delivery growth should be “notably lower” than 2023, the scope for deeper profit declines is large given further price cuts.
The Street Has Been Overly Optimistic on Tesla: Consensus estimates have consistently been too high and Tesla missed Street estimates for six consecutive quarters since Q3 2022. At the start of last year, non-GAAP EPS estimates for 2023 were $5.23, whereas the actual result was 40% lower at $3.12 in the end.
2024 EPS Estimates Should Fall Further: 2024 consensus estimates of $3.09 are lofty considering lower growth and further price cuts. 2024 non-GAAP EPS estimates have fallen by 20% in the past month and by 36% from 6 months ago (see Figure 1). As I write, 2024 EPS just dropped by 0.6% from $3.11 to $3.09. My estimate for 2024 non-GAAP EPS is $1.88, which puts Tesla on a PER of 92x versus consensus at 61x.
Figure 1: Tesla Consensus Non-GAAP EPS Estimates in Free Fall

Source: Bloomberg
Valuations Didn’t Matter in the Past: I hardly ever checked on Tesla’s valuations ever since its market cap became bigger than Volkswagen’s in January 2020 and Toyota’s in July 2020. Valuations clearly didn’t matter to those bidding up Tesla’s shares back then, but ever since growth began stalling in Q3 2022, it feels like valuations are slowly being scrutinized.
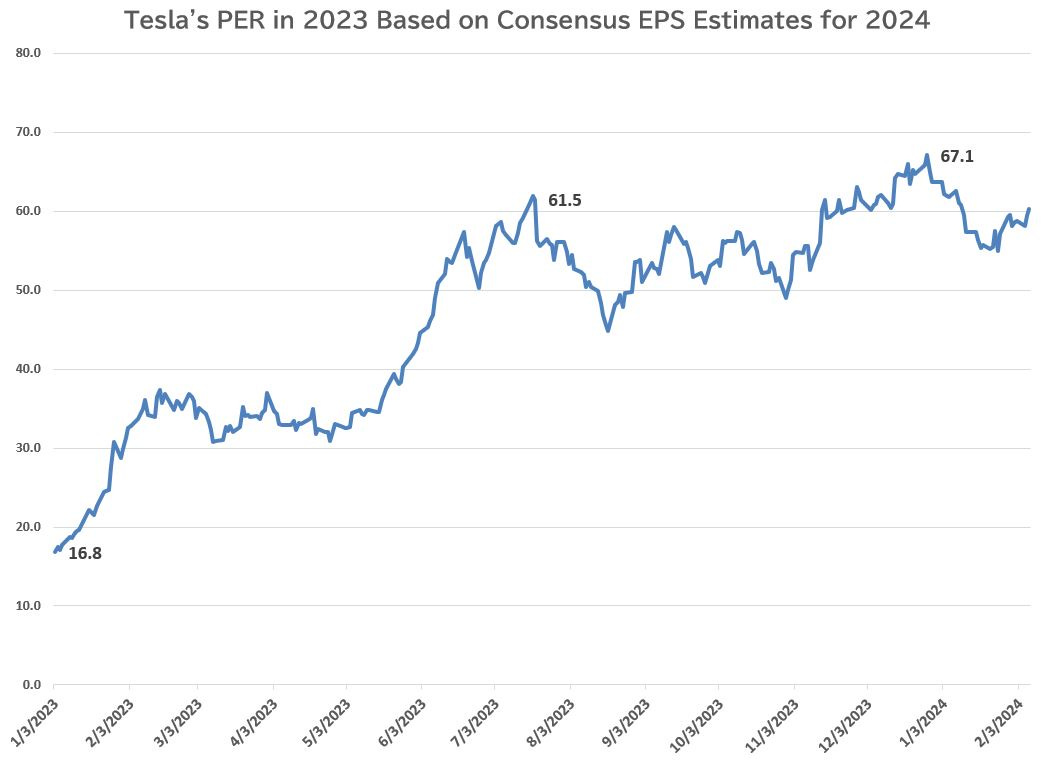
PER of 68x Could Cap the Stock at $210: Using the rolling consensus EPS estimates for 2024 shown in Figure 1, Tesla’s PER trend in 2023 is interesting (see Figure 2). The low of 16.8x 2024 EPS estimates last year was when Tesla traded at a 2.3-year low of $108 on January 3rd. Yet, despite Tesla’s 2023 share price high of $293 last July, the PER high of 67.1x came on December 27th, when Tesla closed at $261.
Tesla’s PER rose more than its share price last year due to 2024 consensus EPS estimates dropping so quickly toward the end of 2023. Note that, in Figure 3, the PER has risen since Tesla’s January 24th earnings call while the share price has dropped. Consensus EPS estimates are falling at a faster pace than the share price.
A PER of 67x 2024 earnings seems to be as much as the market is willing to award Tesla these days (the current average for the major carmakers is 7.1x). If this is true, a dead-cat bounce for Tesla could see its high at around $210, or 68x current 2024 EPS consensus of $3.09.
Figure 2: Tesla’s PER in 2023 Based on 2024 Consensus Estimates
Source: Bloomberg
Figure 3: Tesla’s 2024 PER Rose More Than the Stock in 2023

Source: Bloomberg
Factors Behind Auto Stock Valuations
Excluding Tesla, the most richly valued passenger carmaker is Toyota, which trades at a 36.5% premium to the average carmaker on a PER basis (see Figure 4, which is sorted by EBIT margins, from highest to lowest). These are the major factors behind why Toyota trades at higher valuations than its rivals (excluding Tesla) and how Tesla should trade once the market treats it like an auto stock:
Profitability, Returns & Growth: Toyota is the most profitable carmaker in 2024 based on its 15.3% EBIT margin and sports the second-highest RoE after BYD. EBIT growth of 12.4% in 2024 is also second only to BYD, which is expected to see its EBIT grow by 26.5% this year.
Diverse Global Footprint: Not being too dependent on one market is key for automakers as weakness in, say, North America can be offset by strength in Asia. Toyota has the most diverse global revenue base in the auto industry. While North America is its largest market at 38% of revenues, it sees 17.4% of sales come from Asia, 17.2% from Japan, 15.5% from emerging markets and 11.4% from Europe. By contrast, GM saw 90% of 2023 revenues in North America and Tesla generated 50% of its revenues there last year. If the North American market slows down, Toyota has revenue streams from other markets to help offset that.
Dominant Share in Multiple Markets: Toyota has over a 50% share of the Japanese car market—the world’s third largest—and the top share in most ASEAN markets. In the US, Toyota vies with GM for top share and came in number two last year, with a 14.5% share of the US market versus GM’s 16.8% share.
Less Exposure to Europe: The valuations of the German carmakers in Figure 4 are cheaper than their rivals due to Europe being an unprofitable market. Each country favors its own flagship brand over others, making it tough for any one carmaker in Europe to have a dominant share of the region. In markets where there the top 3 carmakers take up a large part of the market (e.g. the US and Japan), competition is much less severe. Toyota only derives 11.4% of its revenues from Europe, making it the fifth largest region for Toyota sales.
Figure 4: Valuations & Returns by Major Carmaker

Valued as an Auto Stock, Tesla is Worth $20
As can be seen in Figure 4, Tesla has the highest valuations among major carmakers, yet the lowest profitability, growth, and returns in 2024. Even if it survives until its next-gen model goes into mass production in 2026, Tesla could see a drastically weakened balance sheet by that time.
The fact that Tesla trades at such high valuations, despite the horrible fundamentals it faces, is largely due to a lingering view that Tesla is a “tech” stock and more recently, an “artificial intelligence”, or AI stock. Nothing could be further from the truth and here are the main reasons why Tesla is merely a carmaker:
Full Self-Driving is not AI: There is no real AI at Tesla unless you consider its Full Self-Driving (FSD) driver-assist product to be “AI”. FSD operates Tesla cars like a drunk driver and is still at risk of being recalled by regulators. Given FSD’s inability to replace human drivers in Tesla cars, it should not be considered as something that gives Tesla an “AI” valuation premium.
No Sign of the “Dojo” Supercomputer: Dojo is Tesla’s supercomputer that trains FSD. Not only is there not one mention of “Dojo” in Tesla’s financial statements, but Musk actually downplayed it on Tesla’s earnings call two weeks ago, saying the following: “I would think of Dojo as a long shot. It's a long shot worth taking because the payoff is potentially very high. But it's not something that is a high probability. It's not like a sure thing at all. It's a high-risk, high-payoff program.”
Gross Profits Don’t Lie: In 2023, 93.5% of Tesla’s gross profit came from its Automotive operations, while the rest was from its Energy business. Until there’s a separate line item in Tesla’s income statement showing profits from its “AI” business, it would be foolish to assume Tesla needs an AI premium on its valuation.
In Figure 5 there are comparisons of EV/EBITDA versus EBIT margins, price-to-book ratios (PBR) versus return on equity (RoE), and PER versus EBIT growth in 2024. In general, the higher the EBIT margins, RoE, or growth, the higher the multiples. The outlier is Tesla, which should see its non-GAAP EPS drop by 39.2% to $1.88 this year and likely go negative in 2025 and 2026 if it survives.
Figure 5: Valuations & Returns By Major Carmaker in 2024

Looking at the “Average Ex-Tesla” valuations for EV/EBITDA, PBR, and PER in Figure 5 can provide a benchmark for what multiple Tesla should trade at given its negative growth and industry-low profitability:
Tesla at the industry average EV/EBITDA of 3.1x is worth $16: This assumes a 2024 automotive EBITDA of $9.19 billion and net automotive cash of $22.3 billion. One could argue that Tesla should trade below Ford’s multiple of 2.8x, given that Tesla has a lower EBIT margin than Ford’s.
Tesla at the industry average PBR of 1.0x is worth $22: This is a generous assumption given that carmakers with RoEs as low as Tesla’s 7.2% would trade below book value (look at VW’s 0.3x PBR). Tesla’s 2024 book value per share is $21.51.
Tesla at an industry average PER of 7.2x is worth $14: This again is generous given that Tesla is facing steep negative earnings growth this year, while the industry average EBIT growth is 6.0% in 2024.
Taking the average of the three fair value estimates above yields a target price of $17.02 for Tesla. Giving it the benefit of the doubt and adding a 20% premium yields a fair value estimate of $20.42 based on my 2024 earnings estimates.
The outlook becomes worse in 2025 and if Tesla cannot get its next-gen platform mass-producing by 2026, Tesla may not survive. It’s exactly when the market has this realization that Tesla could easily fall to $20 or lower. Look out below.
Great analysis. Sprinkle on top the non-zero risk due to ongoing federal investigations (DOJ, SEC, NHTSA). They are likely waiting for the right time to unleash the Kraken.
Add the contingent liabilities risk and you are even closer to 0.