

IF INTERESTED #173: Performance does not follow normal distribution
IF INTERESTED #173: Performance does not follow normal distribution
no, it doesn't.

hi,
This issue will be a summary of team performance research: Team Performance: Nature and Antecedents of Nonnormal Distributions, by Kyle Bradley and Herman Aguinis. It is a recent paper, published in 2022.
I will give the simplified summary of the paper first with what I have understood from it, and then quote the paper for more academic people. As my understanding can be limited and I don’t want to anger the more academic audience : ).
Their methodology and hypotheses also contain valuable insights for the literature, not only the final conclusion. I will try to explain the mechanisms of team performance creation as well.
The research analysed 200.825 team performance data and 274 performance distributions. Decent sample size. Here is the main conclusion of the research:
Only 11% of the distributions were normal, star teams are much more prevalent than predicted by normality, the power law with an exponential cutoff is the most dominant distribution among nonnormal distributions (i.e., 73%)
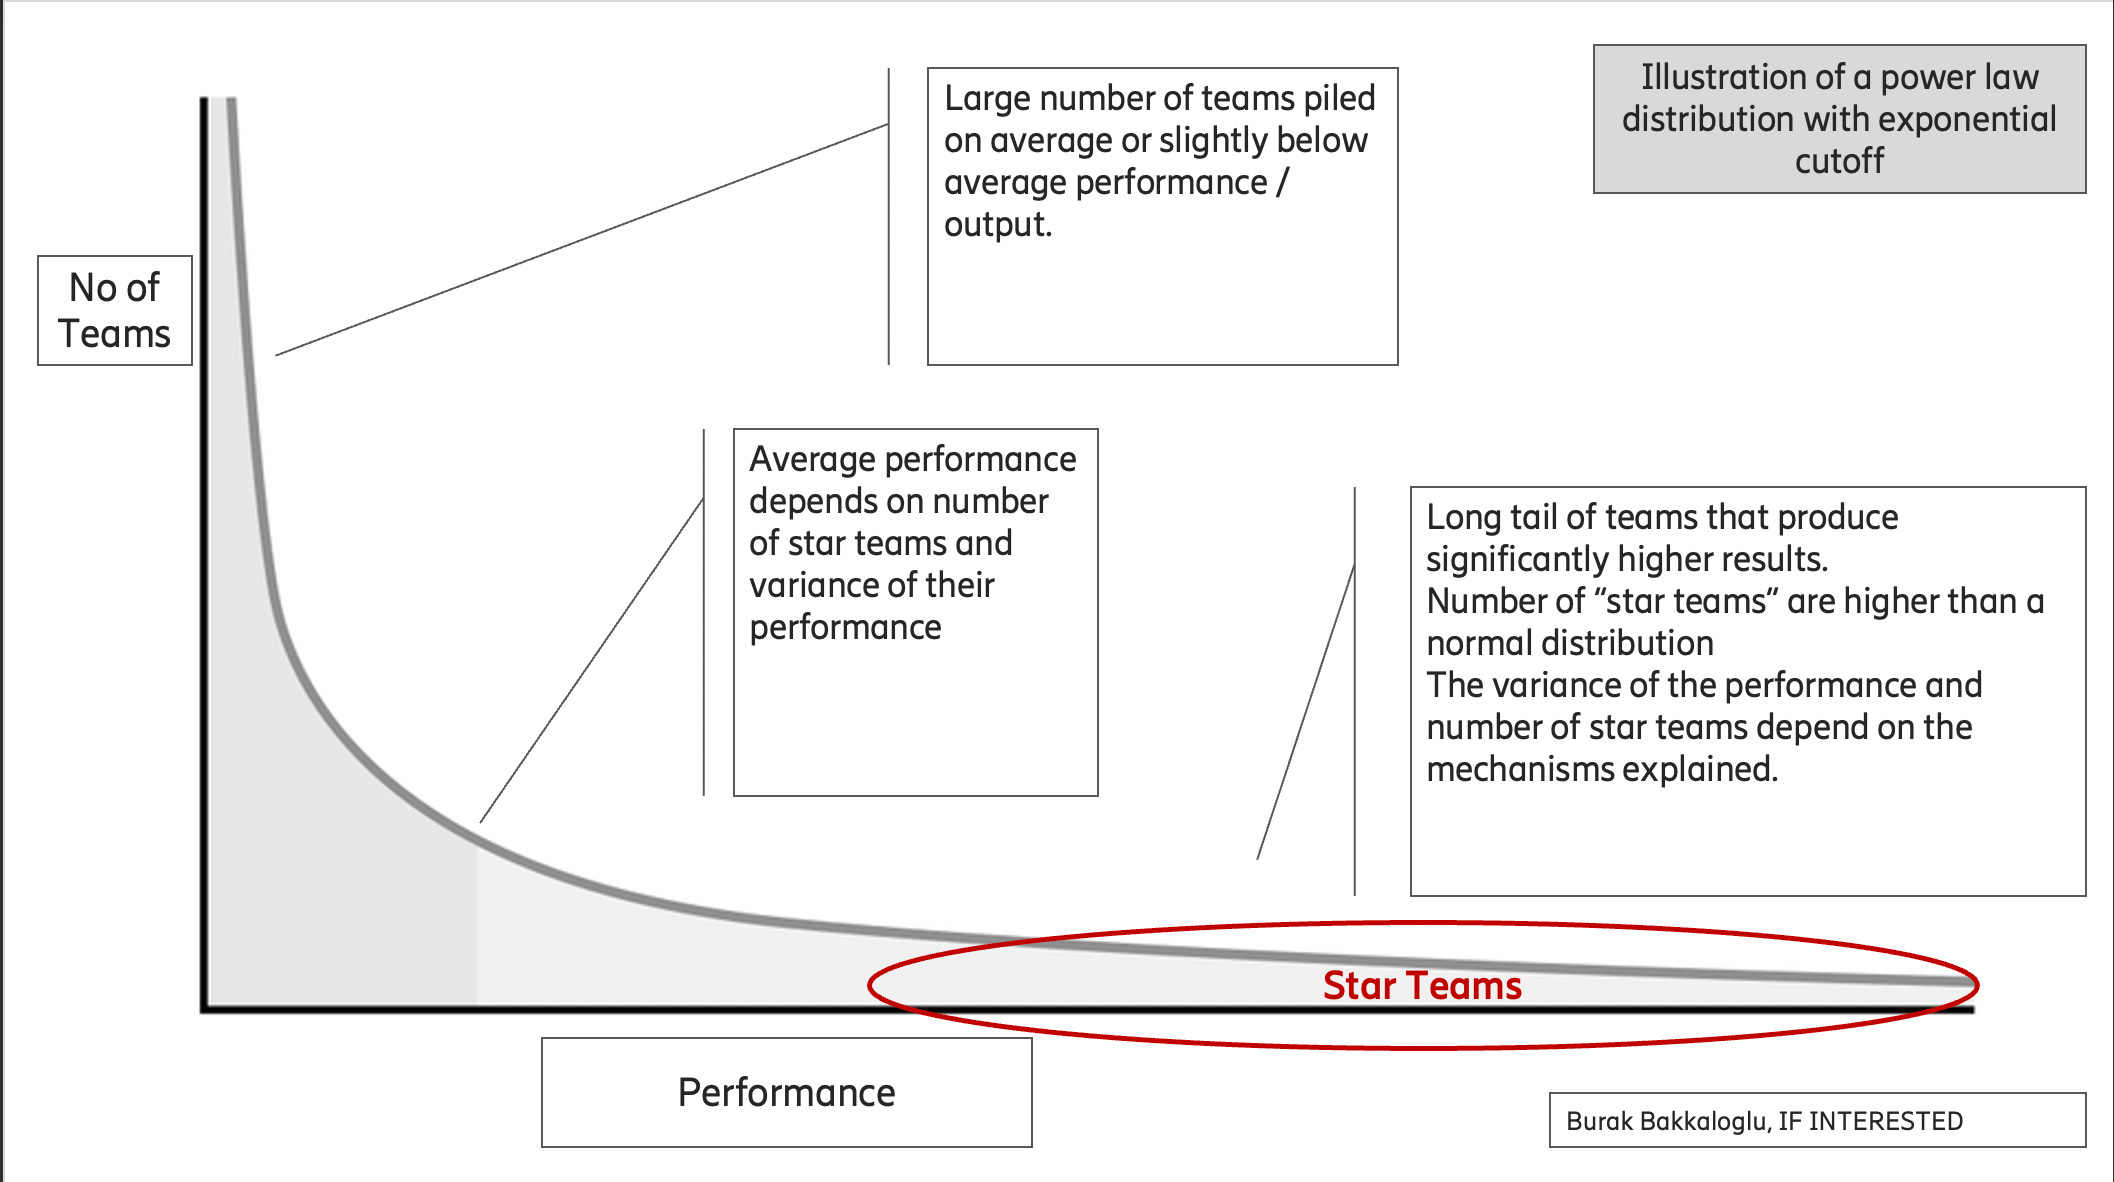
Yes. Only 11% of distributions were normal distributions. The majority followed a distribution called “power law cutoff distribution”. Don’t get hung up on the name, it did make me roll my eyes as well, but the shape is familiar.
Below is a visual with my notes (and hopes to simplify). I might be off with some of my assumptions, and for those who know math better, please send me a note and correct me. After all “power law with exponential cutoff” is not your daily coffee topic : ).
The Bradley-Aguinis duo published a paper in 2017, which focused on individual performance and came up with similar results. According to that research, individual performance also does not follow a normal distribution.
Here is the intuitive normal distribution we all recognize:

A good analogy is that Ed Sheeran, Billie Eilish, and Ariana Grande1 sell massively more than the average artist - average is considerably lower than the best achievable.
Two complications:
There are way more “star teams” compared to what you would expect from a normal distribution.2 Also star teams outcomes are way better than what a normal distribution would show. In short: star teams are more common and have significantly more impact.
Complication 1: What does that mean for our organisation design and team dynamics approaches?
Many teams will fall to the bracket of average or slightly below average performance. This doesn’t mean that you have bad teams in your organisation, it means where you set “average” is important. Average performance vs expected performance can be different.
Complication 2: What is an acceptable level of “good performance”, is it slightly below average?3 This requires a careful perception management, otherwise it will have a negative impact.
Two important clarifications:
The values in the analyses are not performance evaluations like “exceeding expectations” or “good performance”, they are actual values: Revenue of the sales teams, number of wins of a football team, throughput of a software development team, etc.
If you have many star teams with very high outcomes, it will take the average significantly upwards.
As a summary, you can simply stop reading here and I hope this has created few good questions in your mind. But the paper mentions the performance generating mechanisms as well. Here is a deep dive to what generates high performance in teams:
Four Generating Mechanisms of Team Performance
There are four mechanisms that trigger the nature of team performance: incremental differentiation, proportionate differentiation, self organised criticality, and homogenisation.
These mechanisms trigger different distributions of performance as shown below. You can simply ignore that picture if you want. Good to keep in mind the research concluded the “incremental differentiation” is the most common distribution, you can ignore the others.
1. Incremental Differentiation
Simple explanation:
This is the first mechanism that generates star teams. Incremental increase of the performance by learning and adapting through time. Learning is not meant here in its classical form like taking a class, but rather learning from other teams, learning from mistakes, learning from experienced team members. Teams learn and perform incrementally better. That statistically results with the power law distribution.
An important fact is the trajectory of incremental improvement results in star teams performing way better than the average and also with a large variance among star teams.
Academic Version:
For example, teams that can consistently learn and adapt to changing conditions will continue to compound their advantages over other teams. These performance trajectories represent the linear increase in the average amount of output a team is able to produce in a specified time period, resulting in this specific type of distribution.
Under these distributions, star teams are common, but diminishing returns lead to smaller variability between star teams. With incremental differentiation, teams with higher performance trajectories are predicted to eventually rise to stardom, whereas those on lower trajectories do not.
2. Proportionate Differentiation
Simple Explanation:
This is similar to the incremental differentiation, with the difference that the initial performance of the team has a bigger impact. A good performing team increases its performance through time, whereas a team starting at a sub-optimal level spirals down to bad performance. The difference to the first mechanism is in the distribution: The star teams in this mechanism don’t perform differently from each other. The trajectory has less cumulative effect, the starting point defines the stardom.
This mechanism and related distribution is less common than the first one. The smaller variance in the star team output leads to a “lognormal distribution”. See the figure below.
Academic Version:
Second, in proportionate differentiation, both the initial level of performance for a team and the performance trajectory of the team lead to the generation of lognormal distributions due to processes that lead to output loops. Under these types of distributions, star teams are common but variability between star teams is not as great as under other heavy-tailed distributions.
Much like self-fueling performance spirals, teams that start off with a high level of performance can leverage their prior performance to continue to build on that success (Lindsley et al. 1995). For example, Banker et al. (1996) reported that teams starting with a high initial level of performance continued to improve over time at a much higher rate than others. Similarly, because of the existence of negative performance spirals (Lindsley et al. 1995), many teams set in motion processes that lead to a very large pile of poorly performing teams that in turn results in more star teams by comparison. Additionally, theories regarding team composition note that the makeup of a team can lead to differences in initial levels of performance and improvement in performance trajectories moving forward
3. Self-Organized Criticality
Simple Explanation:
This mechanism is based on a trigger event that will enable the teams or the whole organisation make a leap. A good example is the iPhone team that pulled off a giant leap with the Apple screen touch functionality, and they built on that trigger event. Happens to be a pure law distribution, a detail you can ignore for the simplicity.
Academic Version:
This mechanism is likely present when critical states are achieved as a team accumulates components that are interconnected. For instance, if a team is concurrently working on multiple projects (i.e., components) that are closely related to each other (i.e., interconnected), a small breakthrough on one project can lead to break throughs on multiple projects simultaneously.
4. Homogenisation
Simple Explanation:
This mechanism triggers our famous normal distribution. There is a regulating element, that does not allow teams perform either significantly better or significantly worse. This can be teams working on a production line, the output of teams are dense around the average, and we don’t have too many outliers. This is also typical with administrative and repetitive tasks and is a less common distribution.
Academic Version:
Finally, homogenization drives the emergence of symmetric and potentially symmetric distributions (i.e., normal, Weibull, and Poisson) due to processes that reduce differences among teams’ output. Under these distributions, star teams would be uncommon because the majority would cluster around the average
Here is the visual of four mechanisms and the distributions they cause. As I mentioned above, you can easily ignore this picture, I personally find it overwhelming.

Are you still with me? I got really confused when I first read those.
Take your second deep breath, we have one more angle to cover: We said the team learning (curve) is an important aspect for incremental differentiation, which was the initial and most common mechanism. I am now double clicking to that theory:
Structural Characteristics of Team Learning
Specifically, differences in learning rates across teams can lead to extreme performance differences and therefore help us understand the emergence of different distribution types
The paper hypothesises that the three characteristics explained below might have an impact of how the star performance variance will be between teams.
In their review, Hollenbeck et al. (2012) described the three main characteristics of teams that have played a prominent role in the creation of the various classifications: authority differentiation, temporal stability, and skill differentiation
I chose to simplify those 3 terms for my own cognitive wellbeing, here are my versions: Leadership and Decision-Making Factor, Team Stability and Expertise in the Team.
Leadership and Decision-Making Factor: Whether the decision making is done by consensus or voting on one end of the spectrum, or whether the decision is made by a single point in the team that is the leader.
Strong leadership on teams can enhance coordination and can amplify the advantages that some teams have over others (Greer et al. 2018). Because the leader is tasked with making strategic decisions for the team, the rate of team learning and the performance trajectory should be greatly impacted by the decisions of this single individual. Therefore, when a single star performer in terms of both task and team functions is on the team (Volmer and Sonnentag 2011), team performance is positively impacted. As such, when authority differentiation is high, teams that learn to use these star performers in leadership roles are likely to show higher performance trajectories.
Team Stability: How stable and long tenured the team members are. On one end we have constantly changing teams, and on the other an established team with limited or no changes for a long time period. In short, changing team members are only ok when you get good expertise and good people in. Otherwise stick to the team you have. Intuitive. Don’t forget the second mechanism though, if you have a bad performance starting point then there is a chance that it spirals down.
Although teams that stay together longer typically demonstrate higher average performance (Gibson and Gibbs 2006), research has not yet addressed the impact of temporal stability on the variability of team performance. The external team learning literature (Bresman 2010) offers insights regarding this issue. Specifically, the rate of team learning and performance can be negatively impacted by frequent changes in team membership (Kane et al. 2005 Edmondson et al. 2007). However, the negative impact on learning and performance can often be mitigated through a number of means (e.g., incoming member knowledge; Kane et al. 2005). Accordingly, lower levels of team stability (i.e., more frequent team member turnover) offer greater opportunities for teams to generate varying levels of learning and performance. In addition, low temporal stability has a negative impact on learning and subsequent performance (Reagans et al. 2005). This is especially true for learning that takes place externally to a team. When teams are higher in temporal stability, they use time and resources to learn from the successes and mistakes of other teams
Expertise in the Team: How the team members’ roles differ in skills, how much we can substitute one member of the team with the other in terms of their skills. E.g. an order-processing team with equivalent skills vs a scrum team of product lead, developer and architect.
high skill differentiation are likely to result in distributions with large variability and a greater proportion of star teams than those characterized by low skill differentiation. Specifically, specialization of individual members of teams can lead to performance enhancements due to a reduction in cognitive load, an increase in the available knowledge for a team, and a reduction of redundancies that can hamper performance
Summary of impact of the three characteristics:
The research found out that temporal stability (team stability) had four times higher impact than authority differentiation (leadership and decision making). Both characteristics increased the performance variability resulting in a higher number of star teams in the distribution. Skills differentiation (expertise in the team) had no significant impact.
Please note it doesn’t mean that skill differentiation is not needed for star performance. It means, you should have the skill differentiation as much as the context requires, not more. Further differentiation won’t bring better team performance. There is (mostly) no need to have a world-renowned professor for each role you have in the team. This is a crude interpretation from me, which might be too simplistic.
Limitations of the paper:
The sample size is decent. However, they are more focused on teams from sports, politics and academia. There are some business teams included in that sample as well. They explain in the paper that sports teams have very similar dynamics as teams in business. I don’t see the sample diversification as an issue, but good to keep the mix of sample in mind. To be fair, measuring performance in much of the business world is considerably more subjective and difficult.
The researchers seem to take into account many variables like the context of the teams (competitive vs collaborative, etc.), they might have missed some externalities, but generally their method looks solid.
My conclusions:
Knowing that individual and team performance do not follow a normal distribution is a big step towards understanding the real-life dynamics. We can now question other conventional wisdom around performance management and find better ways to develop people and teams.
Considering the big difference between a star team’s output and an average one, the topic becomes critical to organisation success. Using the performance mechanisms and enablers, we can now focus on team dynamics.
The performance evaluation scales, (E.g.: below expectation, meets expectation and above expectation) are layers that we apply to a complex world to make it simpler. We might have a false representation of the world and arrive at wrong conclusions. Remember the bell curves from college, in hindsight we realise how damaging they were. We should not repeat those mistakes.
This paper only aimed to ignite curiosity and the need for further research. In your organisations, you might find out that the performance follows a completely different distribution and has different mechanisms. This is a good chance to break free from HR Dogma : ). Advanced analytics together with behavioural science will unlock valuable insights for organisations.
I want to repeat that I am not an expert in any of those fields. I merely summarise thoughtful scientific work. My hope is to create a platform for healthy conversation and learning. This paper contributes to that.
If Interested.
I did look it up. 2022 top 10 most popular singers.
With normal distributions, it is rare to see performance above 3 standard deviations
Or should we use “Median” and not average?