
Carvana deep dive ($CVNA)
Carvana deep dive ($CVNA)
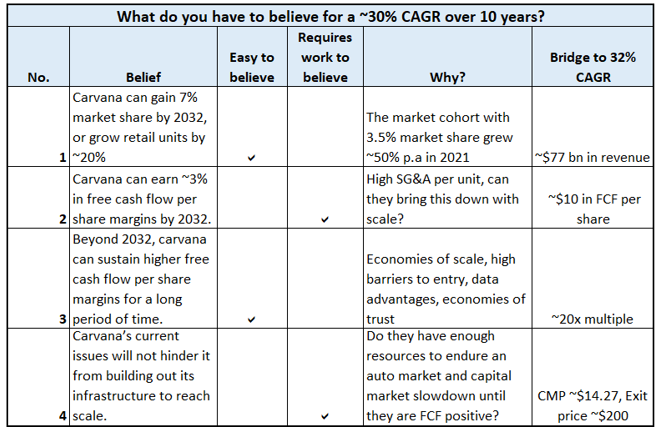
What do you have to believe for a 30% CAGR over 10 years?

Update: Based on feedback from peers and a fund manager as well as recent results from Ally and Carmax, I made a few edits to the post on 11/01/22, which incorporates a more bearish view on the unit sales over the next few quarters.
Investment thesis
The retail industry
Joe Frankenfield of Saga partners wrote an interesting piece on the history of disruptions in the retail industry.
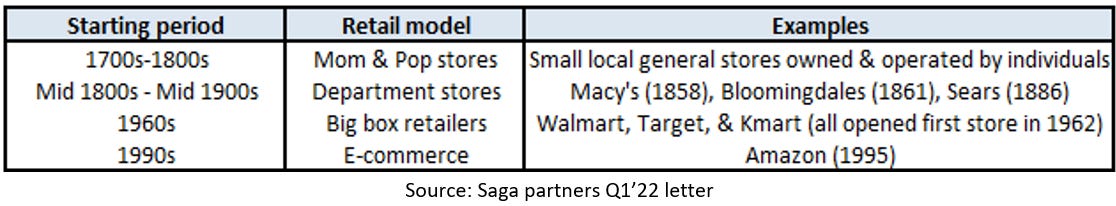
He proposed that each disruption had the same economic pattern. The newer model had higher upfront costs, yet at scale, although the gross margins were lower, higher efficiency (inventory turns) allowed for lower prices than the incumbents and an attractive return on capital.
Here's an excerpt from the letter:
“The average successful department store earned gross margins of ~40% and turned inventory about 3x per year, providing ~120% annual return on the capital invested in inventory. The average successful big box retailer earned ~20% gross margins and turned its inventory 5x per year. Amazon retail earns ~10% gross margins (including fulfillment costs in COGS) and turns inventory at a present rate of 12x times annually.” Saga Partners Q1’22 letter
Each of these disruptions were met with investor pessimism on several occasions until they reached a certain scale. The pessimism is usually related to weather the insurgent has enough capital runway to build out the infrastructure required to scale, and skepticisms around its eventual profitability given the current upfront losses. This is justified because surely, way more disruptors didn’t reach scale, and looking only at the winners creates a hindsight bias. Carvana’s model follows a similar pattern. Their national reach and technology allow them to offer better selection, charge lower prices and operate more efficiently than the incumbent auto dealers. The key questions are whether they have enough capital runway to build out their infrastructure and reach scale, and whether they can earn sustainable, high free cash flow per share at scale.
Carvana can gain 7% market share by 2032.
The used car industry
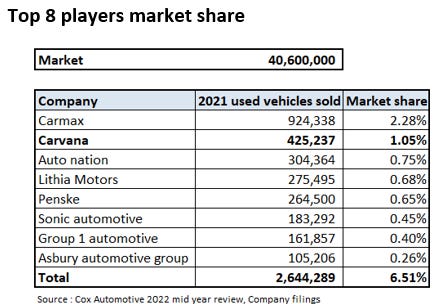
The used-car industry is a massive, stable, and highly fragmented industry. According to a report by Cox Automotive, roughly ~40 mm used cars are bought and sold each year in the United States. The top 8 players cumulatively only have ~6.5% market share and the top 100 players have ~10% market share. There are roughly 43000 used car dealerships and 18000 franchise dealerships.
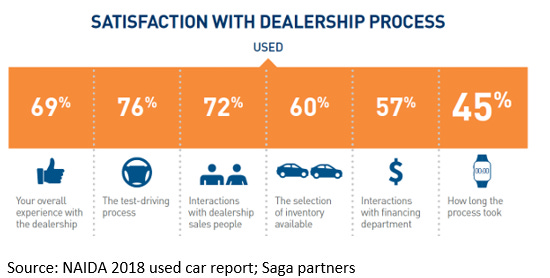
According to a study by Gallop poll, roughly 9% of consumers rated car salespeople as highly trustworthy. Most customers dislike how long the process takes and how cumbersome the financing process is. It takes roughly 40 minutes of idle time to complete the financing/paperwork process at a typical dealership. (It takes 10 minutes total on Carvana!) On the other hand, 86% of purchases involve online research, 61% would consider buying a car online sight unseen and 52% only test drive one vehicle.
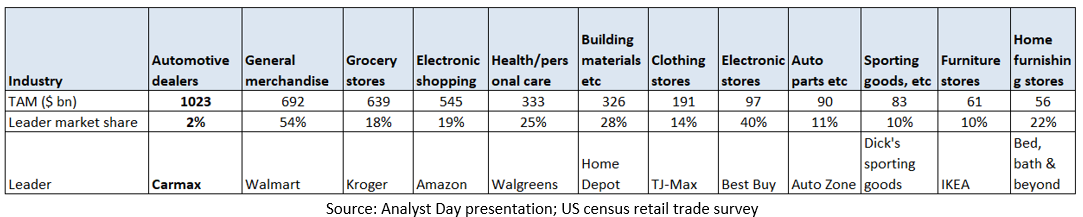
This sector is ripe for disruption. The table below illustrates that Automotive retail is the largest consumer vertical in the United States, at ~$1 tn in sales (~$880 bn in used auto sales), and the largest player is much smaller than industry leaders in other retail sectors. On average other retail sectors have an industry leader with ~23% market share, whereas the leader in this sector, Carmax, has ~2% market share!
Carvana’s value proposition & supply chain
Carvana makes the car buying experience significantly better on every important retail metric of price, selection, service, and convenience. Using Carvana, customers save ~$1500 on average, they have a selection of ~75000 cars versus 250-300 cars at the local dealership, customers can complete the entire transaction online including financing and trade-ins within 10 minutes versus ~40 minutes of idle time at typical dealerships and have it delivered as soon as the next day. They deal with non-commissioned customer advocates and are offered a no-questions-asked 7-day return policy. The only thing Carvana doesn’t offer is a test-drive, but for the 52% of customers who test drive only one vehicle, the 7-day return policy is in essence a better solution.
To provide this superior experience, Carvana is centralized and vertically integrated. It operates several inspection & reconditioning centers (IRC’s), and market hubs all connected through its transportation network. Used vehicles are acquired from customers (trade-ins), wholesale auctions and rental companies using their proprietary, data-driven vehicle acquisition algorithm. Vehicles are then sent to the IRCs in their multi-car haulers for a 150-point inspection similar to luxury certified pre-owned programs. Then the vehicle is sent for 360-degree imaging in their photography booths, before being made available for sale on the website. Once a car is sold, it is transported in multi-car haulers to a local market hub within 75 miles of the customer, then delivered to a customer in a Carvana branded single car hauler. Carvana also operates several ‘car vending machines’ where inventory is parked for in-person pick-ups. Finally, Carvana operates a high-quality finance platform which offers its customers seamless financing, and third-party vehicle service contracts and Guaranteed asset protection insurance (VSC/GAP) through its checkout flow.
Here's an excerpt from Clayton Christensen’s book which puts Carvana’s strategy into context:
“Creating the right experiences, and then integrating around them to solve a job, is critical for competitive advantage. That’s because while competitors may attempt to copy products, it’s difficult for them to copy experiences that are well integrated into your company’s processes” Clayton Christensen (Competing against luck 2018).
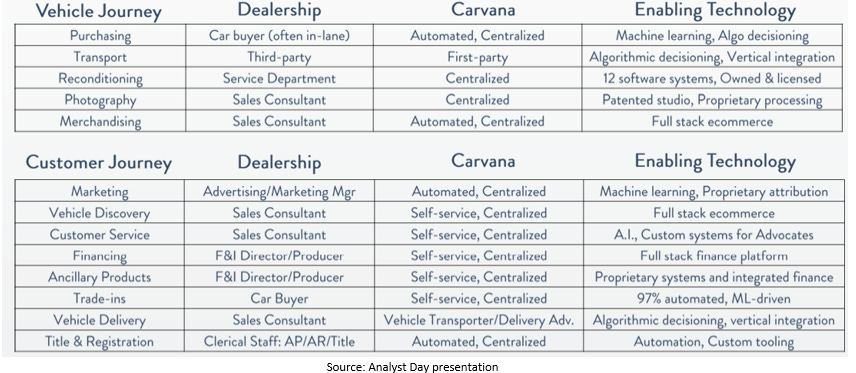
Carvana versus typical dealership
Historical performance
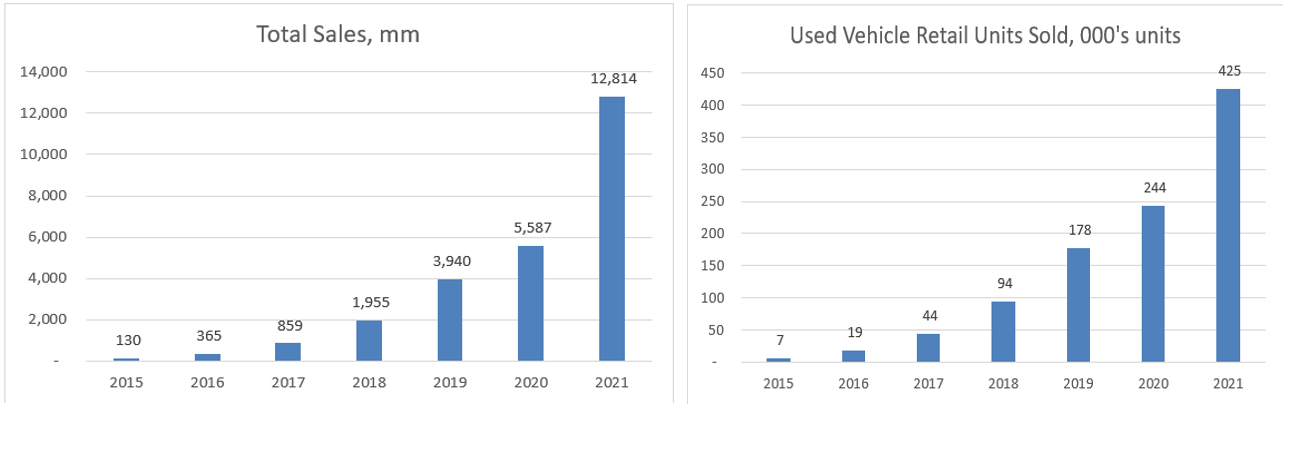
Carvana’s historical performance is a raving testament to its superior model. It has grown its revenue at 115% p.a. over the last 6 years and has a net promoter score of 84 according to a Bazaar voice survey conducted through June 2022.
Carvana has repeatable market expansion playbook. Opening a new market simply involves connecting it with the existing inventory pool through a logistics network, launching its team of customer advocates and its marketing program. Through its existing 315 markets, Carvana now covers ~81% of the US population. The graph on the right below shows that the recent acquisition of ADESA will eventually enable it to be within 200 miles of 94% of the US population, up from the current 56%. This should unlock same day and next-day deliveries for many more customers, which should have a meaningful impact on future growth.

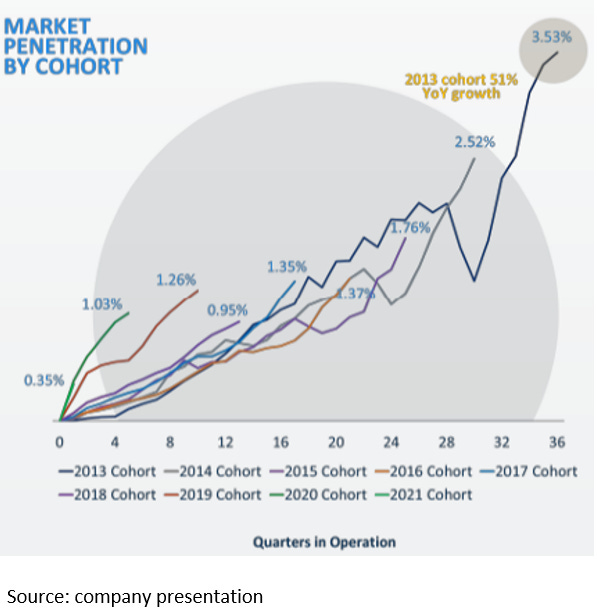
While expanding its market reach and population coverage will certainly contribute to growth, it is not as though the older markets show any signs of slowing down penetration. Each new market cohort increases its market share roughly at a faster rate than the previous cohort, and the oldest market cohort grew ~51% per annum as of 2021 at a 3.53% market share!
Future estimates
While Carvana has exceeded investor expectations on the growth front until 2021, due to a series of external and internal events related to inflation, supply chain and interest rates (detailed in the current issues section), Carvana’s growth has slowed over the past 2 quarters. Yet, when the auto industry was declining in volumes by ~15% including Carmax, Carvana grew by ~15%. Inflation in the auto market began prior to inflation in the other sectors and is already beginning to normalize. Carvana’s supply chain issues which were largely due to Omnicron are also beginning to normalize. Yet I assume no growth in units until the end of this year in the base case, de-growth of 10% in the bear case and growth of 15% in the bull case.
One could also argue that covid-19 caused abnormal growth rates in the last 2 years, yet the market cohort analysis doesn’t support that. According to an analysis by CAS investment partners, Carvana grew more in market cohorts such as Atlanta, Phoenix and Columbus which didn’t have stringent covid norms and less in markets such as New York and San Francisco with more stringent covid norms. While demand has never been a constraint for Carvana, growth will likely slowdown in the future as management focuses on operational efficiency. Management plans to spend ~160 mm per year in growth capex (from internal accruals) to build capacity for 3.2 mm units in 6 years which implies a ~35% growth rate assuming 90% capacity utilization.
Based on the above analysis, I expect Carvana to grow retail units at 20% in the base case, 25% in the bull case and 15% in the bear case until 2032. This implies a market share of 7%, 12% and 4% respectively. I expect prices to fall and normalize to ~$23000 in retail and ~$8000 in wholesale reflecting normal inflation from the 2019 levels.

Carvana can earn ~3% in free cash flow per share margins by 2032.
Two key metrics determine Carvana’s core free cash flow per share at scale-
1. Gross profit per retail unit
2. SG&A per retail unit ex D&A
The number of retail units sold is the key driver of Carvana’s Revenue and profitability because higher retail units lead to higher wholesale units and finance & ancillary revenue. Therefore, total gross profit per retail unit and total SG&A per retail unit are key metrics to track.
1. Gross profit per retail unit (GPU)
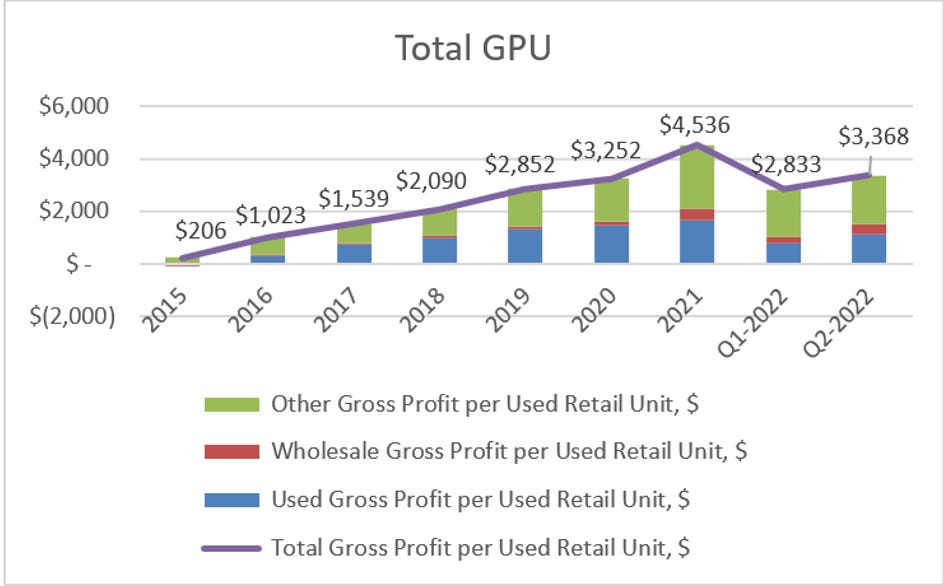
Carvana’s Gross profit per retail unit can be divided into Retail, Wholesale, and Other GPU
a) Retail GPU
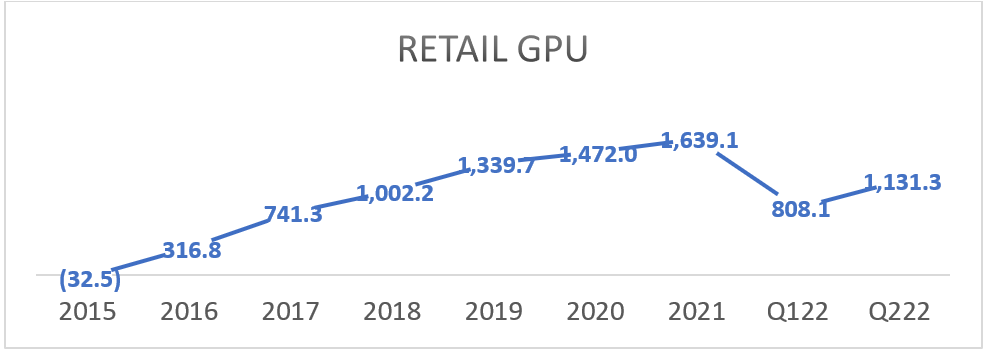
Carvana’s retail GPU is the spread between the average selling price of used vehicles and the average acquisition, in-bound transportation, and reconditioning costs of the vehicle. Historically, the retail GPU grew rapidly as Carvana scaled due to several key drivers:
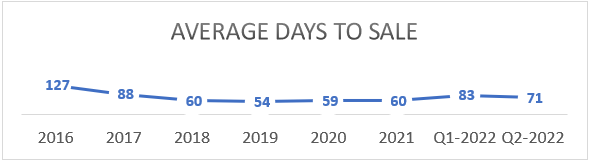
- Higher selling price: As average days to sale reduced, the average selling price of vehicles increased because vehicles depreciate by ~$10 per day. Since 2018 up to 2021, the average days to sale were around ~60. It went up in 2022 due to supply chain and logistical issues outlined earlier and I expect it to reach ~60 days in the mid-term. At $10 per day, that would increase retail GPU by $110. Beyond that, I expect the average days to sale to fall another 15 days to be closer in line with the best in the industry, increasing Retail GPU by another ~$150.
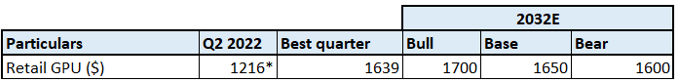
- Lower acquisition cost: Carvana acquires used vehicles directly from customers, third-party auctions, and other direct retailers. Vehicles sourced from customers are ~$200-500 cheaper than vehicles sourced from others as they don’t include middlemen fees and competitive bidding. The percentage of vehicles acquired by customers reached a peak of >65% in 2021 (A combination of higher car prices and Covid-19 led people to sell their cars online) which offset some of the negative effects of Covid-19 and led to a record retail GPU of $1639 in 2021. In the latest quarter pre-covid, the customer-sourced ratio was 41%, and retail GPU was $1581. We can anchor on this as a starting point. Given their seamless user experience for selling cars online in minutes and at better prices, I see no reason why this ratio shouldn’t be higher than 41%, especially since Carmax reports a ratio of ~38%-52%.
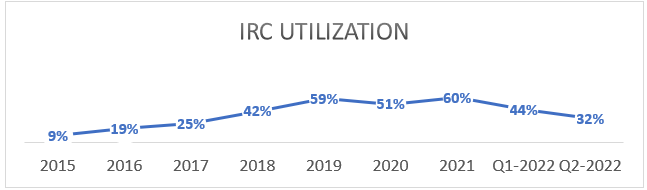
- Better utilization: The inspection and reconditioning costs are largely fixed and will decline in per unit terms as management increases capacity utilization. In-bound transportation costs are also likely to improve with scale as their multi-car haulers load more vehicles per trip. While this is hard to quantify independently, management guided for a $100-200 long term improvement through cost of sale efficiency back in 2018 when utilization was at 42% compared to 32% in the most recent quarter.
For my base case, I assume Carvana will earn $1650 in Retail GPU in 2032. $250 through improvement in days to sale, $200 through improvement in utilization, assuming no benefit from changes in the customer-sourced ratio. In my bull case I assume Carvana can achieve a retail GPU of ~$1700 as it scales, assuming $50 of higher scale or acquisition efficiencies. In my bear case, I assume that Carvana earns $1600 in retail GPU, this could happen if the customer-sourced ratio trends even lower than ~41%.
a) Wholesale GPU
When a used car purchased from customers doesn’t meet Carvana’s retail standards, it sells those cars in the wholesale market through third-party auctions. Therefore, a key driver of the wholesale units sold is the number of retail units sold and % of cars acquired from customers. Over the last few years as Carvana has ramped up its customer sourcing, the ratio of wholesale units to retail units sold has reached ~0.45. Industry leaders have a ratio of 55-65% so there is room for improvement given Carvana’s seamless user experience, instant appraisals, easy pick-ups, and competitive bids.
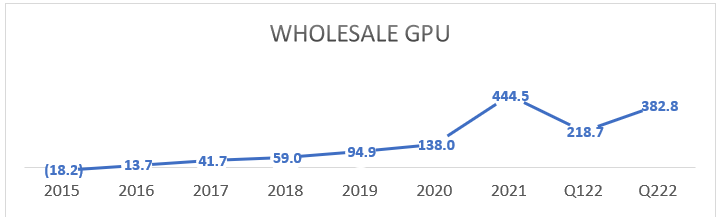
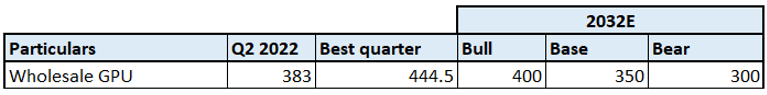
Carvana earned record wholesale GPU in 2021 partly due to an unsustainable increase in wholesale car prices reaching ~$11-12k in 2022, I expect prices to normalize and fall to ~$8000 over the years. Interestingly, every other major public auto dealer that uses third party auctions on average doesn’t make a profit margin on wholesale units sold. Due to Carvana’s superior data-driven purchasing technology, it can purchase and manage inventory better which enables it to earn a high-single digit margin on wholesale units sold. Carmax and AutoNation both have a first-party wholesale auction business which earns 15-20% in gross margins.
The major players in the wholesale auction business are ADESA, Manheim, and ACV. Carvana recently acquired ADESA, and it will be interesting to see how this will change industry dynamics. Though Carvana may gain an edge over competition as it can now gain early access to ~1mm units in inventory before it is auctioned. It will be able to leverage years of ADESA’s wholesale data to make their own purchase decisions at auctions. However, OEM’s and auto dealers (especially Carmax) may pull their volumes from ADESA following the acquisition due to this conflict of interest. However, Carvana’s primary focus in acquiring ADESA was to re-purpose their physical locations into IRC’s to expand their distribution reach as I outline in appendix C.
It is uncertain how the acquisition of ADESA will impact wholesale GPU, although it will likely lead to higher margins. Yet I assume Carvana will generate ~9-10% in wholesale margins in 10 years, wholesale prices will normalise to ~$8000, and wholesale units will account for roughly 40%-50% of retail units, this leads to a base case of ~$350, a bull case of ~$400 and a bear case of ~$300.
a) Other GPU
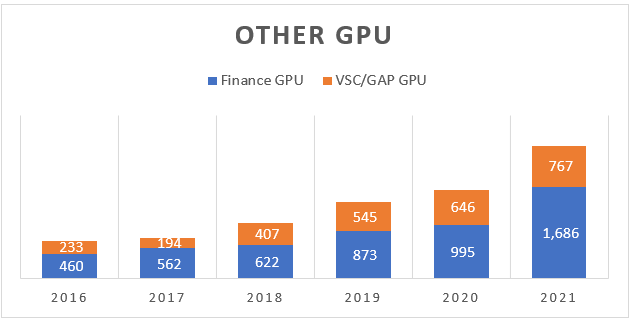
Perhaps a more appropriate way to describe Carvana is it is an auto lender that also sells used cars! Over 50% of gross profits come from the other segment, and ~30% come from Carvana’s finance platform which underwrites and originates loans to customers and later sells them to fixed income investors at a premium. Carvana also earns a commission on selling vehicle service contracts (VSC) and guaranteed asset protection (GAP) insurance through its platform.
Finance GPU
The auto loan market is the third largest consumer credit market in the United States with an outstanding debt balance of $1.4 trillion as of 2021.[1] Carvana’s vertically integrated model is a significant improvement from traditional auto finance as it eliminates middlemen, dealer fraud and reduces overhead by automating the underwriting & servicing process. A detailed analysis of Carvana’s loan performance versus peers is outlined in exhibit B. Bottom line is Carvana’s loans perform meaningfully better than peers including Carmax, Exeter & Credit acceptance across prime and non-prime.
Carvana provides financing to its customers by originating and underwriting loans in-house, it then sells those loans to fixed income investors at a premium (financial institutions, securitization markets). Carvana’s finance GPU is largely the spread between the gain made on selling the loans and the cost of funds required to finance them.
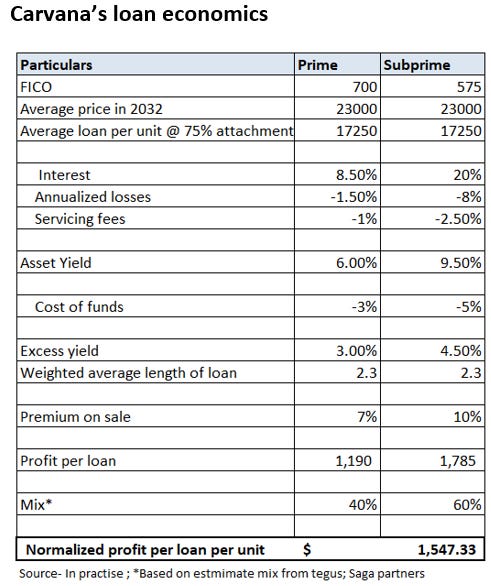
The table below shows a bottom-up analysis of Carvana’s loan economics, where I calculate normalized profit per loan to be $1550 or~ 9% of loan value. The premium on sale of 7% and 10% for prime and subprime respectively were calculated from an expert call on In practise and is roughly consistent with the view of other investors including Cliff Sosin. Although I expect they have room to improve the cost of funds further as their credit history increases. As of June 2022, the cost of funds for the prime segment was ~2.58% versus the 3% assumed below. Each 1% improvement in cost of funds leads to ~$210-310/unit improvement in GPU.
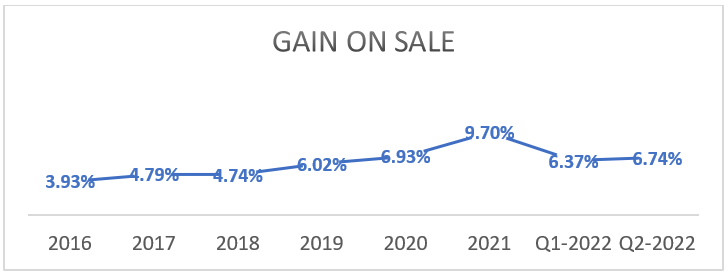
“While Carvana’s gain on loan sales will be impacted by step function changes in interest rates or funding costs, my sense is that Carvana should continue to earn a roughly 9% gain on sale margin over time, roughly in line with its 2021 result and that this premium might even slightly improve as the program continues to mature” CAS investment partners Q1-2022 letter.
Over the last 3 years Carvana has financed ~75% of their units sold. I assume 75-80% is the upper limit because Carmax currently finances (in-house or third party) ~80% of their retail units. This would mean for an average selling price of $23000, Carvana’s average loan per unit is ~$17250. In 2021, as used car prices rose to a record high, Carvana’s average loan per unit and thus its gain on sale of loan also rose to record highs.

Historically except 2021, this rate has been low for 2 reasons. Firstly, until as recently as 2019, Carvana relied on Drivetime (a related party) and Ally financial to fund most of their loans, so there was limited price discovery. Secondly, due to Carvana’s short history, they had no track record of loan performance established. Since 2019, Carvana has rolled out a significant securitization program where loans are sold to institutional buyers in tranches with different maturity. In 2020, due to uncertainty around the covid-19 pandemic, they sold most of their loans to Ally financial at a bargain rate, leading to a lower gain on sale.
In Q1-2022 and Q2-2022, several factors led to a lower gain on sale. Vehicle affordability issues and a high interest environment led to a lower attachment rate, adverse prime vs non-prime mix and higher benchmark rates during sale compared to origination. Management estimates that reversing these effects over time would contribute $600 to finance GPU. This would imply an average profit per loan of ~9.95%, which is elevated due to high used vehicle prices.
VSC/GAP GPU
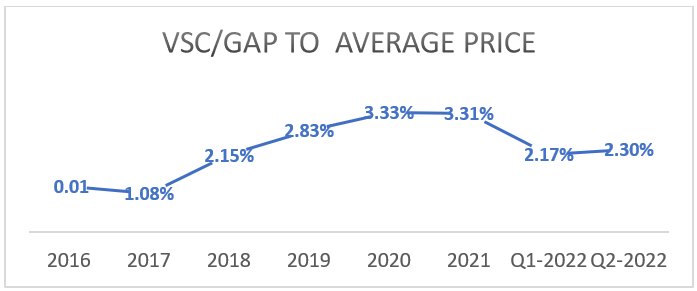
Carvana offers vehicle service contracts (VSC’s) and Guaranteed asset protection insurance (GAP) to its customers. While the attach rates or commission is not publicly available, I assume that these have reached steady state as approximate VSC/GAP GPU as a percentage of average sales price is roughly 2.8-3.3% since 2019. At this rate and with the average selling price of $23000 the VSC/GAP GPU should be ~$650-$750.
Other products
During analyst day in 2018, management guided $100-200+ of additions to long term GPU from the inclusion of other products onto the platform. Carvana recently introduced a partnership with Hertz to establish a marketplace wherein Hertz can directly sell its off-lease vehicles on Carvana’s platform for a fee. This is a win-win situation where Customers gains access to Hertz’s high quality off-lease vehicles, Hertz gains a direct retail channel to sell its cars, and Carvana receives a fee for aggregating the demand on its platform. Carvana will also earn the financing and VSC/GAP revenue on these transactions. While still in its nascent stages, it is easy to see how being a marketplace for used-vehicle inventory owners could be a natural next step for Carvana, because at scale it can be the most efficient distributor of used cars in the auto industry. Carvana has also partnered with Root recently to offer auto insurance through its checkout flow for a fee. Finally, Carvana also has the option to institute additional fees such as a document or dealer fee. According to an analysis by CAS investment partners, Carmax charges between $100-400 per vehicle depending on the state. These additional products are likely to add significantly to other GPU over the years. Due to its nascent stage, currently I assume a $100 addition only in the bull case.
Based on the discussion above, I estimate other GPU should be $2200 in the base case ($1500 from finance GPU and $700 from VSC/GAP), $2400 in the bull case ($1550 from finance GPU, $750 from VSC/GAP and $100 from other products), and $2100 in the bear case ($1450 from finance GPU and $650 from VSC/GAP).
As the table below summarizes I expect Carvana to have a total GPU between $4000-$4500 by 2032:

1. SG&A per retail unit ex D&A
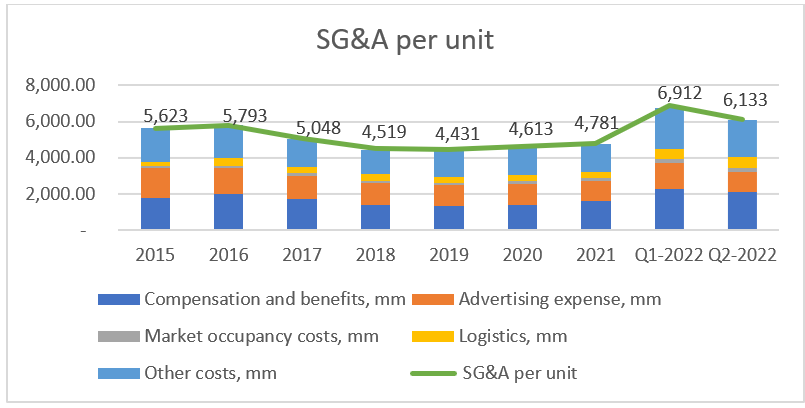
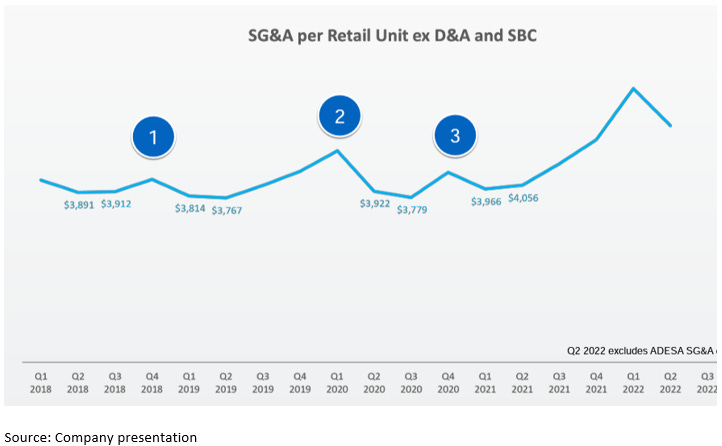
Historically, SG&A per unit has been really high as management focused on growth, and this area is likely the biggest threat to Carvana’s longevity but also its biggest opportunity. Carvana has reported SG&A per unit ex D&A and SBC <$4000 for several quarters, although the priority had always been to ramp up capacity well ahead of demand, which led to higher SG&A per unit on average. This strategy also led to the abnormally high SG&A per unit during Q1-2022 and Q2-2022, as management ramped up capacity expecting a rise in demand, which did not materialize due to the several micro and macro issues detailed later. Now, with the management focused on operational efficiency, this is the biggest lever they can utilize to earn positive free cash flow, although as I show later, they don’t need to depend on this efficiency to survive through their current issues, and you don’t need to believe they can lever SG&A significantly for the investment to return ~34% over 10 years.
Carvana’s SG&A per unit includes the following components:
a. Compensation and benefits
b. Advertising expenses
c. Market occupancy & logistics
d. Other
A. Compensation and benefits:
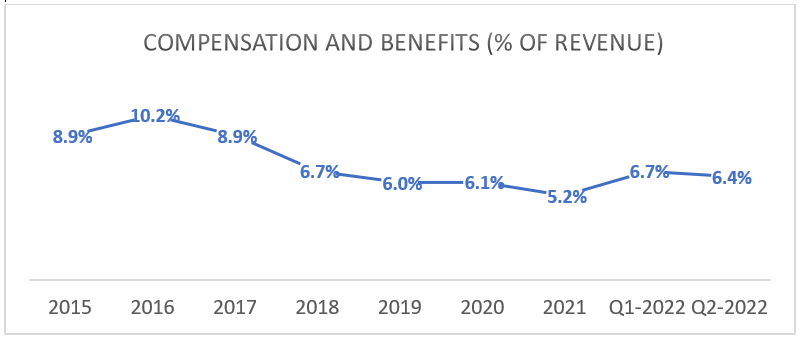
Historically, management has been able to bring down compensation and benefits expense from ~10% of revenue to ~5-6% of revenue which is roughly in line with other auto dealerships. While this may seem like a natural steady-state, management has guided for a
long-term target of 2.25%-2.75% of revenue. How can it get there? Carvana’s advantage over traditional auto dealers should be obvious, their national scale, centralized operations, use of technology and automation should enable them to improve efficiencies in personnel cost. They have several levers to pull to further reduce cost from current levels which mainly include better matching staffing to volume, internal benchmarking to improve efficiency
(hey tom, employees usually do 3 deliveries per day when its within 100 miles, could you try and match that?), customer service automation and achieving scale & density benefits (reducing distance travelled to increase deliveries per day).
While this sounds promising, it is still unsatisfactory to rely solely on management guidance. Luckily, it is possible to arrive at similar estimates from a bottom-up analysis using some details from Cliff Sosin’s Q1-2022 letter and a Tegus call of a former Sr. product director.
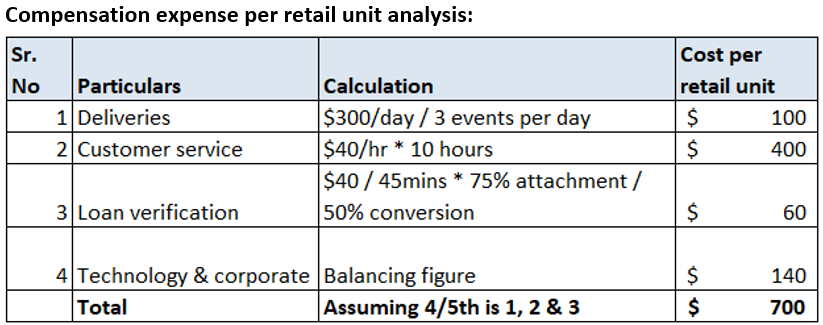
Customer advocates cost ~$230 per day ($60k per year) and can pick-up and drop-off vehicles roughly 3 times per day, which leads to a ~$75 per unit cost. Assuming normal inflation over the next 10 years, this cost would likely increase to $100 per unit. Each unit sold requires ~10 hours of customer service calls and customer service employees’ cost ~$30 per hour. Again, assuming normal inflation this cost is likely to be ~$40 per hour, and at 10 hours per unit sold, the cost of customer service is ~$400 per unit. Each unit sold requires roughly 30 minutes to an hour of verification time by the financing department, which has a average cost of $30 or after inflation ~$40 in 10 years, and at the financing stage ~50% still opt out, leaving a per unit cost of ~$80. This leads to a total customer service and fulfilment cost of ~$580. According to management around 4/5th of compensation and benefits will be fulfilment and customer service, while 1/5th will be technology and corporate costs, which means the total compensation and benefits expense per retail unit is ~$700, which is within the management guidance of 2.25-2.75% of sales. The lower end is probably due to further scale and density benefits, and customer service automation benefits.
While this is more promising, it is still based on a variety of estimates and assumptions. We only need to believe $900 compensation expense per retail unit (3% of sales) in the bull case, $1050 in the base case (3.5% of sales), and $1100 in the bear case (4% of sales) The expense should range between $650 to $800 per retail unit based on direct management guidance.
B. Advertising
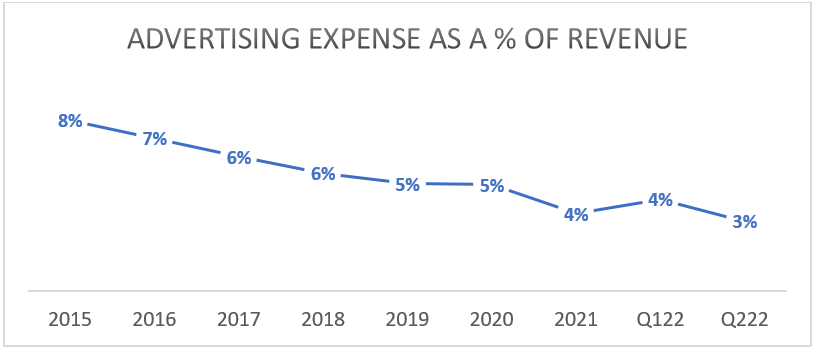
Management has successfully brought down advertising spend significantly over the years while continuing to demonstrate solid growth of a staggering >100% P.A. until 2021. Management has guided that long-term, advertising expense as a % of revenue should range between 1-1.5%, which is roughly in line with typical dealerships.
More importantly, in the last reported cohort data, management shared that between 2016-2019 the annual advertising spend per retail unit in Atlanta (their oldest market) was ~$500-600. During this period, Carvana roughly doubled their market share from 0.92% to 2%, and between 2019 and Q2-2022, the ad spend was roughly $519 and they continued to gain share from 2% to 3.53%.
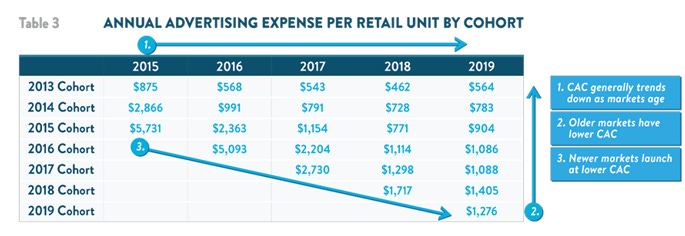
Newer markets usually have a higher penetration and lower CAC compared to older markets at that stage. Management has several levers to pull to reduce advertising spend further from current levels, including improving selection, faster delivery times, adding co-applicants, etc. all of which have a clear impact on the conversion rate. This suggests that the management guided advertising spend at 1-1.5% of revenue, or $300-400 per retail unit sold is achievable. While this is likely true, we only need to assume management will reach $550 per retail unit in the bull case, $600 in the base case and $700 in the bear case.
C. Logistics and market occupancy
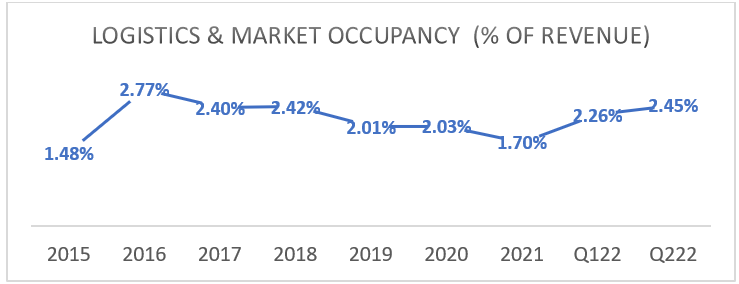
As you can see, logistics and market occupancy expenses have historically been roughly 2% of sales. Long term, management has guided that this expense should be 1-1.5% of sales. Why has this cost not reduced over the years as they have scaled? Simply because historically, they would build capacity well ahead of demand. As they improve their network utilization and as the average distance to IRC reduces over time, I see no reason why this expense shouldn’t be 1-1.5% of revenue, in line with management guidance.
Especially since with the acquisition of ADESA, they are now within 200 miles of 94% of the US population, up from 54% pre-ADESA acquisition. According to in practise, investor relations states that it costs Carvana roughly ~30c per outbound mile compared to ~$1 for retailers that outsource to third parties. Carvana incurs ~$350 in logistics cost per retail unit, and now if it ships only within 200 miles, there could be ~$200 in cost savings.
Accordingly, In the base case I expect logistics and market occupancy expense per retail unit sold will be $350 (Based on 1.25% of estimated total revenue), in the bull case I expect it will be $300 (Based on 1% of estimated total revenue), and in the bear case I assume the expense will be $400 (Based on 1.5% of estimated total revenue)
D. Other costs
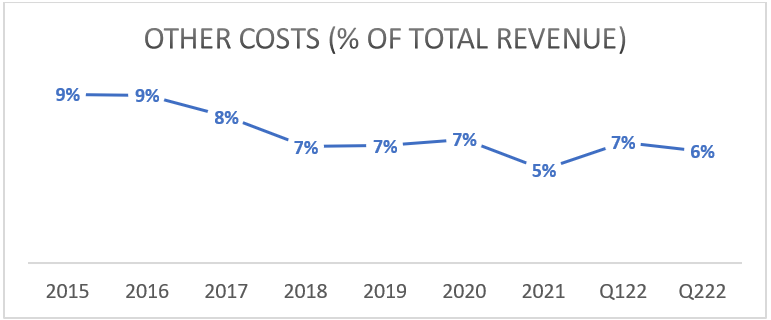
Other costs largely include warranty, title and registration, and technology and corporate expenses including IT expenses, capitalized software spends, professional services, non-market occupancy etc.
In the past Management has successfully brought this expense down from ~9% of revenue to ~5% of revenue in 2021 and has a long-term goal to bring it down to 1.75%-2.25%. This would imply that the other cost per retail unit should be $500-615 in 10 years, which is a significant reduction from the $1573 they reported in 2021 but seems achievable because a large portion of the expense is fixed and should scale over time.
Yet, I estimate that the expense will be $900 per retail unit in bull case or 3% of estimated revenue, $1000 in the base case or ~3.5% of estimated revenue and $1100 in the bear case or ~4% of estimated revenue.
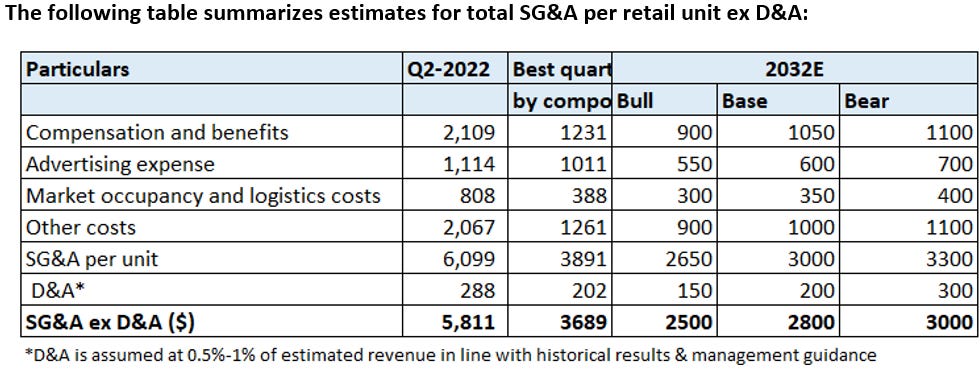
While this is a reverse engineering of what you would need to believe Carvana should expend in SG&A per unit to earn a ~30+% return on investment given the current market price, it is not the true potential of the company. I estimate an SG&A ex D&A of ~9-11% of revenue while direct management guidance is to lever SG&A ex D&A to 6.5-9% of revenue. Given their business model and long-term track record, I see no reason to doubt them.
Carvana’s core free cash flow per share
Based on the above analysis, the following table and accompanying notes calculate Carvana’s core free cash flow per share at scale:

Notes:
- ADESA currently has a run-rate of ~52 mm in EBITDA due to the current auto retail environment, I expect it to continue this run rate for the remainder of the year, and gradually earn the $100 mm in EBITDA it has already earned in the past in the bull and base case, and ~$70 mm in EBITDA in the bear case.
- Carvana has $600 mm in annual fixed interest expense on its total debt obligations. The model conservatively assumes that Carvana cannot reduce its interest expenses over time.
- Carvana pre-funded a large part of its capex when it acquired ADESA and plans to spend only ~$200 mm in capex from 2023 until 2028 to build out the ADESA locations, post that I expect capex to increase to ~$500 mm as management resumes building greenfield IRC’s and $300mm in the bear case assuming management reduces growth capex. Management funds working capital with asset backed debt and has guided for YOY changes in working capital to remain roughly nil.
- Taxes are assumed to be 25% which is roughly Carmax’s tax rate.
- Fully diluted shares outstanding are 191.6 mm adjusted for converted LLC units and Class B shares. While I estimate Carvana doesn’t need to raise further debt or equity, management may decide to raise equity to be extra cautious. To account for this in the base case I anticipate ~5% dilution and in the bear case I anticipate 10% dilution.
Beyond 2032, Carvana can sustainably earn high free cash flow per share for a long period of time.
Carvana’s vertically integrated model creates enormous barriers to entry that will allow it to earn high levels of free cash flow for a long period of time. Carvana has the highest selection of inventory with 75000 available units on its website. The next biggest online dealer has a fraction of this inventory, and the typical dealership has ~200-300 cars in the lot. This higher selection creates powerful network effects wherein more selection leads to more sales which lead to even higher selection. Similarly, Carvana has the highest number of IRCs to enable fast delivery. Again, faster delivery leads to more sales which leads to more IRC investment. Carvana shares this efficiency benefit with the customer and charges ~$1500 less compared to the Kelly blue book value of the vehicle. This again creates a self-reinforcing flywheel wherein lower prices lead to more sales which lead to even lower prices!
For a new competitor to come in and compete with Carvana, they would have to build out 75000 units in inventory, each vehicle depreciates ~$10 per day in value and costs ~$3 per day to finance. So a competitor would have to incur roughly $1 bn in fixed cost to match Carvana’s inventory. Beyond this, they also need to build inspection and reconditioning centers across the country, invest in information and technology systems, and build the logistics network, otherwise they would remain at a cost disadvantage. All of these would require significant fixed investment. Even after this level of investment, it wouldn’t be clear whether they could ever succeed as Carvana would continue its investment cycle to further strengthen its value proposition and competitive advantage.
Put simply, now that Carvana has already reached a certain scale, it is almost impossible for a new competitor to incur the same level of fixed cost and expect any reasonable return on their investment.

Beyond scale advantages, Carvana also enjoys significant data advantages. Carvana relies on its unique data sources including the click stream history on its website, its sales history, customer profile & credit information etc. to determine its acquisition price in wholesale markets, trade-in price from customers, and optimize its selling price on the website. It is also able to price its loans better than competitors as demonstrated by ~5 years of superior credit performance compared to Carmax, Exeter and Credit acceptance across the prime and non-prime segments. As Carvana scales, each of these data sources will only become stronger predictors of price and performance and thus increase Carvana’s relative advantage.
Carvana’s current issues will not hinder it from building out its infrastructure to reach scale.
While Carvana has exceeded investor expectations on its key deliverables throughout its history up until 2021, it has gone through a series of internal and external issues over the last two quarters. Since Carvana historically built capacity 6-12 months ahead of demand to support its growth, it was not prepared for these issues. This raised investor concern and caused a significant drop in its share price. Recently, Wedbush securities slashed Carvana’s price target to $15 questioning its ability to survive. While the concerns are understandable, in my opinion they are highly overblown.
Carvana currently faces three key challenges:
1. Logistical issues related to Omnicron and weather disruptions
The Omnicron wave coupled with several weather events caused a severe strain on Carvana’s logistics network. Supply chain bottlenecks decreased inventory availability and increased average delivery times. Based on a systematic analysis done by CAS investment partners as of April 2022, Carvana was only showing a fraction of its total available inventory of ~90000 units, and average delivery times were extended by 2-3 days. Both these metrics are widely known to have a material impact on customer conversion rates.
Mitigant- The most probable scenario is that these issues, which were largely due to Omnicron, will normalize over the coming quarters. This normalization will improve customer conversion rates and thus improve sales growth. Yet as I calculate below, Carvana doesn’t need to depend on a significant improvement in sales growth to survive. I expect its unit growth to fall -25% for the next 2 quarters before growing at ~15% over the next 10 years in a bear case scenario.
2. Used car affordability issues related to inflation, & interest rates
According to a study by Cox automotive[1], the auto retail sector declined between 15-20% during the first quarter. Even Carmax- the industry leader had its same store sales (SSS) decline 12.7% and 8.3% during the two quarters. For context, Carmax reported a 16% decline in SSS during the great depression! Carvana on the other hand, grew retail units sold by 13.8% and 9% during this period. However, since Carvana had built capacity for much higher growth, their overall losses expanded. The main reason for the decline was due to lack of affordability. Carvana reported that on average inventory available on its website had increased in price by ~30% since January 2021. The impact was more pronounced on lower priced cars with cars <$15k up ~40%! This, coupled with a higher interest rate environment which made it difficult to borrow, led to the industry wide fall in demand.
Mitigant – According to the Manheim used vehicle value index[2], used car prices are already starting to fall. I receive an email from Carvana frequently with the subject: “Good news! A vehicle you viewed has dropped in price”. This will likely have a positive impact on customer conversion rates. However, car prices and interest rates are still high, which will likely lead to a slowdown in the sector for a few quarters, and I account for this in the bear case with -25% fall in retail units and in the base case with ~20% drop in retail units.

Will lower prices impact GPU? Maybe for the next quarter as the higher-priced wholesale inventory has a lower retail price. However, meaningfully offsetting that would be the reduction in high reconditioning costs and passing on finance cost of fund increases. Moreover, it wouldn’t affect GPU beyond a few quarters as wholesale prices also fall in line with retail prices.
1. ADESA integration and debt concerns
In February, Carvana announced a $2.2 bn acquisition of ADESA and a $1 bn plan to re-purpose ADESA facilities into reconditioning centers. As I explain in appendix C, the ADESA acquisition has a strong strategic rationale as it increases their reach and capacity significantly, it is still unfortunate that it came about during a rough period for the company. To fund this purchase, Carvana ended up raising $3.25 bn in debt at a higher-than-expected interest rate of 10.25% and raised $1.25 bn in equity at $80, which diluted shares outstanding by 9%.
Mitigant: In my calculation below I don’t assume any ADESA synergy benefits, and I only assume that ADESA will continue to earn ~$50 mm in EBITDA per year which is the current run-rate, even though management states it should return to its historical ~$100 mm as the market normalizes.
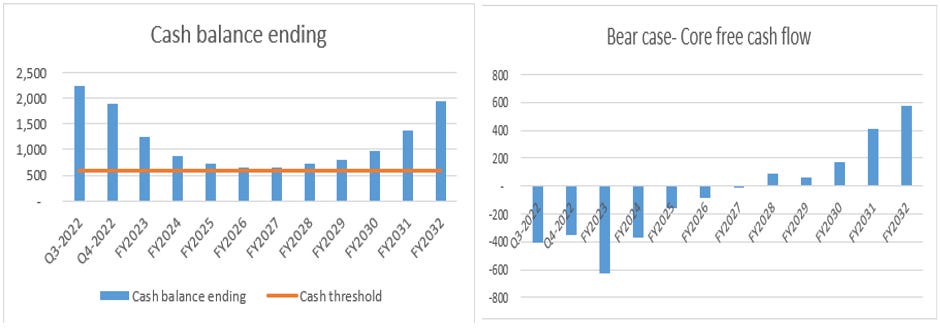
More importantly, Carvana’s debt concerns are largely overblown because in a stressed scenario, even if it reaches an EBITDA level it has already demonstrated in the past at much lower scale, by FY 2024, The $2.650bn of cash & revolving facilities on its balance sheet, even after accounting for $580 mm in restricted cash, is enough for Carvana to pay its liabilities and build out its infrastructure without depending on capital markets.
An EBITDA level Carvana has already demonstrated:
Firstly, Carvana earned a GPU of $4500 in 2021, and as calculated in the GPU section of this write-up, it should conservatively be able to earn at least $4000 in sustainable GPU. In my bear case analysis, I assume GPU will be $3500 by the end of this year and remain at ~$4000 from 2023. Even though management has guided to return to >$4000 in GPU by the end of this year.
Secondly, Carvana has demonstrated through its oldest cohort that its true advertising expense, ex brand-building is ~$500. Between 2016 until 2022, Carvana spent ~$500 per retail unit for advertising in Atlanta and gained market share from ~0.92% to ~3.5%. Finally, During the early stages of the COVID-19 pandemic in May and June of 2020, when management was optimizing for efficiency, SG&A ex advertising ex D&A was $2600. Carvana has demonstrated $3100 in SG&A ex D&A potential when it was operating at a scale of ~250k units. In my stress analysis I expect it to gradually reach $3200 at a scale of ~645k units and by FY 2025.
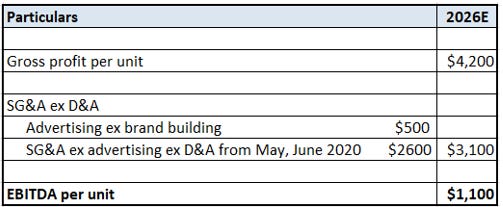
Moreover, as shown in the graph below Carvana has already shown it can lever SG&A ex D&A ex SBC to <$4000 when it better matches supply with demand for several quarters in the past. I expect it to reach $5000 in SG&A ex D&A by year end and then $4000 by FY 2023. Even though the management goal is to reach $4000 by the end of this year.
Bear case analysis
Assumptions-
- Unit growth will fall by 25% over the next two quarters then grow only 15% p.a. over the next 10 years. This is extremely conservative because Carvana grew retail units ~15% during a sector fall of ~15%, while it was dealing with several logistical issues. Carvana is likely to have dealt with their logistical issues which were largely due to Omnicron, and lower prices will eventually lead to growth in units.
- Carvana will earn a GPU of $3500 by the end of this year and $4000 in GPU thereafter. Management guidance is to reach >$4000 by end of this year and improve GPU further beyond that. I assume no further improvement in GPU.
- SG&A ex D&A expense will be $5500 and then $5000 in the next two quarters, $4000 in FY2023, and then gradually reach $3200 by FY 2025. This is conservative because It has reported an SG&A of $4000 for several quarters in the past and has demonstrated it can lever SG&A ex D&A to $3100 per retail unit at much lower scale. Management has a goal to reach $4000 by the end of this year and $3000 by ~FY 2024.
- ADESA will continue to earn ~$50 mm in EBITDA until FY 2025 which is the run-rate from the last quarter. Then earn ~$70 mm in EBITDA from FY 2025. This is highly reasonable as management expects ~$100 mm in EBITDA starting FY 2023 which is a level ADESA has already reached in the past.
What is likely to happen is that Carvana grows >20% p.a and reaches $4200+ in GPU, $3000 per unit in SG&A ex D&A by ~FY2024, and comfortably rides through this storm. Moreover, its relative position versus the competition will only get stronger as the downturn leads to a consolidation in the sector.
But if you just believe the bear case assumptions above, then Carvana’s current $2.65 bn in cash and revolving facility is more than enough to pay the ~$600 mm in fixed interest and $100 mm in maintenance, & priority growth capex to survive through the issues without relying on any further debt/equity issue. It also has ~$2 bn in unpledged assets just in case it requires any further resources. This case also accounts for the $580 mm in restricted cash Carvana is required to maintain for its floor plan facility covenant. The full model is in Appendix E.
Valuation and implied CAGR
Implied CAGR-
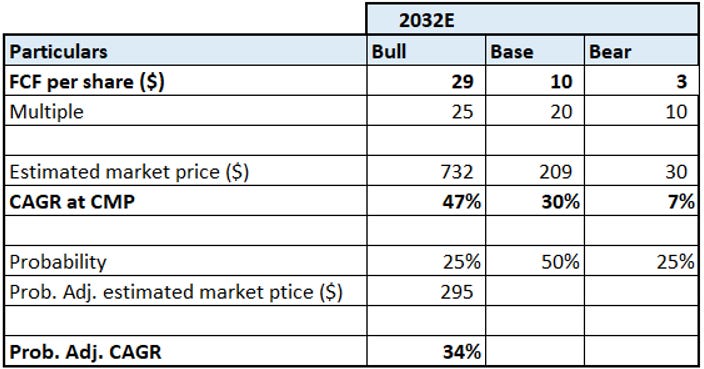
If Carvana can earn ~$10 in free cash flow per share or 3% FCF margins as outlined earlier, then based on a ~20x multiple it should return 30% CAGR over 10 years in the base case, and a probability-adjusted CAGR of 34% accounting for the bull and bear case scenarios.
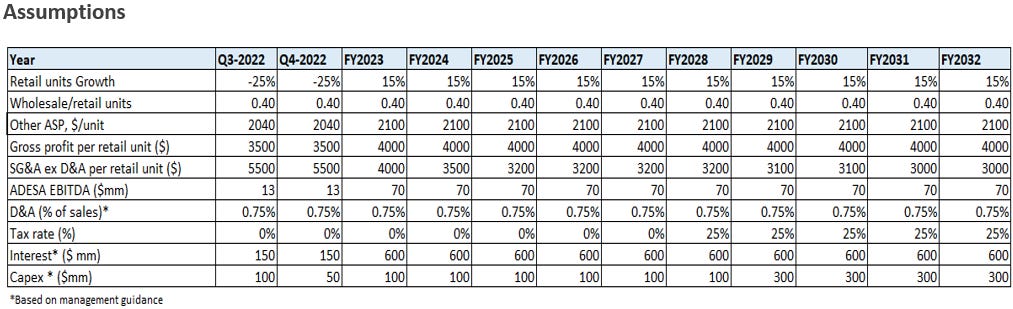
Intrinsic value calculation-Through the following DCF analysis, I estimate intrinsic value per share of $63 in the base case, assuming a discount rate of 10% and terminal multiple of 15x on 2032E FCFF. The bull/bear case model is in appendix D & E respectively.


Appendix
Appendix A: Key risks & mitigants
1. Securitization markets & Ally financial arrangement- Carvana requires a source of funds to continue to offer auto loans to its customers. Currently, Carvana depends on this flow from securitization markets and ~5 other lenders. Reportedly, the arrangement with Ally financial accounts for a large portion of its funds. If securitization markets dry up or the arrangement with Ally financial falls through, then Carvana could lose an important source of its revenue and profits.
Mitigant: While the relationship with Ally financial was highly beneficial to both parties and continues to remain strong, since 2020, Carvana has established relationships with 4 other lenders and rolled out a significant securitization program. As I explain in appendix B, Carvana has demonstrated for ~5 years now that their loans perform better than competitors , for a fundamental reason that their vertical integration eliminates dealer fraud. As Carvana establishes a longer track record, the number of lenders is likely to increase and their dependence on any single lender will fall. Further, the entire auto industry significantly depends on the securitization markets to fund auto loans. If securitization markets would dry up, Carvana’s superior credit performance should ideally be the last to be affected. (PS- Berkshire Hathaway is the second largest shareholder of Ally financial- which is likely a good testament to its financial position)
2. Corporate governance- Carvana has a complicated corporate governance profile. The Garcia family own certain class B shares and LLC units which give them majority control over the voting rights. Carvana has meaningful related party transactions with Drivetime, a company founded, and majority owned by Ernie Garcia II. Ernie Garcia II or old Ernie has a checkered past having pled guilty in 1990 to bank fraud charges and having settled another dispute in 1999 alleging he abused his position to profit from a real estate deal. While old Ernie doesn’t have any management responsibilities in the company, he directly and indirectly owns ~40% of the company. He is in a position which to make decisions which may benefit LLC holders at the expense of Class A shareholders.
Mitigant - While Ernie’s past is certainly something to worry about, given that he has no management control and the lawsuits were a long time ago, I think it deserves a higher discount rate, but not a red flag. While old Ernie has a checkered past, young Ernie, the CEO, comes across extremely rational, thoughtful, and honest in all of his interviews/letters/transcripts. Carvana was fortunate to have been incubated under Drivetime, a large auto dealership which gave Carvana an unfair initial advantage to scale with lower capital requirements. Due to this, Carvana still has certain arrangements and dealings with them. These are largely immaterial at <1% of revenue, other than the arrangement wherein Drivetime purchases VSC/GAP contracts from Carvana in exchange for a fee, which accounts for 1-2% of total revenue but ~20% of other revenue. While this is significant there is no indication that these contracts are done on terms which are not at arm’s length.
3. Regulatory, PR and media concerns – Carvana’s dealership license has been suspended in some states including Michigan and Illinois for not delivering a few vehicles’ title and registration paperwork in a timely manner. The state of Michigan suspended Carvana’s dealer license over ~100 title delays and other violations. Illinois license was suspended in early 2022 due to ~95 customer complaints. Several other states have fined Carvana for similar title and registration delays. If more states continue to suspend Carvana’s dealership license then it could hamper Carvana’s growth and profitability. These regulatory concerns, poor customer experiences coupled with Carvana’s recent decision to lay off a lot of its employees has caused a lot of negative press for the company.
Mitigant- Firstly, Carvana can still sell vehicles in the state of Michigan and Illinois, they just have to be delivered from another state, which creates some strain on the logistics network, but it isn’t a significant cause of concern. Secondly, when a company disrupts an industry like Carvana has and operates at the scale Carvana operates in or when a company’s share price is down due to several unrelated reasons, it is easy for the headlines to demonize the company and gain massive PR and government attention. Amazon is a good precedent. In its history, Amazon has lost 90% of its stock value, made enormous losses, raised debt at ~10%, had several layoffs, and faced similar scorn from investors, media, and government. News outlets including the New York times had scathing criticisms related to its profitability, opposition to trade unions, worker conditions, tax avoidance, anti-competitive practices etc. You can also search ‘Trust pilot amazon reviews’ and read the horror stories of Amazon’s customer experiences. Just like with Amazon, I think Carvana’s issues will have a more balanced and rational view over time and the ‘evil company’ narrative will fade.
4. Autonomous vehicles – Another long tail risk for Carvana would be if advances in ‘transportation as a service’ through autonomous vehicle fleets led to the expectation by 2032 that traditional car ownership will fall. While this may not impact Carvana’s revenues and profitability over the next 10 years, if there are serious advances in the development of autonomous vehicle fleets by 2032, then it could impact the ultimate market that Carvana could go after and affect its valuation.
Mitigant- In an interview with good investing talks available on YouTube, Cliff Sosin had a thoughtful response on why Autonomous vehicle fleets would be an unviable universal solution even if it had certain use cases, I mostly paraphrase his arguments below.
The argument proponents of an autonomous vehicle fleet would make is that such a system would increase utilization of vehicles and reduce the average cost per mile of vehicle travel. However, what they miss is the dead miles such a system would introduce. In a typical city, residential areas are net exporters of people in the morning and net importers in the evening. These net flows put a fundamental limit on percentage of miles that could be occupied. Further, even if a shared vehicle system could be somewhat cost effective, when you add the inconvenience of wait times, not being able to leave your things in a car, cleanliness concerns, having a kids car seat installed, etc. it starts to lose its value proposition. Finally, in countries like India where labor is so cheap that cars are effectively self-driving, you don’t see a shift in behavior from ownership to a shared vehicle fleet.
Appendix B: The finance platform
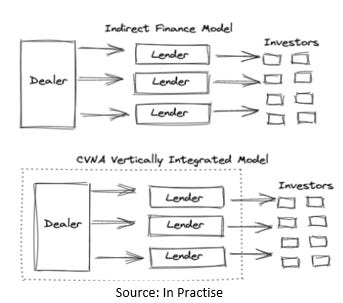
There are three primary players in the Auto finance market:
1. Dealers –Acquire the customer, ensure vehicle quality, collect loan information, and documentation for lenders.
2. Lenders (Banks, credit unions, finance companies) –Underwrite the loan with credit scores, price the loan, service the loan, and arrange for funding from investors
3. Investors (Banks, credit unions, fixed income investors) – Hold loan instruments to earn a risk-adjusted fixed income return
Most dealers work with third party lenders who offer auto loans to the customer. This is known as the indirect model and the key third party lenders are Exeter financial, Credit acceptance, Westlake financial and Santander consumer who originate loans on behalf of dealerships and then sell them at a profit in securitization markets to fixed income investors. Carmax follows a hybrid model, they have their own financing arm which offers auto loans to mostly prime borrowers and they also offer third-party loans to their customers. Carvana, on the other hand, is entirely vertically integrated. It originates and underwrites all the loans in-house, and then sells them to fixed-income investors at a premium.
Vertical integration creates a seamless, hassle-free customer experience and has fundamental competitive advantages including reducing dealer fraud costs, centralization & automation of underwriting in a controlled environment, and long term committed capital versus loan-by-loan underwriting. Moreover, since Carvana’s vehicle quality is better on average and their pricing is lower than average, their monthly payments and loan to value are lower, which leads to better loan performance.
The indirect model can lead to dealer fraud and higher overheads. In the indirect model, dealers receive a fee based on generating leads and marking up the loan to the customer, but they have no interest in the underlying loan performance. This creates distorted incentives. For instance, a dealer may sell the customer a base truck, but offer a loan for a platinum. An indirect lender will never see the car so they will approve the loan, and everything will be fine until the customer defaults and the car is repossessed. By being the dealer and lender, Carvana eliminates this risk completely.
Here’s an analysis done by Saga partners which shows that for each FICO score range, Carvana’s loans have lower cumulative net losses (CNL) than their peer group:

Based on a similar analysis done by In Practise, between 2016-2020, Carvana reported ~3% lower net charge-offs versus Exeter financial for a similar pool of loans. For a given non-prime FICO score, In practise estimates Carvana has ~1% of lower losses compared to other subprime lenders, which the ABS market is likely to pay a premium for.
Appendix C: ADESA acquisition
In February, Carvana announced a $2.2 bn acquisition of ADESA and a $1 bn plan to re-purpose ADESA facilities into reconditioning centers. To fund this purchase, Carvana ended up raising $3.25 bn in debt at a higher-than-expected interest rate of 10.25% and raised $1.25 bn in equity at $80, which diluted shares outstanding by 9%.The deal had been in the making for long time and while the timing of the acquisition in 2022 was unfortunate, I think the strategic rationale for it was strong.
The acquisition has two key benefits for Carvana. Firstly, it will increase capacity, lead to a more efficient logistics & IRC network which will significantly improve Carvana’s delivery times and thus lead to higher conversions, and a denser network will significantly reduce transport and fulfillment costs at scale. Secondly, this acquisition potentially gives Carvana access to ~1mm in vehicle inventory before it is auctioned off in wholesale markets.
Over time as the ADESA locations are re-purposed into IRCs, Carvana will have a total capacity of ~3.2mm units, up from the ~1mm in capacity they had prior to the acquisition. They will be within 100 miles of 78% of the US population, up from 32% today, and within 200 miles of 94% of the US population up from 56% today! This will unlock same day and next day delivery for way more customers and reduce risk of delivery delays. Carvana estimates that the shorter distance will lead to ~$750 in cost savings due to increased conversions, faster inventory turns, lower inbound transport costs, and lower shipping costs to customers.
ADESA attracts ~1mm in inventory per year, roughly half comes from dealer consignment and the other half from commercial institutions such as rental car companies, financial institutions, and captive finance companies.
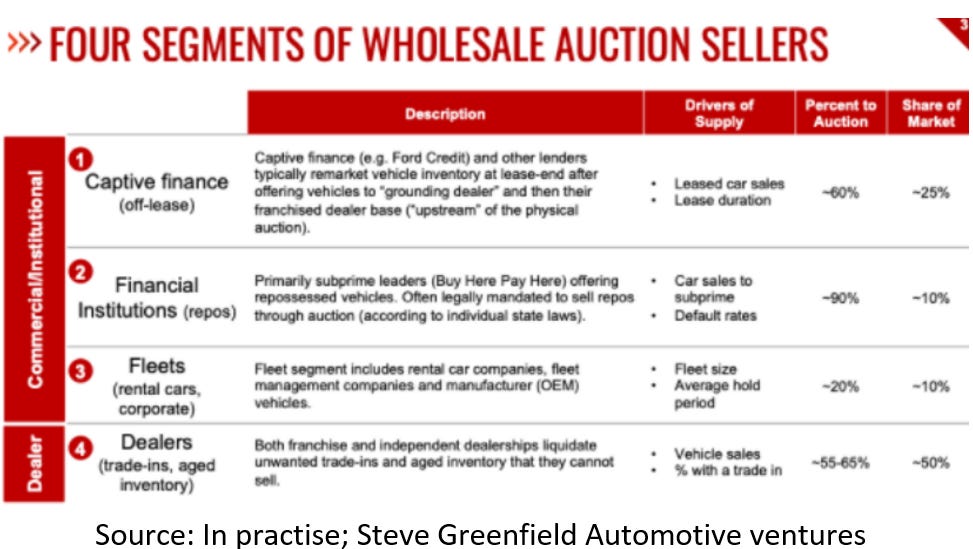
The off lease and fleet inventory is usually higher quality, and with the acquisition, Carvana could potentially leverage ADESA’s wholesale data as well as the early access to wholesale inventory to inform its own buying decisions at ADESA and other auctions and gain a significant advantage in purchasing vehicles. On the other hand, Carmax, one of the large participants in this auction will likely stop their purchases from ADESA and this would lower volume auctioned through ADESA. Other OEMS may not like this conflict of interest either. Either way, Carvana has access to data that it could leverage to make purchasing decisions which will likely improve GPU.
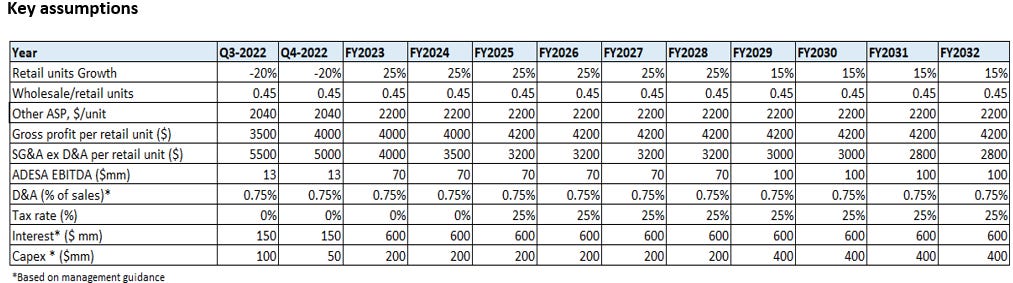
Appendix D: Bull case model
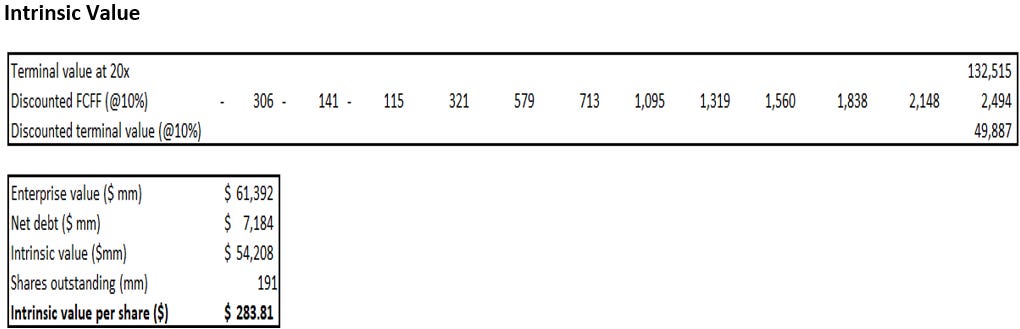
The bull case intrinsic value per share is $284, assuming a terminal multiple of 20x on 2032E FCFF and using a discount rate of 10%.


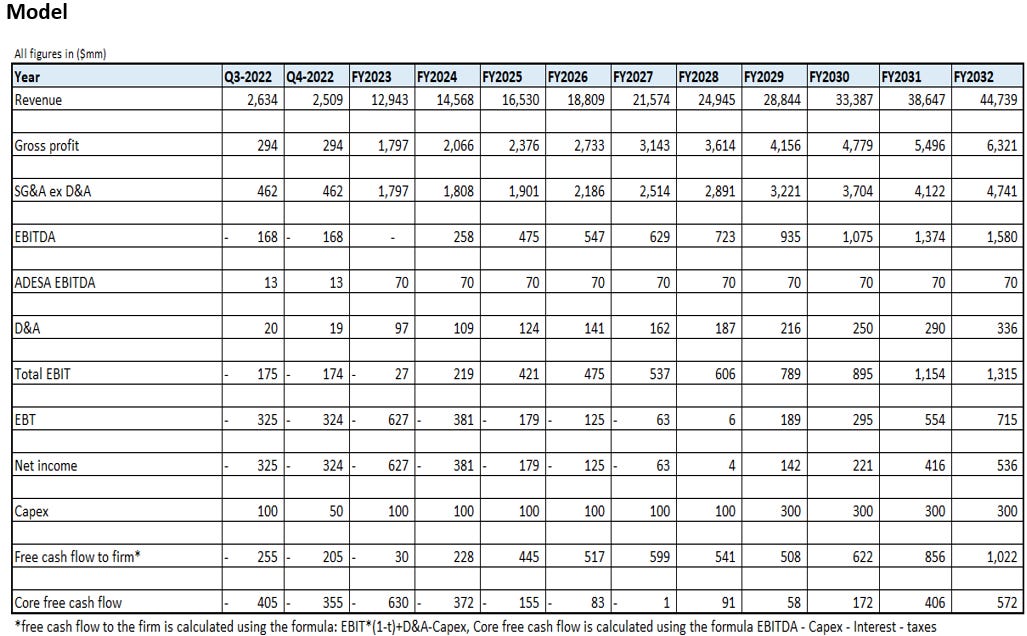
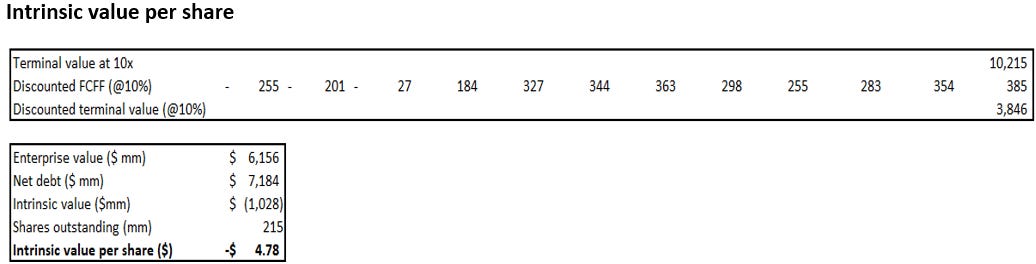
Appendix E: Bear case model
The bear case intrinsic value per share is $(5), assuming a terminal multiple of 10x on 2032E FCFF and using a discount rate of 10%.
[1] https://www.coxautoinc.com/news/cox-automotive-march-forecast-slow-march-auto-sales-to-cap-weakest-q1-in-a-decade/
[2] https://publish.manheim.com/en/services/consulting/used-vehicle-value-index.html
[1] Fed report on household debt and credit- https://www.consumerfinance.gov/about-us/blog/rising-car-prices-means-more-auto-loan-debt/