

Could the US Dollar Weaken in 2024?
Could the US Dollar Weaken in 2024?
Err… Yes But No

Forex markets are posing the biggest puzzle in 2024. The widely predicted strength in the Yen and less convincingly the Chinese Yuan have completely failed to materialize. Meanwhile, the trade-weighted US dollar currency basket, the DXY, has managed to edge higher, despite the collapse in the dollar against gold and Bitcoin.
We suspect two things are going on.
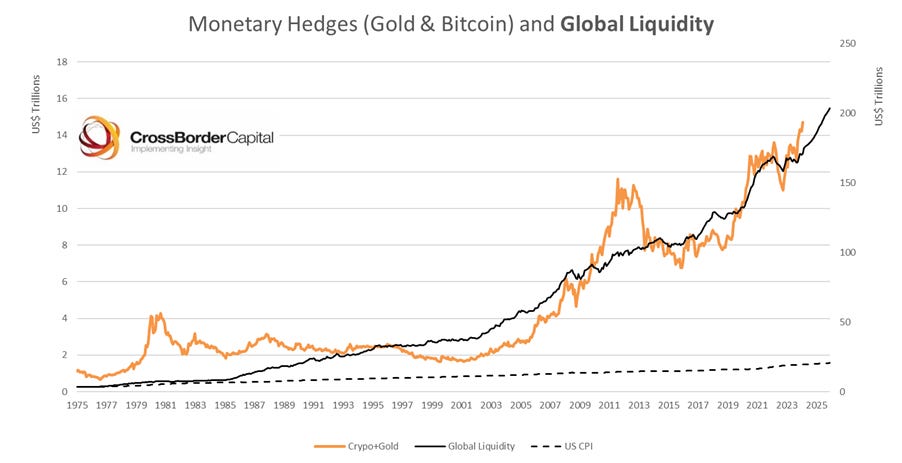
First, monetary inflation fears are generally driving the US dollar and all other paper units lower. Consider, the chart below which highlights the long-term trend in Global Liquidity and the performance of monetary inflation hedges, namely gold and Bitcoin. [Note it emphasizes how these are monetary inflation hedges not high street inflation hedges since they easily outperform US CPI.]
Second, in traditional forex markets, the US dollar is performing slightly better than other paper units because competitor economies are likely pressing to ease monetary conditions sooner. This certainly seems true for Europe, China and several Emerging economies. We have long suspected that Japan is trying to shadow the Chinese Yuan and, where necessary, push it lower.
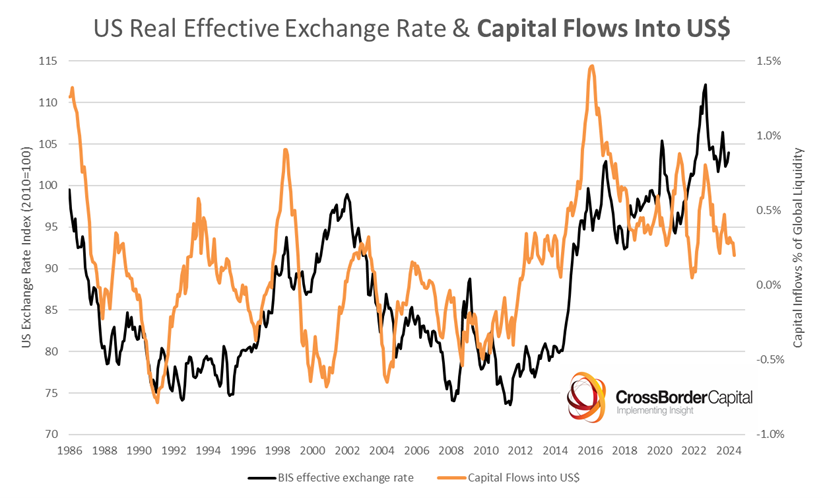
To reinforce this point, US assets continue to attract capital inflows. This has typically resulted in a strong US dollar. However, as the chart below warns the pace of net capital inflows (orange line shown as % Global Liquidity) are starting to gradually slow and potentially reverse. This is consistent with some future softening in the DXY, trade-weighted index.
Two conclusions come from this. Gold and cryptocurrencies should enjoy a further extended bull market, spurred by the realization that fiscal finances across the developed World are fragile and with investors possibly additionally spooked by geopolitical uncertainties as we near the November US Elections.
Second, further US monetary easing and/ or prospective US dollar weakness, will be met with additional easing by other economies, such as China and the Eurozone, who seem eager to avoid any currency gains against the US dollar. In short, expect uncoordinated, but coincident monetary easing through the rest of this year.
This will bolster the Global Liquidity cycle, through what we have elsewhere warned may prove to be an air-pocket over the next few weeks. Below we reproduce our index of World Central Bank Liquidity to put this into cyclical context. Alongside we show the current cycle evolution (2021-24) bench-marked against an average tightening cycle (1972-2020). These charts confirm this is a very ‘normal’ investment cycle. They are both consistent with further monetary ease: watch the forex markets, they may give the cue.


Sir Issac Newton once said "I can predict the movement of the heavens, but not the madness of crowds!" With that caveat my view would be to reduce risk until (a) more evidence of Fed intentions; (b) a push lower in USD and/or (c) a circa 10% correction in SPX that provides a re-entry point
Hi Michael, I know you won’t want to be pinned down, but does this “air pocket” of “a few weeks” mean 4 weeks, 12 weeks? Can you give any estimate of time scale on that? The markets are seasonally weak in the summer, so should we just step aside until Autumn?