


Tectonic Shifts in Oil Trade Flows
Tectonic Shifts in Oil Trade Flows
The future of the U.S. dollar in oil trading, China's diplomacy in the Middle East, inventory levels cushioning supply in Europe, Kuwait's new mega refinery and more.

10 min read
On the last day of 2022, as many were celebrating (or lamenting) the end of a volatile year, the Suezmax tanker Gladiator departed the north-western tip of Russia after loading 1 million barrels of Russian crude. After almost 23,000 km and 55 days at sea it discharged its cargo in Shandong province, China – as seen in the visualisation below. This is only one of at least seven tankers that have made this colossal journey since December. Before the EU import bans, the vast majority of Russia’s crude exports from the Arctic were shipped to Europe, the U.S. or the Caribbean. Since December, most if not all have gone to China and India. The increase in the average distance? 7,400 – 18,000 km. Global oil flows have shifted. They are becoming more inefficient and skewed in response to foreign policy, geopolitical risks and turbulent market conditions, impacting prices across the value chain.
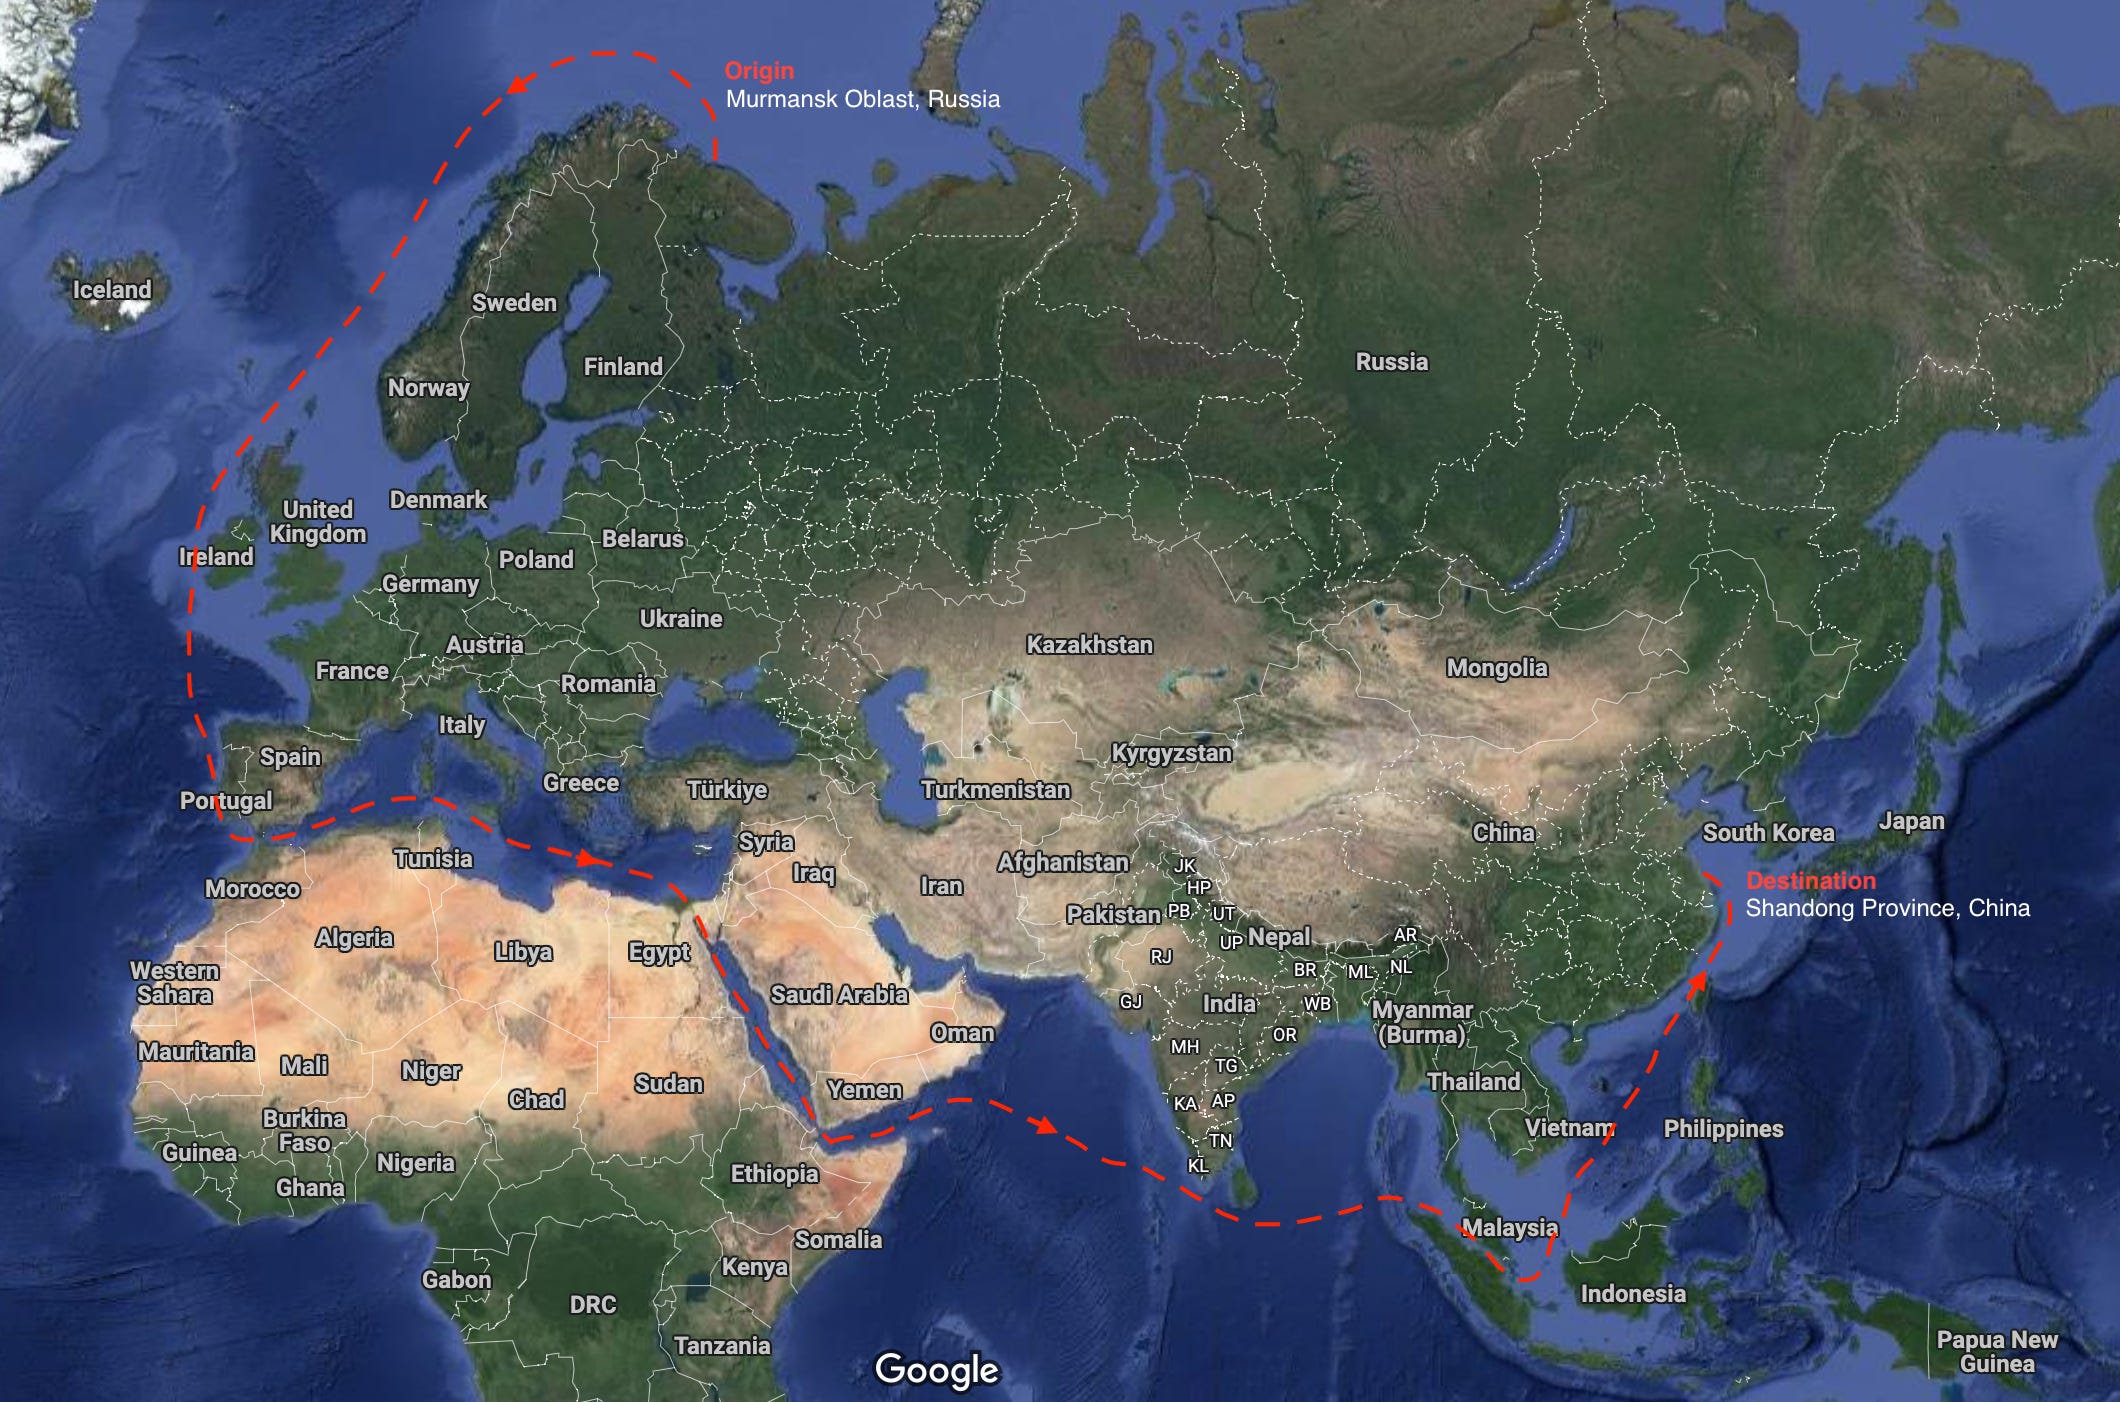
This shift continues into refined products as we observe an increased quantity of seaborne cargoes from Russia now landing in North/West Africa and Turkey which would have otherwise almost certainly be consumed by the EU states, at least in such large quantities. China and India continue to purchase large proportions of Russian oil, often at discounted prices.
The Global Oil Story in Data
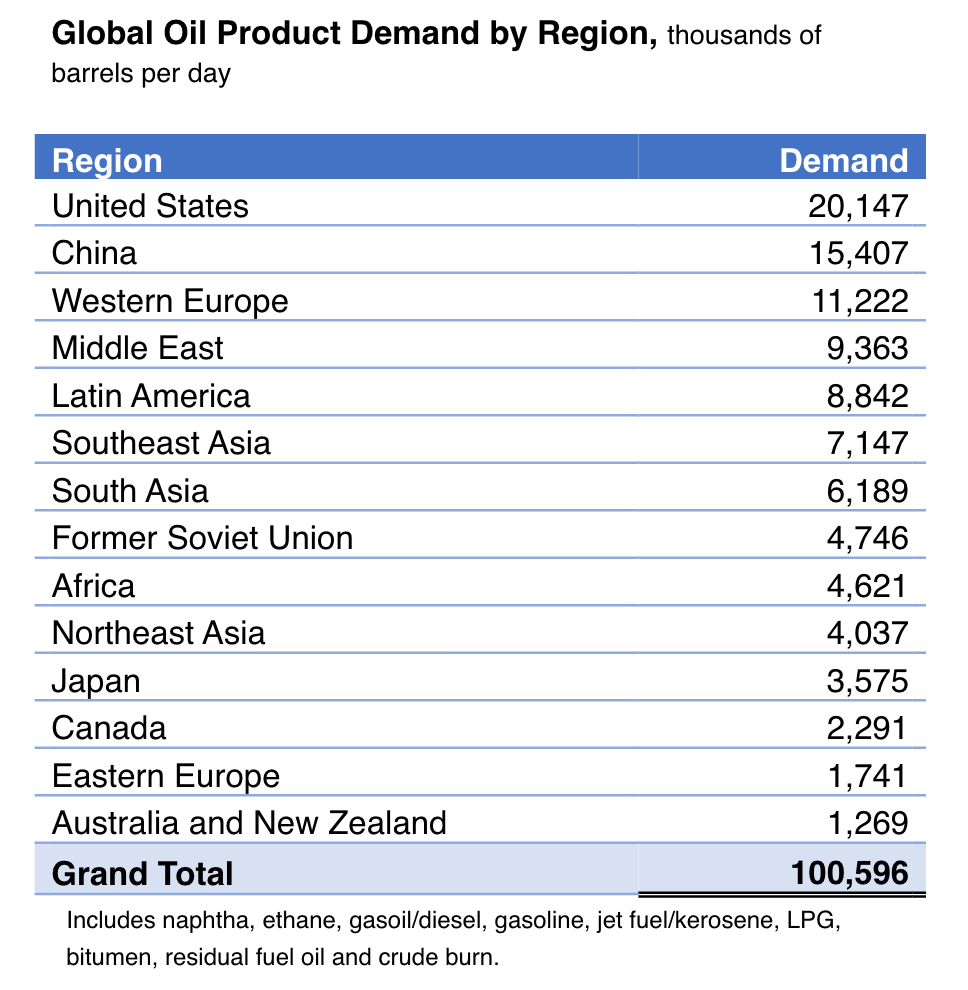
Global oil demand is sitting at roughly 100.596 million b/d today, continuing to increase from the COVID years, if that is what we’re calling that short era now. Asia is expected to contribute over 70% of demand growth this year (China alone accounting for over 50% for the region). Jet fuel/kerosene is taking flight (terrible pun I know) with the highest demand growth in absolute volumes in 2023, followed by gasoline driving (last pun I promise) growth in second place.
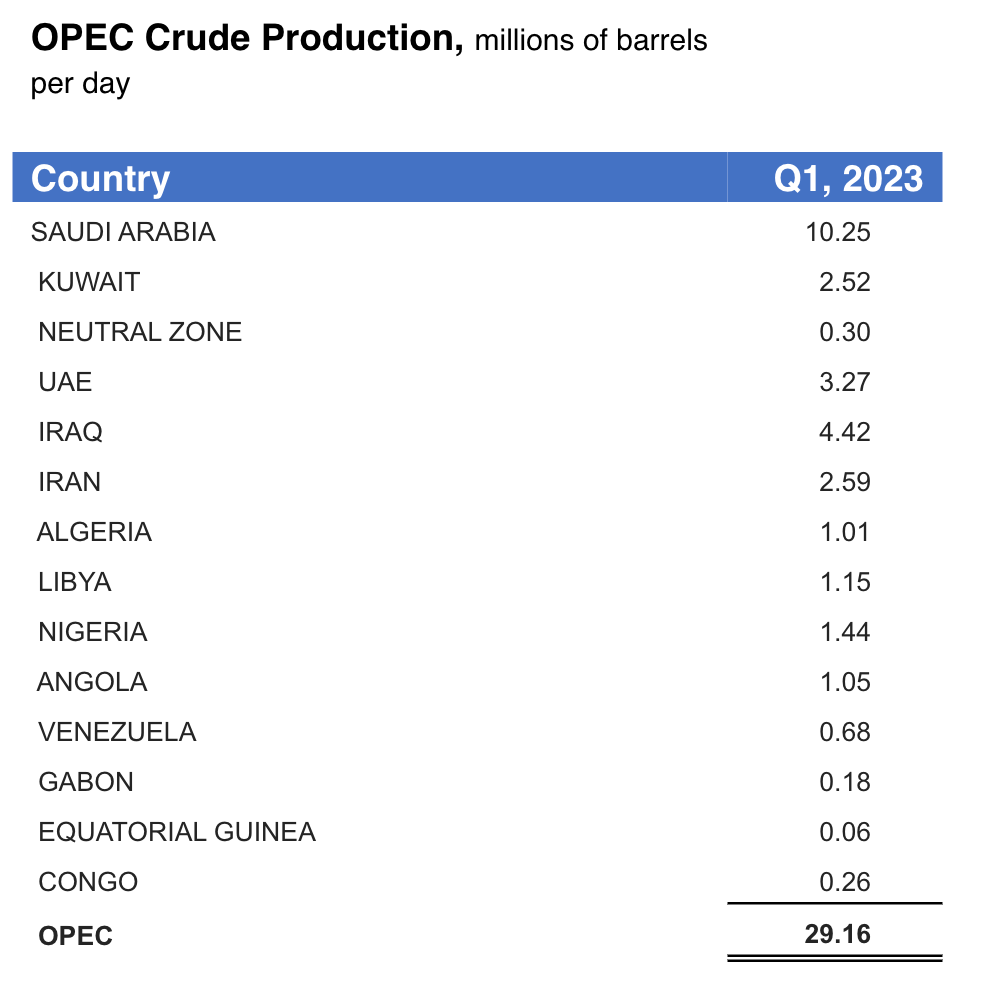
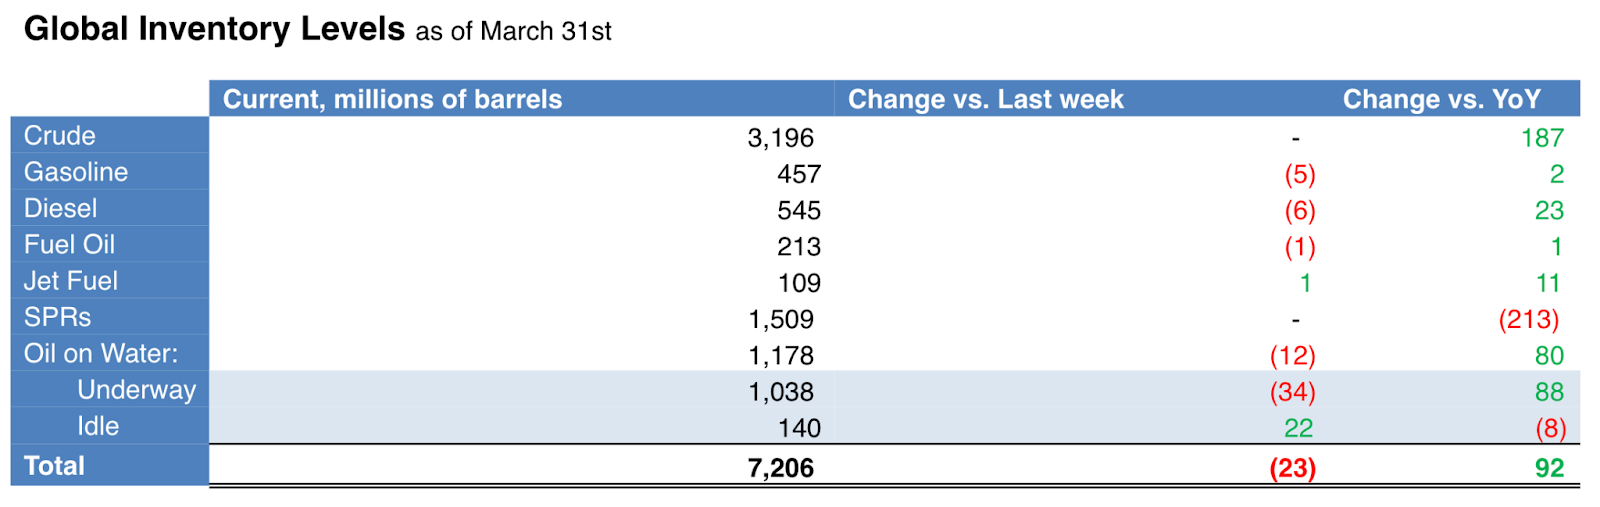
OPEC+ quotas changed in a surprise move earlier this month to reduce crude supply by around 1 million b/d starting in May extending until December. Refining margins remain strong particularly for diesel and gasoline while VLSFO and naphtha struggle, although the latter is steadily improving. The below data is up-to-date as of April 1st – and no, they are not subject to an April Fool’s prank.
Key Events to Track
1. Russian Exports & European Sanctions
On February 5th the European Union banned imports of Russian oil products after similar sanctions a couple of months earlier in December for Russian crude, together with coal, steel, gold and other commodities including caviar and vodka (at Commodity Labs we prefer tequila anyway). This has been mandated together with the below price caps for Russian oil, subject to changes:
$60 USD/BBL for crude oil
$100 USD/BBL for premium petroleum products
$45 per barrel for discounted petroleum products
Russian oil production remained near pre-war levels throughout last year. Now, Russia’s exports to global markets have fallen by more than 500,000 b/d to 7.5 million b/d. Shipments to the EU, North America and OECD Asia-Oceania have plunged from 4.5 million b/d, now seeking alternative destinations. Willing buyers in Asia, namely India and to a lesser degree China, have snapped up discounted crude oil cargoes. These two countries took in more than 70% of Russia’s crude exports last month.
While Russian crude oil shipments are mostly heading to Asia, a more diverse set of buyers is emerging with shipments heading to North Africa, Turkey and the Middle East rising by 300 kb/d, 240 kb/d and 175 kb/d, respectively. Latin America received roughly the same as before the war.
It remains to be seen if there will be sufficient appetite for Russian oil products now that the price cap is in place or if its production will start to fall under the weight of sanctions. Revenues are already dwindling together with the Ruble. In February, Russia’s estimated oil export revenues fell to $11.6 bn - a $2.7 billion decline from January when volumes were significantly higher, and nearly half of pre-war levels.
European economies are filling the hole by sourcing a far larger proportion of crude from the U.S., likewise for LNG although limited liquefaction capacity in terminals on Europe’s coasts has been a bottleneck over the past 12 months. The Arab Gulf is also exporting increased quantities of oil products to Europe, especially with a ramp up in refining capacities coming online in Kuwait, Oman and Saudi Arabia.
2. Labour strikes in France and their Impacts on Refining
In January President Macron circumvented a full vote through parliament to pass a divisive pension bill which would raise the retirement age from 62 to 64 years old by 2030. In true French fashion, the subsequent strikes were massive and have affected French refining outputs significantly, including:
Gonfreville (247,000 b/d), TotalEnergies: previously shut down due to strikes, now restarted as of April 11th.
Gravenchon (240,000 b/d), ExxonMobil: previously halted CDUs due to strikes at nearby oil terminals, now restarting as of April 4th.
Donges (222,000 b/d), TotalEnergies: offline since late February originally due to technical reasons, but product shipments were later blocked due to industrial strikes. Now preparing to restart from April 10th.
Overall the strikes knocked out roughly 700,000 b/d of refining capacity and forced the government to release strategic stocks following shortages at retail stations.
Impacts on prices have been minimal so far in April as (I) the neighbouring Amsterdam-Rotterdam-Antwerp (ARA) inventories together with the release of French strategic petroleum reserves have acted as a cushion to cuts in refineries’ outputs and (II) French GDP is expected to grow by less than 0.5% in 2023 with weak manufacturing data and lower consumer confidence, weighing down oil demand.
3. The Rise of Kuwait’s New Mega Refinery
Kuwait has started a new megarefinery, named Al-Zour, which will be 615,000 b/d at full capacity. After starting operations in late 2022, it restarted its second CDU this week to bring its processing capacity up to 410,000 b/d. LSFO exports have surged as a result to an estimated 300,000 mt/month, up from 100,000 mt/month in November.
This will fundamentally alter trade flows as much of Al-Zour’s LSFO will likely make its way east towards the world’s largest bunkering hub, Singapore – rendering the arbitrage economics that have enabled Western cargoes to arrive in Asia increasingly unviable.
This also means more crude consumption in the Arab Gulf, with crude runs in the broader Middle Eastern region expected to increase steadily to around 9 million b/d with the ramp up in refining capacity in 2023, led by Kuwait, Saudi Arabia and Iraq.
4. China’s Proactive Diplomatic Strategy
The Saudi and Iranian foreign ministers met in Beijing on April 6th paving the way for the signing of a joint statement confirming the reopening of their embassies and consulates, as well as resuming direct flights and facilitating visas for citizens. The statement also emphasised the importance of reinstating decades-old agreements on security cooperation, trade and investment. This may have a domino effect on Iranian oil exports, American-Iranian sanctions, the proxy war in Yemen and megaprojects taking off in Saudi Arabia.
This has taken place in tandem with China’s growing appetite to use their own currency to buy oil and LNG from the Arabian Gulf and Russia instead of the U.S. dollar. As the largest importer of oil, China’s moves to displace the USD as the global reserve currency are receiving plenty of attention. How much of a risk/opportunity is this? The doomsayers cite China’s meteoric rise to superpower status and the emerging multipolarity of the global economic system; the Americans’ stagnant productivity growth, fiscal deficits, growing debt burden and trade wars. While the dollar’s share of central banks’ exchange reserves has declined since 1999, it does still dominate over 55% of world foreign exchange reserves with the Yuan being less than 5%. In the long-term the dollar’s advantages could of course slip, just like the British pound did after the 19th century – although it would require China to be much more open with exposed capital flow markets and more liquidity. The threat for the U.S. could also come from within, with political dysfunction on the rise in the West paired with rising wealth inequality causing socio-economic ruptures which may become irreversible. We also need to consider the widespread presence of USD-pegged currencies such as those found in the Arab Gulf. On a more trade-related level, China’s share of global trade finance has more than doubled since the Russia-Ukraine war started, as charted by the Financial Times below.

Taiwan remains as the obvious wildcard with tensions rising between China and the U.S. after the Taiwanese President’s meeting with a U.S. Congressional delegation on April 5th.
5. OPEC+ surprise cuts
On April 2nd, OPEC+ surprised the markets with a production cut announcement totaling 1.16 million b/d for May - June. The cuts grow to 1.66 million b/d from July - December when including Russia’s six-month extension of a 500,000 b/d reduction. Compliance is not always strict amongst member states, so these numbers will inevitably vary.
The next major OPEC meeting will take place on June 4th with their Joint Ministerial Monitoring Committee (JMMC). Remember, the general aims of OPEC are to keep oil prices stable and ensure profitability for producing member states, without increasing prices so much that they begin to destroy demand (as economies decrease their consumption due to high costs).
6. A Snapshot of Crude & Clean Tanker Rates
For crude tankers, the OPEC+ announcement to cut production by over 1 million b/d after May will reduce cargoes out of the Middle East impacting negatively the dirty freight rates out of the region. China’s demand recovery will generate more demand for barrels from the Atlantic Basin to the Far East, leading to longer distances and sustained freight rates for the remainder of the year, minus some seasonal declines in Q2 across all crude tanker sectors.
For clean tankers, freight rates for routes loading out of the U.S. Gulf Coast heading to Latin America and across the Atlantic have seen their volatility cycles more than halving in Q1. Tight supply for naphtha suitable vessels has been pushing L1 rates up at the start of April, while LR2s continue dropping. Refined product exports from India to Europe are expected to remain elevated, supporting LR rates.
A couple of regulatory topics in this space to keep an eye on are the EEXI (Efficiency Existing Ship Index) and CII (Carbon Intensity Indicator), both aiming to curb emissions in the shipping sector.
7. Iraqi Crude Supply Disruptions
The Kurds, an ethnic minority in the Middle East, are present in many countries but have no actual country of their own. Kurdistan is a disputed region in (or adjacent to) northern Iraq which has formed its own autonomous government. 450,000 b/d of northern Iraqi crude exports have been shut down since March 25th after the International Court of Arbitration ruled that the federal government should regain control over Kurdish loadings from Turkey’s Ceyhan terminal. Turkey has vowed to comply with the court ruling and stop loading Kurdish oil until a resolution is reached between the Kurdish Regional Government and Baghdad. Of the affected volumes, 350,000 to 375,000 b/d originates in Kurdistan.
Crude production in Iraq climbed steadily from 2010 (when it was almost 2.5 million b/d) to 2019 (just under 4.5 million b/d), but has experiences a slight decline since with political and military conflicts.
The Energy Transition & Oil
The energy transition towards cleaner energy sources and fuels is as much about the evolving role of oil as it is about the rise of renewables and other technologies, policies and socioeconomic drivers. Various super majors and data providers expect oil demand to peak at different times and for different reasons, for instance many cite petrochemicals as sustaining oil demand growth well into the 2030s. What we can reasonably expect is that oil demand will peak within the next three decades.
The famed 2-degree scenario, the global community's accepted limitation of temperature growth to avoid significant and potentially catastrophic changes to the planet, is unlikely to be reached. The data points towards humanity exceeding this in the foreseeable future with 10 billion global inhabitants and growing per capita consumption only scratching the surface, unless more drastic changes take place in the coming years. Some topics to watch, and which we plan to investigate in more depth in future editions include:
Hydrogen economics: most hydrogen is currently produced from fossil fuels with carbon capture, utilisation and storage (CCUS).
Global distribution of clean energy investment: According to the IEA, only 20% of clean energy investment occurs in emerging/developing economies, excluding China, despite containing two thirds of the global population.
Carbon intensity of crude production: different fields and operators will produce different quantities of carbon emissions per barrel of crude oil produced due to factors such as transporting via trucks vs. rail vs. pipelines vs. ships vs. other methods, flaring, methane leakage, refining efficiencies, etc. and their abilities to (I) offset, (II) reduce, (III) substitute and (IV) remove carbon.
Electric vehicle penetration and its impacts on fuels. Sales of electric cars doubled in 2021 to 6.6 million.
National energy policy mandates: The EU is now legally obligated to reduce their emissions by at least 55% by 2030 for instance.
Supply chain security of battery metals: many critical battery metals such as lithium and nickel are sourced from politically unstable regions with uncertain reserves.
Final Comments
Commodity prices tend to move in tandem with economic activity, often peaking as central banks’ interest rate hiking cycles peak. A warmer than average winter in the Northern Hemisphere played into bearish outcomes for oil and energy prices this year, while a bullish driver still playing out is the reopening of the Chinese economy. A U.S. dollar that looks like it has peaked, at least for the medium-term and the likely unstoppable tsunami of change that is the energy transition is causing a far-reaching set of changes for oil balances, prices and energy security globally.
Thank you for reading this edition. We will be sharing updates with you at the start of every alternate week going forward and we welcome any feedback as we work to expand our coverage and deliver useful insights.