

Continuous Glucose Monitors: Does Better Accuracy Mean Better Glycemic Control?
Continuous Glucose Monitors: Does Better Accuracy Mean Better Glycemic Control?
Accuracy is good, but precision is essential.

Introduction
When you take your pulse, whatever your reading is, well, that’s your pulse. It is what it is. Same with your blood pressure, temperature, and cholesterol levels, and almost everything else …
… except blood glucose levels, and that presents a very different paradigm for managing type 1 diabetes (T1D). This is especially germane now, given the robust development of automated insulin pumps, or “closed loop systems” (CLS), whose effectiveness, not to mention basic function, relies on data from continuous glucose monitors (CGMs).
To understand why this basic molecular aspect of glucose’s residence throughout the human body is so critical, consider the model most people had always assumed: If you use a blood glucose monitor (BGM) and get a reading of 95 mg/dL, the assumption is that your whole body’s glucose content is 95. Any variation from the device’s reading and the actual amount of glucose in the body is more due to an error in the device.
But it’s not that simple because glucose is not evenly distributed throughout the body, nor within a small sample (such as a drop of blood or interstitial tissue). Before CGMs, these nuances could easily be overlooked because T1D was never managed at that level of granularity. But when continuous glucose monitors came on the market, it completely changed how T1D was managed. Rather than getting sporadic glucose readings throughout the day using finger-prick blood glucose meters (BGMs), CGMs could perportedly track glucose levels on a more granular level.
And yet, here’s where glucose’s natural volatility sneakily presented itself to be a more difficult matter than anyone expected, not just for CGMs, but for the entire practice of managing glucose levels. Consider Dexcom’s G7 CGM and its claim of improved accuracy over the G6 (and all other CGMs). The following chart shows the data from both the G6 and G7 worn at the same time.
Obviously, both sensors are able to track macro-level trends, from which you can reasonably infer “systemic glucose levels.” But again, that’s an inference you can make by taking in the whole picture—or, at least, segments of time.
But what about individual readings? The G7’s “higher accuracy” reveals glucose’s natural volatility. Since optimal T1D management requires making in-the-moment decisions on whether to dose insulin or carbs (or neither), one must rely on these readings. If you’re a T1D and you see these individual readings tick by, do you suddenly decide to take an action? Or do you wait for the next reading? Or ten readings? Or more? The more readings you need to make a decision, the more time has gone by that you didn’t make a decision. And that’s a big deal. In glucose management, time is critical, because things spin out of control very fast.
If you don’t want to wait longer, you may have to rely on fewer readings, but then you run the risk of whether each reading genuinely represents true systemic glucose movements. And, more importantly, there’s rate of change. That’s just as important as actual glucose levels. Bad data means bad dosing decisions.
Looking at the chart above, the G7 is reporting many individual reads that, if taken literally in the moment, could easily be interpreted as a very rapid change in glucose levels. Moreover, it’s very hard to infer actual trend patterns up or down in short time segments—it takes a long time before you can really see that information. By then, the opportunity to have made a clinical decision at the right time has long passed.
The G6, by contrast, shows much smoother movements, which means that each reading can be more reliably considered in dosing decisions. But if the G7 is more accurate than the G6, then how reliable is the data from the G6 for each dosing decision? We have a paradox.
What’s missing from this analysis is that glucose levels are stochastic—that is, there’s randomness due to the chaotic nature of fluids—especially when so many other molecules are bouncing around inside. In the article, “Limits to the Evaluation of the Accuracy of Continuous Glucose Monitoring Systems by Clinical Trials,” the authors describe this very stochasticity of glucose, and use this data to call into question the appropriateness of how clinical trials for CGMs are conducted in the first place.
In layman’s terms, this means that if you test any given sample for glucose, each reading may be off by some percentage—10%, 20%, 30% or more—from the “true value” of glucose concentration depending on the amount of glucose there is. The more glucose there is, the higher the randomness factor. This phenomenon is amplified dramatically when glucose levels change. The greater the change, the greater the volatility, and by consequence, the less reliable any single glucose reading is as it relates to systemic glucose levels.
In other words, the amount of glucose in a single sample—say, 3 microliters—can well be measured by multiple devices, and the difference between those measurements are how we derive a MARD value (mean absolute relative difference). But since each individual droplet of fluid will vary (potentially dramatically) from the next drop of fluid, any single reading is certainly not representative of systemic glucose levels, and should therefore not be used to make clinical decisions (unless, of course, for extremes, such as very low hypoglycemia).
What all this boils down to is the fact that the G7’s readings, though statistically more “accurate” than the G6 when compared against a reference measurement device, each individual reading is clinically useless. To make clinical decisions on dosing insulin or carbohydrates, one must know glucose levels and the rate of change between samples over time.
And that explains the difference between the G6 and the G7. Despite what most people thought about the way the G6 displayed its data—that it simply averaged subsequent glucose values to make a smooth curve—it’s far more complex than that. Knowing the glucose is volatile, the algorithm used complex formulas based on the nature of molecules inside fluids from five minutes’ worth of raw data it gathered from electronic signals it received from the enzymes on the sensor wire. G6 sensors had to be coded because the enzymes on each batch of sensors would require different algorithms to best infer systemic glucose values.
The G7, by contrast, does none of this—it aimed solely to translate the raw data into a glucose value, seemingly for the sole purpose of corresponding more closely to the external reference platform in order to achieve a desired MARD value. This is a great marketing claim—that the sensor is more “accurate”—but a remarkable step backwards for glycemic management.
To assess that more closely, the proper way would be to conduct an “effectiveness trial,” where T1Ds are blind to which sensor they’re using, so they can only see the CGM data on an app, and then try to manage their T1D. In this scenario, both the control group and the study group would be selected among T1Ds who’ve been using the G6 app for at least a year. You’d then split the group by randomly assigning half the users to continue using the G6 (the control group), whereas the others would use the G7 (the study group). At the end of the trial, you’d compare their TIR (time in range) to the values they had before the trial started. The control group should not really see much difference in their outcomes, since their CGM didn’t change. Those who were assigned the G7 would reveal how their outcomes changed: better, worse, or no difference.
Since no trials have been done like this, I tried to do it on myself. As it happens, my T1D is under very tight control, where I am normally 95% TIR, with very few hypoglycemic events, which I attribute to watching my G6 data very closely, and knowing how to make decisions using both current glucose trends, but also taking into account future glucose movements that may come from things I know I will be doing in the next 30-90 minutes.
As the data from my experiments will show below, I was only able to achieve a TIR of 75-80% using the G7. What’s more, I also experienced considerably more hypo events and greater variability, both of which can be harmful.
There’s a lot of detail here, so let’s start with the actual G7 data.
A sneak peak at Dexcom G7 data
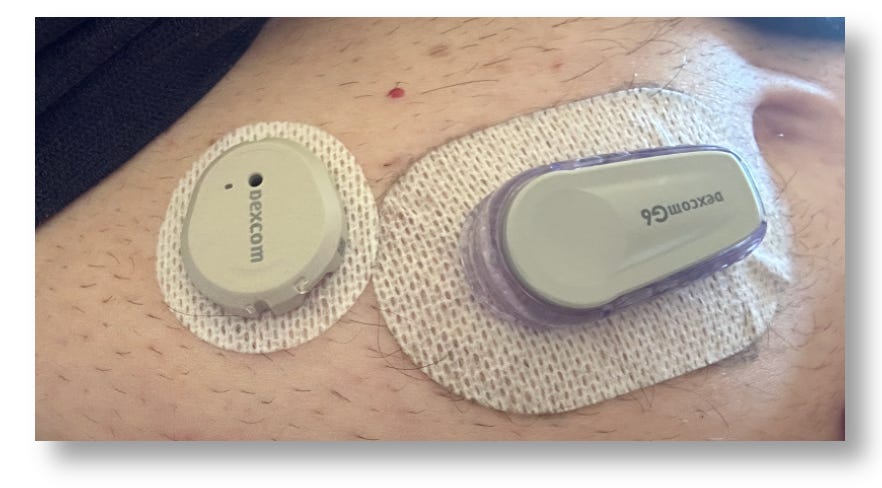
When my first box of Dexcom G7’s arrived in March 2023, I was as giddy as a kid at Christmas. Accuracy notwithstanding, the G7’s other great features are to die for! (Sorry. It’s a figure of speech.) It’s 60% smaller than the G6, it’s easier to apply, its warmup time is 30 minutes (vs. 120m for the G6), there’s a 12-hour grace period for sensor expiration, and a new sensor can be started while continuing to wear the one that’s expiring, allowing the user to continue seeing data during the new sensor’s warm up. These are all big wins over the G6.
I ripped open the new box, downloaded the new G7 app (which is different/better than the G6’s), and started the first sensor. Easy and fast. In 30 minutes, the magic began.
As it happens, I was still wearing an active G6, and there was no need to turn it off because the two sensors have their own apps that could be run simultaneously. Because both send their data to the Dexcom Clarity portal, you can see both at the same time on the Clarity app. But because the app is in black and white, you can’t tell which readings go with which sensor.
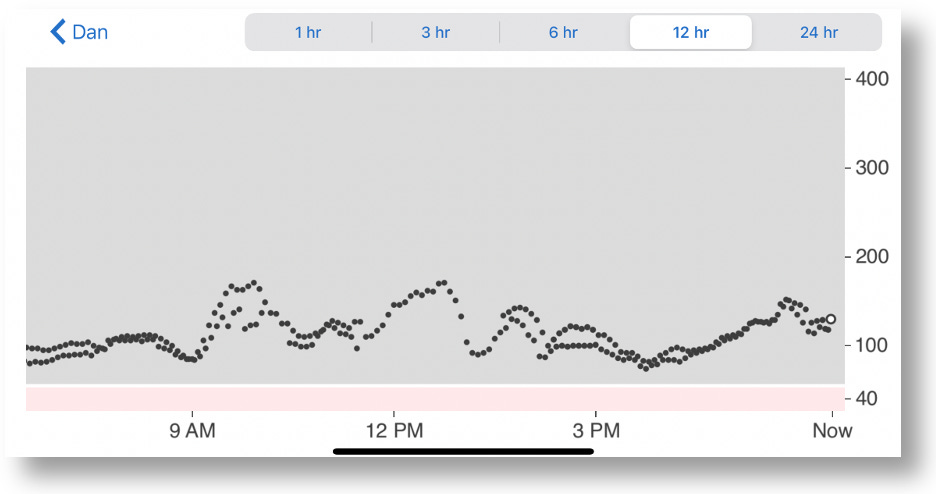
12 Hour chart from Dexcom Follow, which shows combined data from both the G6 and G7
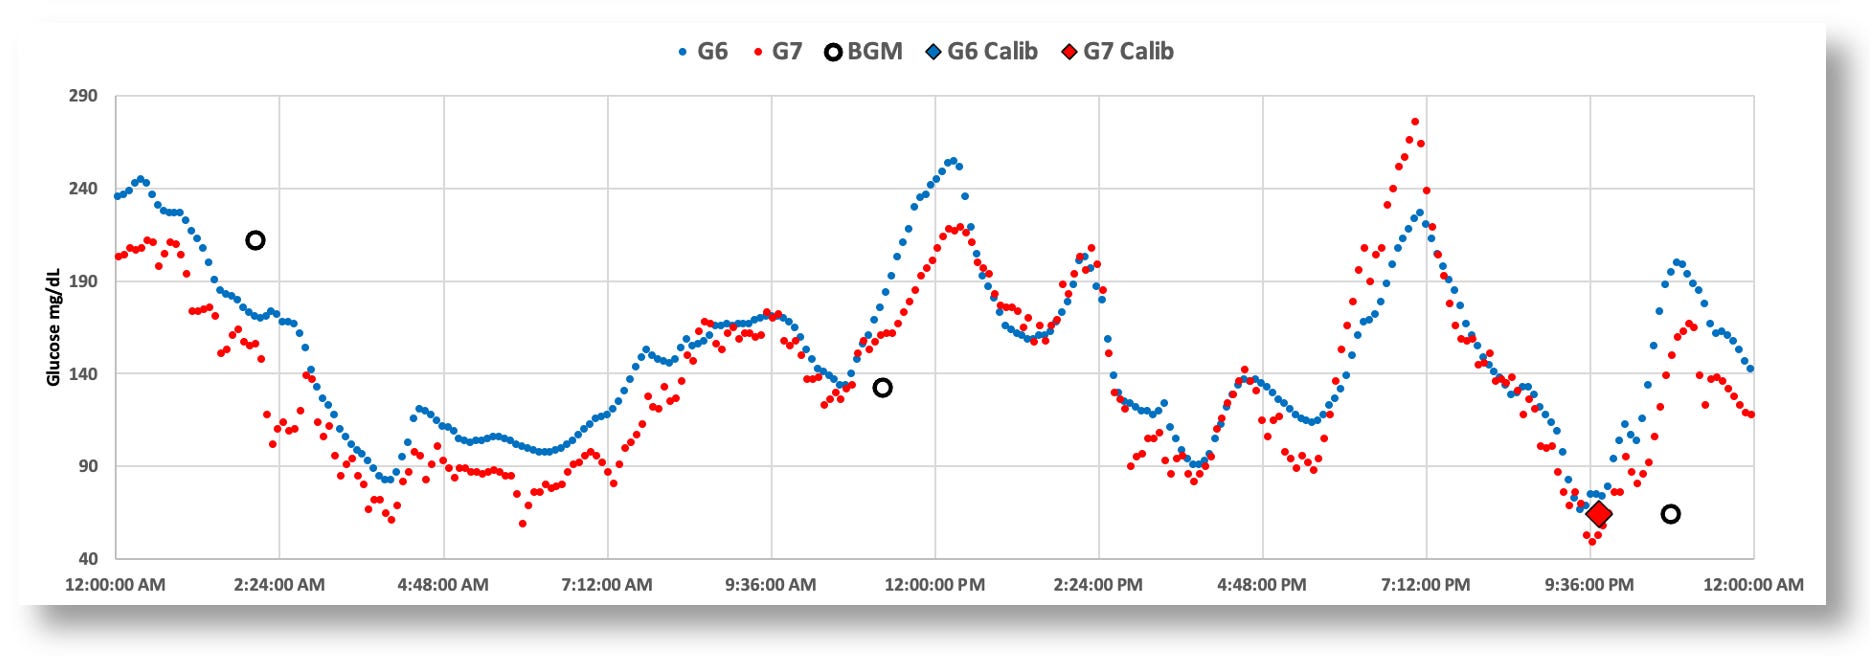
A better way to view and analyze such data is to download it from the Clarity portal, and import the resulting CSV file into a spreadsheet. From there, you can create graphs, analytical formulas, tables, and so on. Below is a 24-hour graph of the G6 and G7 data side-by-side. (Note: I also loaded data from my blood glucose monitor, the Contour Next One, which connects to my phone via bluetooth, and whose data can also be downloaded from the cloud.)

The G7 (red) shows more erratic glucose values than the G6 (blue)
The most striking and obvious quirk about is the G7 that everyone has been talking about is the jumpy glucose values. Some celebrate this as finally having what we hoped for–greater accuracy–and that it just requires getting used to. But I intuited there was probably a lot more to the story than just that. No one is asking–or even testing–the elephant in the middle of the room: Do each of these individual readings, accurate though they may be, help T1Ds make better, more informed management decisions?
Given the setup I just designed, I figured I’m set up to test exactly that.
Comparing G7 vs G6 time-in-range stats
During March, 2023, I wore both the G6 and G7 at the same time for 30 days (though I intended to do 90 days), during which time I would only observe data from one sensor’s app at a time to make real-time management decisions. After a period of a few days, I switched to the other sensor’s app, and repeated this pattern several times during the month. Upon completion of the experiment, I downloaded all my data to Excel and analyzed it to see how my TIR varied between the two. (I also collected data for insulin (InPen bluetooth enabled insulin pen), carbohydrates, exercise, sleep, and glucose levels from my Contour Next One blood glucose meter (BGM), which I included in my analysis report.)
Spoiler Alert: I intended to run the experiment for 90 days, but I had to stop at the end of one month because my performance with the G7 was so abysmally poor that it didn’t make sense to continue. Obviously, I represent only one person, so this does not say anything about others’ experiences. Nevertheless, there are critical and subtle issues revealed in my experiment that are worthy of consideration.
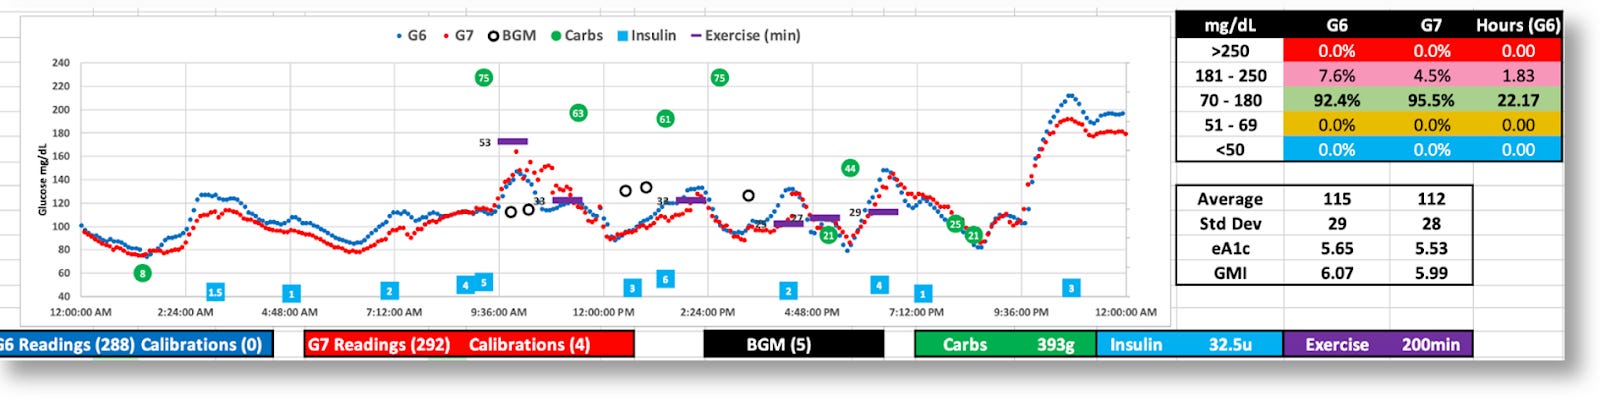
The graphic below is the topline dashboard from my month wearing both the G6 and G7:
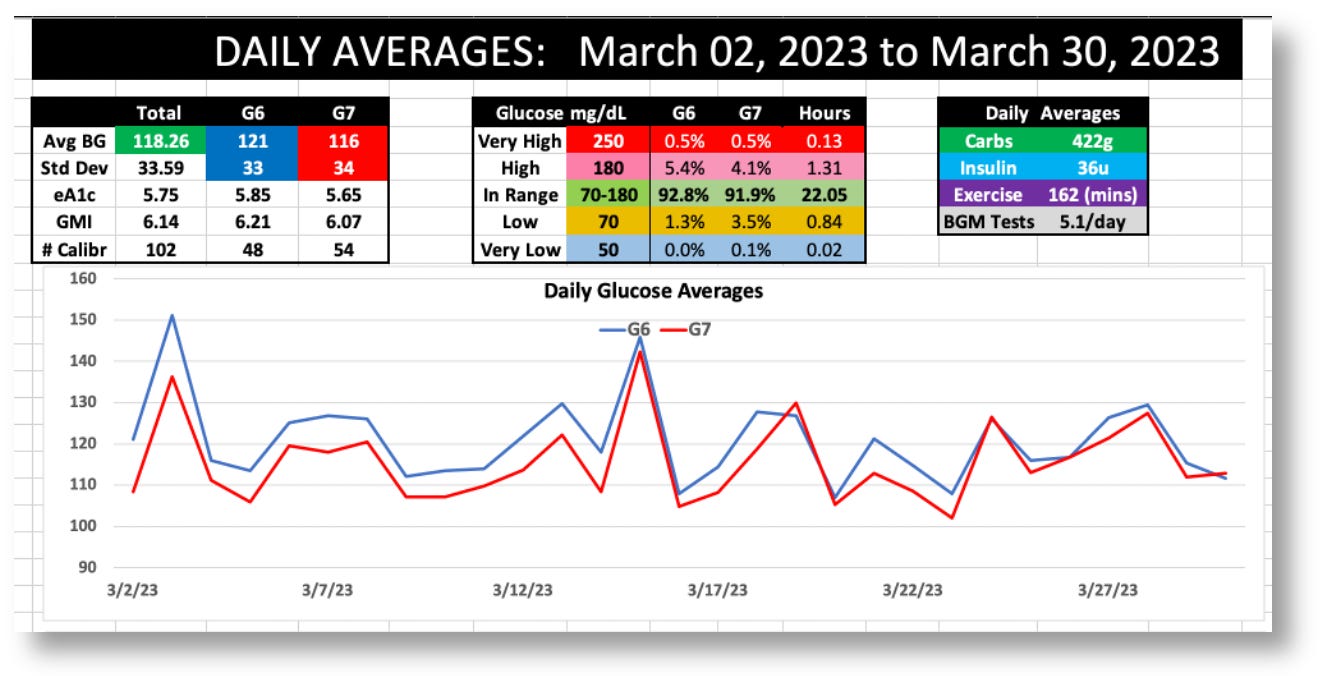
The first thing that pops out is that the G7 reported glucose values ~5% lower than the G6 (consistent with what others have reported online). Aside from that, the two sensors appear roughly equivalent: The G6 averaged 121 mg/dL, versus the G7’s 116, and the standard deviations (SD) were 33 vs. 34, respectively.
But the real difference between the two sensors is shown by the time-in-range (TIR) stats on a day-by-day basis, as shown in the following graph:
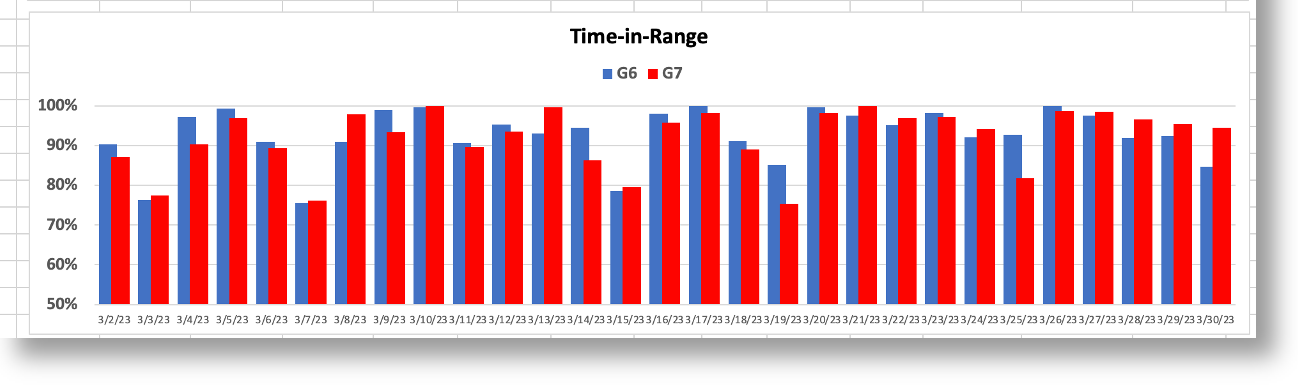
When I used the G6 to make decisions, I achieved a TIR of >90%. When I used the G7, my TIR dropped to the ~70% range. And you can see this remains consistent with the periodicity in the bar chart. To understand why the G7 made it harder for more to maintain glycemic control, let’s look more closely at the earlier chart, which is a day where my decisions were governed by the G7’s data.

Now, let’s zoom into the two-hour window between 4-6pm, which is highly representative of the kind of volatility there is in G7 data versus the G6, and why it’s hard to make real-time decisions.
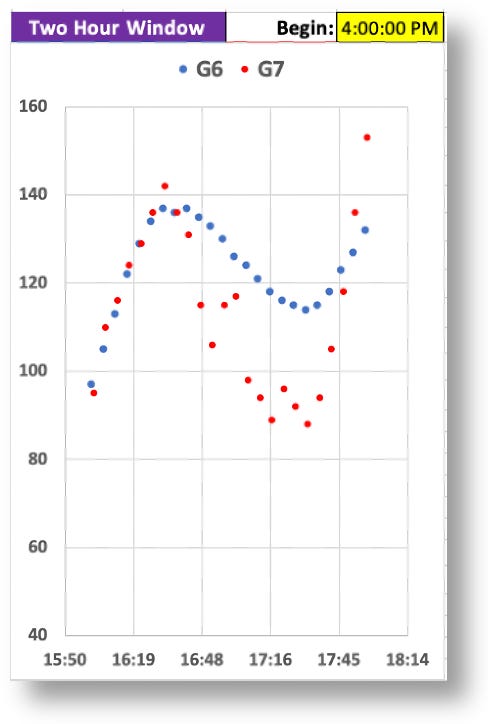
Remember, I couldn’t see the G6 data (the smoother blue graph), so at 5:30pm, and with only the G7 data in view, I saw the very rapid rise from 88 to 155 in a matter of 30 minutes. Granted, the data leading up to that was highly erratic, but these successive readings were not–they were decisively rising, and fast. Without any idea where these levels might top out, I knew I needed to start bolusing. As I always do, I began small and incremental boluses, keeping a close eye on those glucose levels as they rise, waiting to see when they level off or begin to fall, hoping not to take too much.
Turns out, the G7’s data shot up to 270. If this really was my real glucose level, the stacked boluses would have perfectly corrected these readings, and I would have had a soft landing. But, as the insulin started to kick in, my glucose levels plummeted to 49, making it clear to me that the G7 readings were not giving me reliable information. They may be “accurate,” but unreliable. I needed to investigate this.
In short, the G7’s readings, while potentially “accurate,” were mostly anomalous, at least insofar as using them to make management decisions. How can “accuracy” and erratic readings co-exist? Either individual glucose readings are not representative of whole body glucose levels, or systemic glucose levels are more volatile than we thought. Perhaps both.
We can see from the larger time scales that systemic glucose movements can be captured equally well by both the G6 and G7, but the problem is the small time scales: Do they offer useful enough information to make real-time management decisions?
To achieve tight glucose control, one uses short time windows. (Most people aren’t in tight control, and typically work on bigger time windows, so they won’t be as affected by these erratic readings.) For those who wish to react in time to correct for trends, the conundrum for the G7 is that your sugars may look like they’re starting to move up/down, but then the data suddenly reverses 30 minutes later because those earlier readings were anomalous. Therefore, you can’t “react” to movements until the trend line is reliable enough. If you believe the trend too soon, you could be right, but you could also be wrong. And by then, it’s way too late. So no, you can’t get used to that. Over time, your bets will eventually reveal an upper limit on a your TIR, which is the ultimate measure of glycemic control. I would predict that the G7’s volatility will impose an upper limit on a user’s TIR.
Here are more daily charts to consider (without additional commentary). You can zoom in on your own and guess how/why I was able–or unable–to see trends in time to make decisions proactively.

The G7 generally reports lower BG values
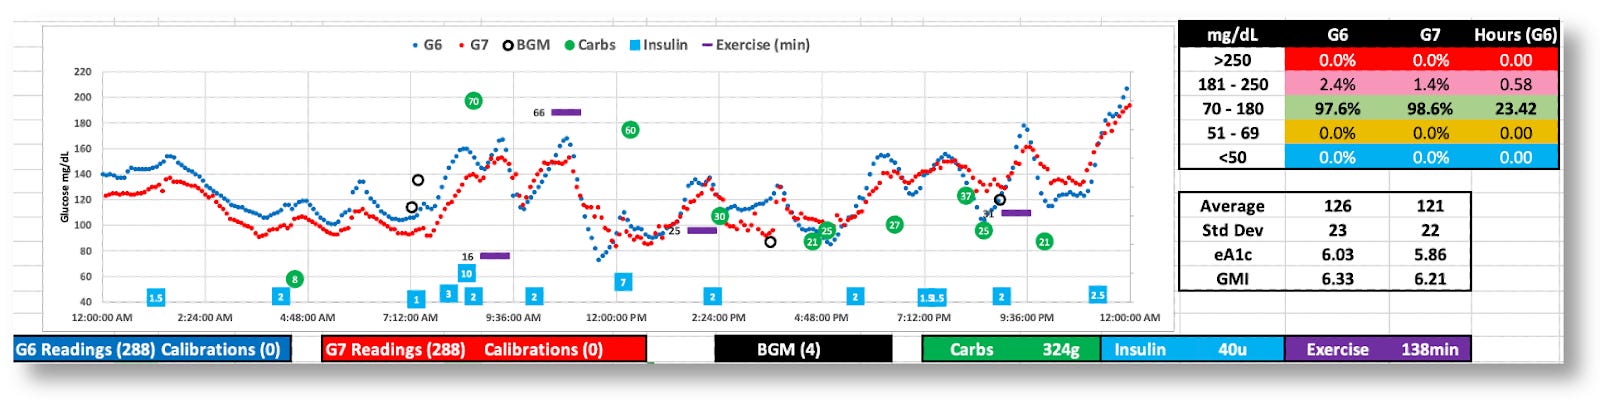
While both the G6 and G7 were tighter (SD=29 and 28), the G7’s volatility is apparent.
The G7 appears to behave better this day, but real-time decisions were based on G6 data

The was 100% in range, but the G7’s data was all over the map. (Thanks, G6!)
The paradox seems to be that the G7’s improved accuracy resulted in worse glycemic control, at least for me, and I suspect this would be the case for others who rely on short time windows of CGM data to make in-the-moment decisions (similar to the “sugar surfing” method).
This raises the obvious question about why the G7’s accuracy is the way it is, whether it can be useful, and what we can learn from it.
The Dexcom G7 trial: Exploring the futility of “accuracy.”
In Dexcom’s published report, “Accuracy and Safety of Dexcom G7 Continuous Glucose Monitoring in Adults with Diabetes,” 318 diabetic subjects wore three G7 sensors simultaneously over the course of ten days. For three of these days, subjects underwent clinically induced hyperglycemia and hypoglycemia under controlled conditions, where blood samples were taken and measured using a reference blood glucose sensor, the YSI 2300 Stat Plus glucose analyzer. The analysis showed that the “mean absolute relative difference” (MARD) between the two was ~8.8% for the G7, versus ~10% for the G6. The lower the percentage, the smaller the difference to the reference analyzer. Hence, greater accuracy.
While Dexcom’s trial showed that the G7’s MARD values were good–in fact, better than all other CGMs on the market–the devil is in the details, particularly in two critical ways.
First, MARD measures the degree in which a reading from a CGM matches a sample from a reference device. In each case, we’re measuring a single fluidic sample taken from a very large volume of fluid. If glucose’s volatility in fluids is such that two adjacent samples are not likely to be in agreement, it calls into question the very value of MARD in the first place. That is, what exactly is the aim of a CGM? A “blood glucose sensor” that uses a finger prick to measure a single sample is designed to measure a single sample only. That’s fine, and that’s where MARD has value. But a CGM is intended to provide greater utility than merely a single read—it’s intended to show systemic glucose levels, particularly, glucose trends.
With that said, I grant that we have no other way to measure CGM performance, nor do we even have a vocabulary to describe “systemic glucose levels,” because it’s never been done before. (There are ways to use labeled glucose that can be followed with imaging technologies, where one can infer where glucose resides in the body, its concentrations, and its motion of movement—somewhat like watching various currents in the ocean—but this is not practical for this use.)
So, given that we have to use MARD until another alternative is available, we must now look at what we can realistically gain from looking at CGM data when MARD is our only (imperfect) tool for measurement.
This gets to the second detail on the G7 data: Making any claims about MARD should not be reduced to a single number. Instead, we should be looking at MARD ratings are various rungs along the glycemic ladder. Indeed, according to Dexcom’s data, MARD values varied considerably under different conditions, as shown in this figure from their report.
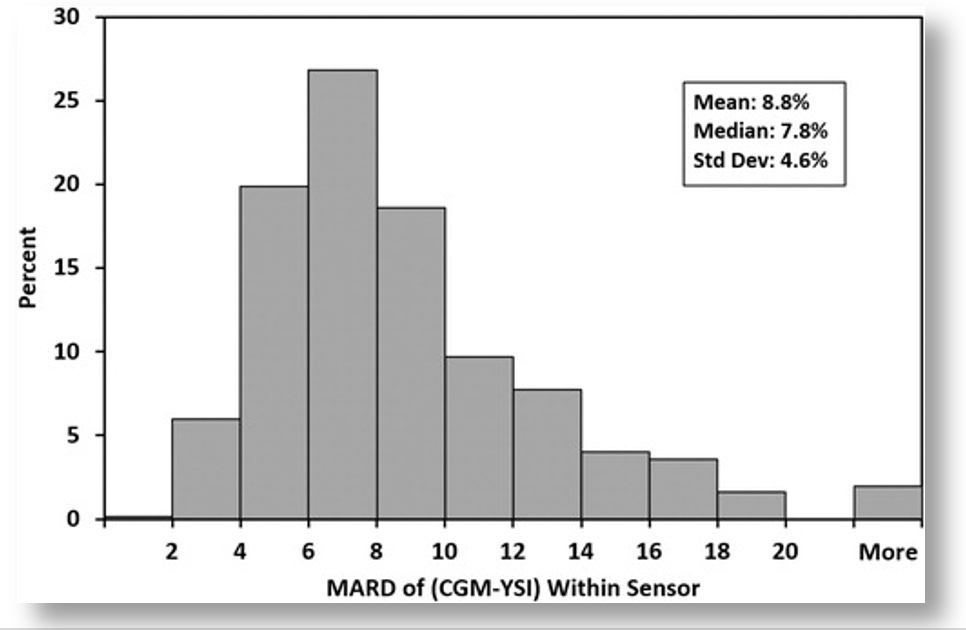
The mean and median per-sensor MARDs were 8.8% and 7.8%, respectively, 442 (71.4%) had MARD values <10%, and 12 (1.9%) had MARD values >20%.
The bar graph only shows the percent of sensors within each MARD level, but not the glucose values associated with each threshold. To get that, we can look at other tables in the report, which show how the G7’s accuracy correlated with different glucose values. In short, the accuracy was best when glucose values were in the sweet spot of glycemic ranges, but accuracy diminished at more extreme glucose levels.
What is also not revealed in Dexcom’s report is the rate of change (ROC), which can also greatly affect MARD. Once again, if you visualize glucose being highly volatile in fluid, imagine how much greater that volatility is when glucose is rushing in or out of that fluid rapidly. It’s like injecting dye into a vat of water: You’re going to see a lot of dense color in some places more than others, before the dye diffuses in the water settles out.
In the case of glucose levels rising or falling, Dexcom limited its testing to only 1 mg/dL change per minute, which showed some of the worst performing MARD values. In the real world, once a T1D eats a meal, glycemic levels can change at 2-4 mg/dL rather often. Relying on CGMs to capture that data is prone to significant error bars. (The G6’s algorithm is far superior in this regard for smoothing out these errors and giving the user or algorithm more reliable data to work with.)
To what degree this variability in MARD plays into real-world conditions, we can look at this metaanalysis of multiple studies on overall glucose levels for T1Ds who wear CGMs. It shows that only 30% of T1Ds have glucose ranges between 70-180 mg/dL 70% of the time, which is where the G7 is most accurate. By contrast, 80% of T1Ds spend more than 70% of their time above 180 md/dL, where the G7’s accuracy exceeds 30% error. (For context, 44.5% have an A1c between 7–9%, 32.5% exceed 9%, and only 23% of T1Ds had an A1c <7%.)
Despite the fact that the G7 is the most accurate at glucose levels between 70-180, T1Ds spend far more time far above 180. Hence, T1Ds are experiencing accuracy error rates of >30% most of the time. This means that decisions that either humans or algorithms are going to make in whether to dose insulin or carbs are dealing with highly imperfect information (especially compared to the G6, which was more reliable0.
It raises two critical questions: Why is this accuracy thing so hard to nail down? And given this poor level of accuracy, how can we rely on these readings to make good management decisions? There are three essential elements to this:
Glucose is not evenly distributed in the body.
Glucose is highly erratic because of diabetes.
It’s very hard to get reliable readings from complex fluids like blood and interstitial fluids.
Let’s go through each one.
Glucose Distribution
Glucose is the primary fuel for life to exist: Muscles use it to move, your brain uses it to think, and literally every bodily function that requires energy must break down glucose into substrates that allow electron transfers. Hence, different places require different energy levels, which is going to see glucose move through the bloodstream to get to these target locations. It’s like traffic in a highway system: some areas are going to be more congested than others.
The biggest consumer of glucose of all is the brain. Although it represents only ~2% of total body mass, it holds about 20% of the body’s total glucose volume. That’s a huge imbalance of glucose relative to the total blood supply. Moreover, the brain metabolizes glucose at the rate of ~5.6 mg per 100g of human brain tissue per minute, so a lot of mechanisms are geared towards moving glucose to the brain.
A similar-but-different process happens with other organs and limbs as well. Muscles use glucose to generate energy, and muscles pretty much cover our entire body, but some more so than others.
There are also other organs, such as the liver, kidneys and others that utilize glucose in different ways in different quantities.
The wide distribution of glucose in all these areas of the body can be tested using a standard BGM using blood samples from fingers, forearms, upper arms, legs, and so on. There are also mysterious about why glucose resides more in one area over another. In a 2020 paper called, “Differences in glucose levels between right arm and left arm using continuous glucose monitors,” the study’s authors wrote that “glucose levels in the right arm were higher than the left arm in 67% (range 46–98%) of all time-matched readings,” independently of handedness, gender, race, age or other factors. Indeed, Dexcom’s own clinical trials (the G7 and all the way back) show these differences as well: When sensors are placed on different parts of the body, different readings are obtained, and different levels of accuracy are ascertained.
Glucose Volatility
The wide distribution of glucose is variability, but the rate of movement contributes to volatility. To be sure, this is a very erratic and imperfect process, and even non-diabetic bodies get it wrong more often than we think. A study from Stanford University showed that healthy, non-diabetic subjects wearing CGMs had TIR levels of 96% most of the time, and often showed glucose movements that were difficult to explain, appearing similar to T1Ds. True, non-diabetics rarely go far outside of normal glycemic ranges, and they do snap back again more quickly, but volatility was still far more evident than what had previously been assumed.
Measuring Glucose in Fluids: Sample Disparity
Now that we know that glucose is widely distributed, and it’s highly volatile, the next big challenge is actually trying to measure it.
Even a tiny sample of blood or interstitial fluids contains a morass of disparate molecules of different sizes and properties that form crowding effects: Cells, proteins, antibodies, DNA fragments, viral particles, and junk of all sorts interact with one another in ways that force other molecules–including glucose–into whatever space is left over within any given fluidic volume. That means that any given sample may have different concentrations of glucose molecules from the next sample.
Lab-based glucose levels that are derived from venous blood draws from the arm involve a far larger volume of blood, so the ratio of glucose to that volume is more representative of the whole body. But when sample sizes get smaller, variability between samples increases. As test strips for BGMs required progressively smaller volume requirements, variability between results increased. Same thing with interstitial fluid used by CGMs: One sample can show a reading of 95 mg/dL, and the next reading could be 100 mg/dL and the one after that 80 mg/dL. Once again, Dexcom’s published data reflects this phenomenon by virtue of the ratio of errors they report for each reading, a phenomenon that gets progressively more erratic when glucose levels fluctuate or are elevated.
Not only does this demonstrate that accuracy has its limits, its very definition isn’t what people think it is. One reading is not representative of the whole body. It only tells you much is in that sample, which will likely be different from the next sample. Even for the sake of argument that these individual readings are 100% accurate, the numbers are so erratic, what value can they possibly bring?
What you really want are trends, which rely on a combination of accuracy and statistical probabilities. That is, what’s the range of likely glucose values that would follow the previous reading, or some number of prior readings.
That’s what brings us to the difference between accuracy and precision.
CGMs and the “precision decision”
Accuracy refers to how close a single measurement is to a true or accepted value, whereas precision refers to how close multiple measurements agree with one another.
In this case, the G7’s accuracy is measured by what the CGM reads compared to the YSI stat reference system. The closer those two agree, the accuracy is higher. By control, when I refer to “precision,” I’m referring to how closely subsequent readings are from the same sensor—not the reference analyzer. This is important, but the entire value of the CGM is to show systemic glucose movements. Yes, you want readings to be close to the reference analyzer, but since we already know there’s high volatility of glucose in fluids, we cannot possibly expect a high degree concordance. We want to do well, but not at the expense of discerning what the true systemic glucose level is likely to be. That’s why what we really want to see are successive readings that have sufficient consistency between each read. If any given value is wildly off from a previous value—or within the bounds of an apparent trend—then it needs to be filtered out, or at least modified to fit a statistically valid model.
Doing that isn’t easy, but that’s precisely what differentiates the value of a CGM against any other.
I achieved better TIR ratios with the G6 because “accuracy” is not where the value is–it’s precision. The G6’s algorithms properly calculated a reliable (and realistic) pattern of glucose trends, which are actionable.
Using the 5:30pm time window from the earlier example, we have both G6 and G7 data to look at. The G6 had 137, 135, 133, 130, 126, 124, 121, and 118, etc., which are similar enough to one another that the trend is apparent and decisions can be made. By contrast, the G7’s “more accurate” readings were 131, 115, 106, 115, 117, 98, 94, 89, and so on. You can certainly claim “high accuracy,” with these readings, but “low precision,” because they are too disparate from one another, making them a statistically improbable sequence, given what we know about glucose movement patterns.
You can improve precision by adjusting successive readings to produce more reliable trend patterns, as the G6 did, but that reduces the accuracy rating for the sensor. Or you can wait longer than five minutes to get more data, but users already think five-minute windows are too long. Alternatively, you can get both higher precision and higher accuracy by adding two or three more sensors to produce more data per unit time, but that adds to the cost and complexity of the system. What to do!?
This is an example of a well-known (and studied) phenomenon called the Two-out-of-Three Theory, which is commonly expressed as “Good, Cheap, Fast. Pick Two.”

From manufacturing to restaurant management to personal daily activities to vacation rentals–and yes, glucose sensors–the two-out-of-three problem is universally disdained by anyone having to make a business out of a product or service.
It would appear that Dexcom chose higher precision for the G6, and higher accuracy for the G7. Which model yields better glucose control is up for speculation until someone actually conducts a cross-over study similar to the one I conducted on myself. If one were done, I’d speculate the G6 will likely perform better for those in tight control (like me), but everyone else would likely find no difference between the two.
Summary
I personally suspect that few people will find the G7 helps T1Ds improve their glycemic control because few people are as tightly controlled as I am. Nevertheless, the G7’s other features (smaller, shorter warmup time, easier to apply, etc.) are so much better than the G6, I suspect it will succeed in the market.
But, as I mentioned earlier, the true test will be how automated insulin pumps perform using the G7, though they have their limitations for other reasons. You can read the full article, “Benefits and Risks of Insulin Pumps and Closed-Loop Delivery Systems.”
As for the “accuracy vs. precision” conundrum, I speculate that Dexcom is primarily focused on the value in marketing. It’s invaluable to claim that your MARD value is superior to all other CGMs, regardless of the dubious value MARD has for CGMs.
The second aspect of market forces is that Dexcom’s target market is moving well beyond T1Ds. There are nearly 40 million type 2 diabetics (with another 98 million presumed to be undiagnosed T2Ds), compared to roughly 1.5 million T1Ds. That, plus a very rapidly emerging market of non-diabetics: athletes, health enthusiasts, biohackers and everyday consumers. To these consumers, volatility in glucose levels just isn’t important.
In an article published in MedTech Dive in June 2023 titled, “Dexcom’s Lawver shares strategy behind CGM for non-insulin users”, the company first revealed its strategy for coming to market targeting the non-T1D community. In a follow-up article in January 2024, Dexcom revealed the name of the produce is Stelo, and was submitted to the Food and Drug Administration for review in the fourth quarter of 2023.
Of course, the downside for T1Ds is that some could actually see worse outcomes, and not even know it. The G7’s propensity to report lower average glucose averages (than what is actually in the bloodstream) may give people the false impression that their glycemic control has actually improved with the G7. (For more on this, see my follow up to this article, “Q&A about CGM Accuracy.”)
That said, Lab-based A1c levels can be used as an independent check on this claim. Though A1c levels can sometimes differ from CGM estimates, that difference is constant per individual. That is, the delta between A1c values and the G6’s eA1c estimates may be non-zero for some individuals, but whatever that difference, it would be constant over time. My A1c’s have always paired exactly with the G6’s data, and given that the G7 reported 5% lower averages than the G6 as both were worn, this is clearly something that others who only wear the G7 will never notice. They will believe their glucose averages are lower, even if they’re not.
If I had my wish, Dexcom would make it possible for the user to choose among a list of approved algorithms when they view their data on the G7. “Accuracy? Precision? You choose!”
I have an idea: Conduct effectiveness trials to see which algorithm actually yields improved glycemic control. That would be novel.
I suspect Freestyle Libre 3 is even “worse” than G7 with it’s MARD of 7.9% and one minute sampling rate. G7 on steroids :D I switched recently from G6 and what a ride I had yesterday when trying to fix one hypo got 3 consecutive nasty ones instead (tried to bolus after each climb out of low so that blood sugar wouldn’t skyrocket later). The readings just aren’t as predictable, they jump around and I ended up reacting too soon… But I will keep using it, who knows I might see some patterns in time and get a handle of it hopefully, I just like every minute readings too much.
Thanks for the article. I recently tried the G7 and found similar results. My Tandem pump using Control IQ seemed to struggle with the anomalies and it was frequently shutting off basal and issuing corrections.