

Baserunners Per Earned Run Allowed
Baserunners Per Earned Run Allowed
A Statistic for Clutch Pitching

The 2023 MLB season was, as we all know by now and are tired of hearing it, very different from other seasons. MLB Commissioner Rob Manfred implemented a series of rule changes designed to shorten the time it takes to complete a full baseball game, the two most iconic (and therefore controversial) changes being the addition of the pitch clock and the increase in the size of the bases. These two changes decreased the average game time from over 3 hours in 2022 to about 2 hours and 40 minutes in 2023, clearly achieving the effect Manfred desired.
The 2023 season also spawned a number of statistical anomalies. Ronald Acuña Jr., for example, became the first player to hit at least 40 home runs while stealing at least 70 bases. But perhaps the most surprising statistical anomaly came from the pitching side of baseball. Blake Snell, who got the second Cy Young Award of his career, became the first player in the history of baseball to lead the majors in both ERA (2.25) and walks (99). This raises a question: how could this style of pitching possibly be sustainable over the course of a season? Common sense would say that sooner or later, Snell’s astronomical walk percentage (13.3%) would catch up to him. But as his ERA would suggest, he was often able to work out of these jams. In 2023, Snell gave up a total of 217 baserunners: 115 hits, 99 walks, and 3 hit by pitches, and yet he only gave up 45 earned runs. This inspired me to create a new statistic to measure how efficiently a pitcher can work out of trouble: baserunners per earned run allowed, or BRER. The formula is simple; you add up hits, walks, and hit by pitches, and divide it by earned runs.
Using R, one is able to run a multitude of statistical tests, including regressions and correlations. Using data from 2023 pitchers that I got from Baseball Savant, I loaded up an Excel sheet and calculated BRER for all pitchers. I then ran a regression to estimate a linear relationship between BRER and ERA. I plotted the results and added a line of best fit:
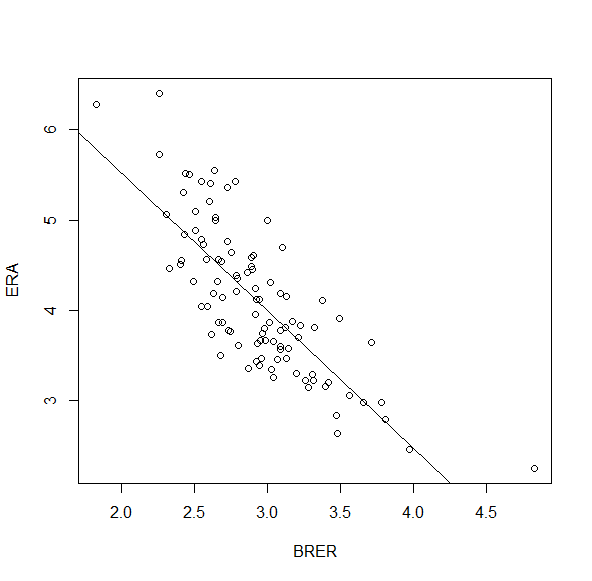
From the results of my regression, it appears that there does seem to be some relationship between ERA and BRER, though it obviously is not perfectly linear. I also ran a correlation test, which resulted in an estimated correlation of -0.787, rounded to three significant figures. The P-value for both tests was near zero (2.2e-16), suggesting that there does exist statistically significant evidence that the true effect of BRER on ERA is not equal to zero. Statistics majors will understand the reasoning behind that seemingly roundabout conclusion.
I also ran regressions and correlation tests on some other statistics, including K%, BB%, and xBA. For K%, the correlation is estimated at 0.302 (to three sig figs) with a P-value of 0.00230. This would mean that the calculated correlation would only have a 0.230% chance of happening if the true effect that BRER has on K% is actually 0. Basically, it seems statistically significant that BRER does have a positive effect on K%. The regression plot:
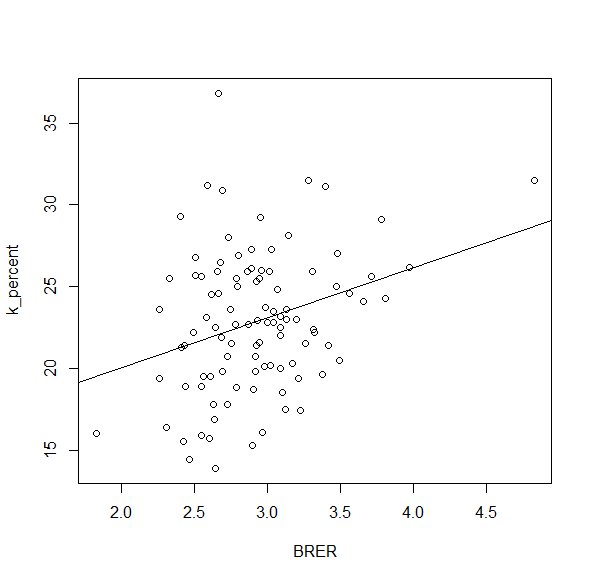
The graph is less convincing of this relationship, but it does appear to have a slight positive trend. For BB%, the correlation is estimated at 0.305 (to three sig figs) with a P-value of 0.00203, again suggesting statistically significant evidence that the true correlation between BB% and BRER is not equal to 0. The regression plot:
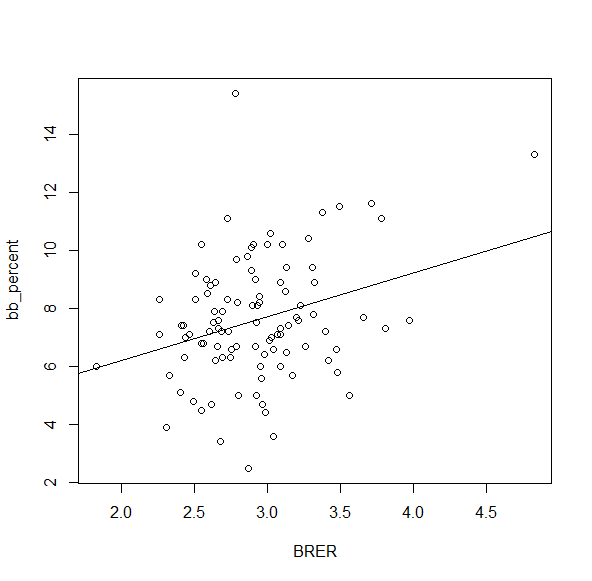
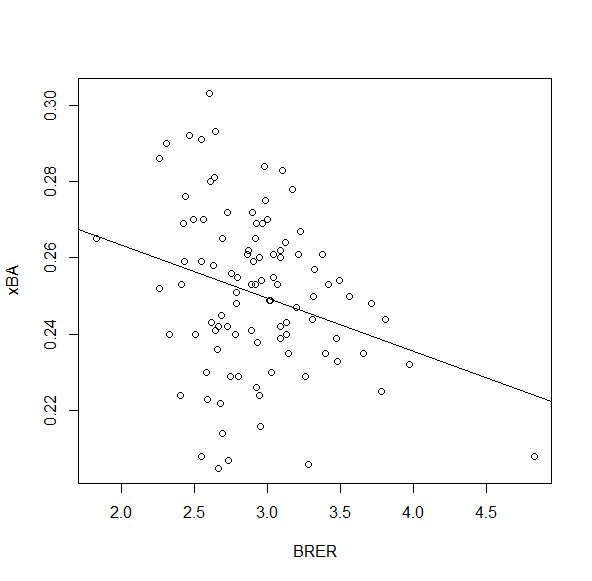
Interestingly, this suggests that pitchers with higher BRER are actually more likely to walk more batters. Whether this is because of the existence of some outliers, like Blake Snell, or whether this is actually true may be up to debate. Analyzing xBA again reveals a negative relationship. The correlation between xBA and BRER is estimated to be -0.279 with a P-value of 0.00490. The regression plot:
Again, a linear regression and correlation test are simply estimates of linear relationships. At a basic level, they are ways of determining how related two variables are to each other. The provided graphs clearly show that this is not a perfect linear relationship, and BRER may not be a great predictor of stats like K% and BB%, even if the correlation tests result in low P-values. More advanced statistical analysis would need to be done with these statistics. With that said, I am quite pleased with the results for ERA and xBA. It does seem that BRER can be used as a decent predictor of success. I think the reason for this is that BRER predicts how clutch a pitcher is when giving up baserunners. It doesn’t matter how many walks Blake Snell gives up as long as he is consistently able to work out of trouble, which he clearly was adept at doing in the 2023 season. This is just a preliminary statistical exploration, but I am excited to see if there are more applications for BRER.
Future statistical analysis should focus on exploring BRER over multiple years, perhaps following a single pitcher across those years instead of analyzing all pitchers over one year. Baseball is a sport with a lot of personal variation, especially when considering pitch repertoires and pitching styles. The sport has seen a continuing trend, favoring power pitchers over finesse pitchers. But perhaps the best pitchers are not the ones who give up fewer baserunners, but the ones who are able to pitch consistently despite the existence of baserunners.
What about inherited runners? A starter’s ERA depends in part on what happens if he leaves the game after walking the bases full and all or none of them score.