

Inflation and the Federal Reserve
Inflation and the Federal Reserve
Plus a new addition to the model portfolio

Editor’s Note: I’d like to take this opportunity to wish everyone a very happy Easter this weekend.
Please note US markets will be closed for Good Friday this week, so I’m sending you this week’s issue a day earlier than normal.
--EG
In this issue, I’m making several adjustments to the model portfolio included in the paid tier to FMS.
That includes two sells, three additions to existing recommendations, and a brand-new recommendation in a financial stock. I believe the latter may be in the early stages of a new “Golden Age” of profitability similar to that experienced in the 2002-2007 era when the company returned more than 21% annualized over a five-year holding period.
So, suffice it to say we have a lot of ground to cover in this issue, including another customary deluge of charts and indicators, so let’s get started with this.
Given the 2.1% surge in the S&P 500 since March 8th, there’s little doubt equity markets interpreted last week’s Fed statement, and Chairman Powell’s subsequent press conference, as dovish.
As I’ve mentioned in recent issues, there’s been some chatter in markets that recent hot inflation data might spur a shift in the (in)famous dot plot, a graphical representation of economic projections made by FOMC members.
Specifically, the last time the Fed updated its economic projections was following its December 13th meeting, when the median expectation was for the Fed to cut rates 3 times (25 basis points per cut) to a range of 4.50% to 4.75% at the end of 2024 from the current range of 5.25% to 5.50%. The worry was that the Fed’s dot plot might be adjusted last week to reflect a slower pace of cuts this year, perhaps just two 25 basis point reductions rather than three.
That didn’t happen – the median expectation of FOMC members remains for 75 basis points in total cuts this year.
I’m not one to spoil a party. However, I’d be remiss if I failed to point out that the FOMC did adjust its dot plot, just in more subtle fashion than feared:
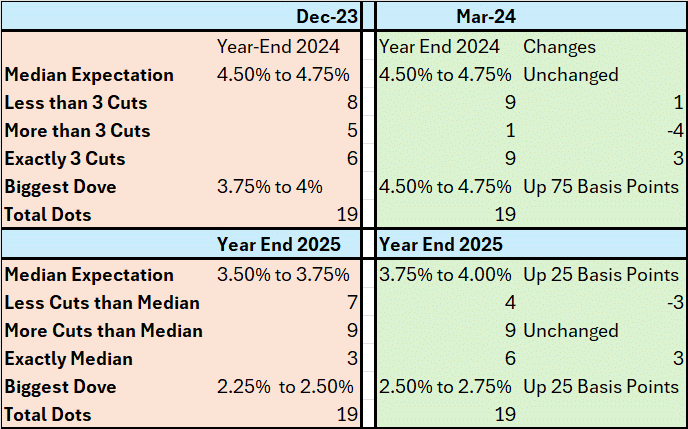
Source: Federal Reserve Summary of Economic Projections March 2024
The left-hand side of this table, shaded in red, reports key forecasts from the December 2023 Summary of Economic Projections and dot plot. The right-hand side, shaded in green, reports the same outlook for the March 20, 2024 dot plot.
The top half of the table reports the outlook for rates at the end of 2024; the bottom half shows the same data for year-end 2025. There are a total of 19 dots on the dot plot, each dot represents the forecast for a specific (anonymous) FOMC member.
Back in December, eight FOMC members expected the Fed to cut fewer than 3 times in 2024 and 6 members expected exactly 3 cuts. Only 5 members expected the Fed to cut rates more than 3 times – 75+ basis points – in 2024.
Back on December 13th, the most dovish (anonymous) member saw the central bank cutting rates to a target range of 3.75% to 4.00% in 2024, a total of 6 cuts in a single year.
At this week’s meeting, the median expectation remained for 3 cuts in 2024, however the range of expectations tightened noticeably – 9 members now see the Fed cutting exactly 3 times (up by 3 since December) and there’s only one projection for more than 3 cuts, down from 5 in December.
The Fed’s lone “uber-dove” now sees the Fed Funds target rate ending this year at 4.25% to 4.50%, about 50 basis points tighter than the most dovish member in December. Finally, there are now 9 FOMC members who expect the Fed to cut less than 3 times this year, up by 1 since December.
So, while the median forecast remains unchanged, there’s a hawkish shift just under that veneer – significantly fewer doves and at least one more hawk on the FOMC for 2024.
For 2025, the median rate expectation was nudged higher by 25 basis points and the FOMC’s biggest dove now expects one fewer cut than in December. There’s a less obvious shift in the distribution of expectations – there are 3 fewer hawks but still 9 FOMC members who expect the Fed to cut more than the median by the end of next year.
Simply put, it wouldn’t take much of a shift – even just a mild hawkish shift by one or two FOMC “dots” – for the central bank’s median expectation to shift from the current 75 basis points of 2024 cuts to just 50 or even 25 basis points.
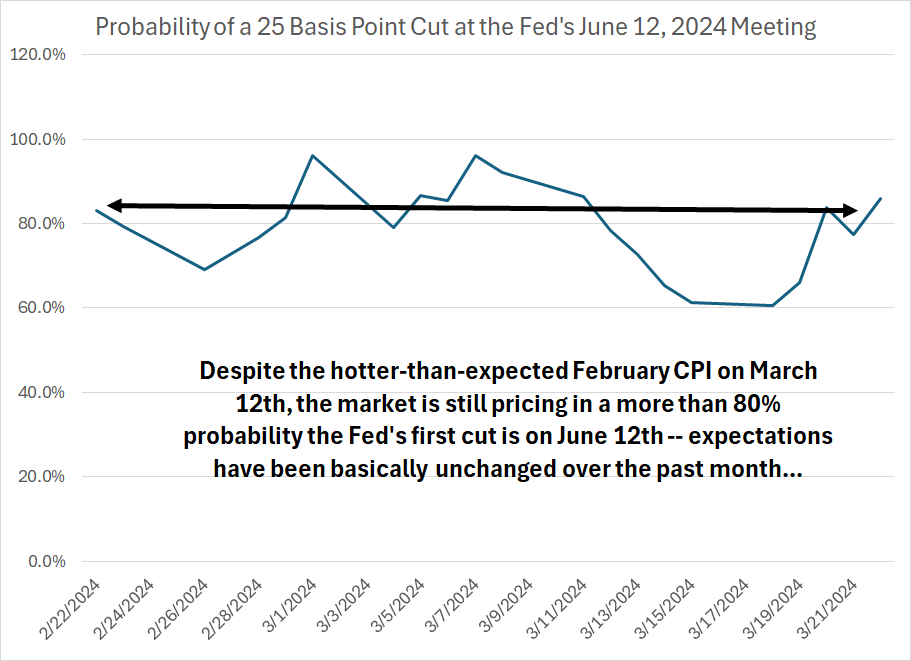
Regardless, it never really matters how the dot plot shifts, only how the market reacts to that shift, and we don’t have to worry about a new dot plot until the Fed’s meeting scheduled for June 12th. And, for now, the equity and fixed income markets continue to take the glass-half-full view:
Source: Bloomberg
Indeed, markets continue to act as though a June Fed cut is a done deal – the Fed Funds futures now imply 85.8% probability the Federal Reserve cuts interest rates by 25 basis points in June, up (albeit slightly) from an 83.1% chance of a June cut expected a little over one month ago on February 22nd.
Market expectations for rate cuts through the end of next January remain similarly unchanged – a month ago, Fed Funds futures were pricing in 3 full cuts and 78% probability of a 4th 25 basis point move by January 29, 2025. Today, markets are still fully pricing in 3 cuts and 84% probability of a fourth in the same time frame.
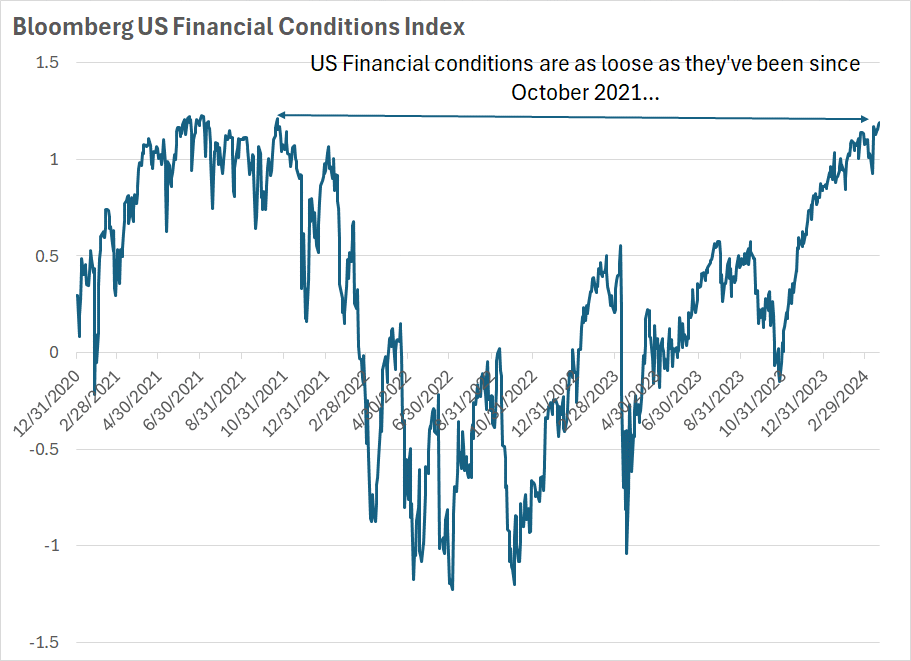
Meanwhile the market remains awash in liquidity and credit conditions are easing:
Source: Bloomberg
The Bloomberg US Financial Conditions Index is designed to rise when credit conditions loosen; I’ve plotted this index since the end of 2020. As you can see, credit conditions began to tighten towards the end of 2021 and became tight (negative value on the index) in early 2022.
That, of course, corresponded to a major sell-off in equity markets.
However, apart from a brief mini credit crunch in the spring of last year – the regional bank mini-crash – credit conditions gradually eased throughout 2023, undoubtedly one of the factors that drove the rally last year. Today, despite all the Federal Reserve’s hikes, almost two years of quantitative tightening and a slight hawkish tilt for 2024 rate expectations in the dot plot, US financial conditions are as easy as they were in late 2021.
That’s before the Fed hiked rates and even before the Fed stopped quantitative easing.
There are two broad implications in my view.
First, with credit conditions easy, the US government still providing fiscal stimulus, bank reserves still plentiful and the Fed pivot still (apparently) broadly on track despite hot inflation, it’s tough to justify an outright bearish outlook for the broader market.
Second, what has changed is market leadership – since the end of January, the S&P 500 Energy and S&P 500 Materials Indices are the two top-performing groups in the index, up 12.2% and 11.5% respectively compared to an 8.1% gain in the S&P 500.
Meanwhile, the S&P 500 Information Technology and Consumer Discretionary Indices rank 5th and 6th out of 11 economic sector indices – two of last year’s biggest leaders are decidedly mid-pack over the past (nearly) two months.
As I’ve been writing for some time now, this underlying sector rotation is consistent with a market increasingly worried about stubborn-high inflation and, perhaps, concerned that the Fed will start cutting rates too soon, exacerbating the problem.
The San Francisco Federal Reserve divides components of personal Consumption Expenditures (PCE) inflation into two parts – cyclical inflation, consisting of components with sensitivity to Fed policy, and acyclical inflation that’s largely beyond the Fed’s control:

Source: Bloomberg; San Francisco Federal Reserve
More specifically, the uncomfortable truth of the matter is that central banks bring down inflation by engineering recessions or, at a minimum, an economic slowdown. That’s because when the economic cycle weakens, demand for most goods and services falls. And when demand for something drops, assuming the supply side of the equation is unchanged, prices should see downward pressure.
So, cyclical components of PCE – markets sensitive to the health of the economic cycle – are those the Fed influences more directly. And, as you can see in my chart above – cyclical components of PCE are still running hot even as inflation components beyond the Fed’s control have moderated over the past 12 to 18 months.
So, it’s tough to describe the Fed’s work as “done” – by this measure most of the disinflation witnessed since the middle of 2022 has little or nothing to do with tighter central bank policy.
The strategy here remains largely unchanged – I’m not expecting an imminent market crash though I continue to see scope for a broader market pullback and correction this spring led by some erstwhile high-flyers like tech and consumer discretionary.
The bigger and more powerful trend has been, and is likely to remain, relative performance – rotation from sector-to-sector and between different markets around the world.
So, with these points in mind, here’s what I’m recommending this week:
Actions to Take
Keep reading with a 7-day free trial
Subscribe to The Free Market Speculator to keep reading this post and get 7 days of free access to the full post archives.