

Oil's Well
Oil's Well
There's no new shale glut on the horizon

Wednesday’s Fed meeting, and Jerome Powell’s press conference that followed, put the sword to the higher-for-longer interest rate narrative that’s dominated global markets since last summer.
In particular, Powell made it clear the FOMC is at the beginning of discussions on policy easing, and the Fed’s updated summary of economic projections shows the median of expectations for the Federal Funds Rate at 4.6% by the end of 2024 compared to 5.1% when the central bank released its Summary of Economic Projections back in September.
Through the end of December I’m offering 90-day free trials to the paid tier of The Free Market Speculator, which includes our model portfolio recommendations and special subscriber-only content and alerts.
Try the paid tier of The Free Market Speculator for the next 90 days, and if it’s not for you, for any reason whatsoever, simply cancel before your trial is up and you won’t be charged for the service.
This special Christmas offer is available ONLY through this link:
These projections compare to a current Fed Funds target range of 5.25% to 5.50%; the Fed effectively is looking for three 25 basis point cuts by the end of next year.
Here's how the Fed Funds market has responded:
Source: Bloomberg
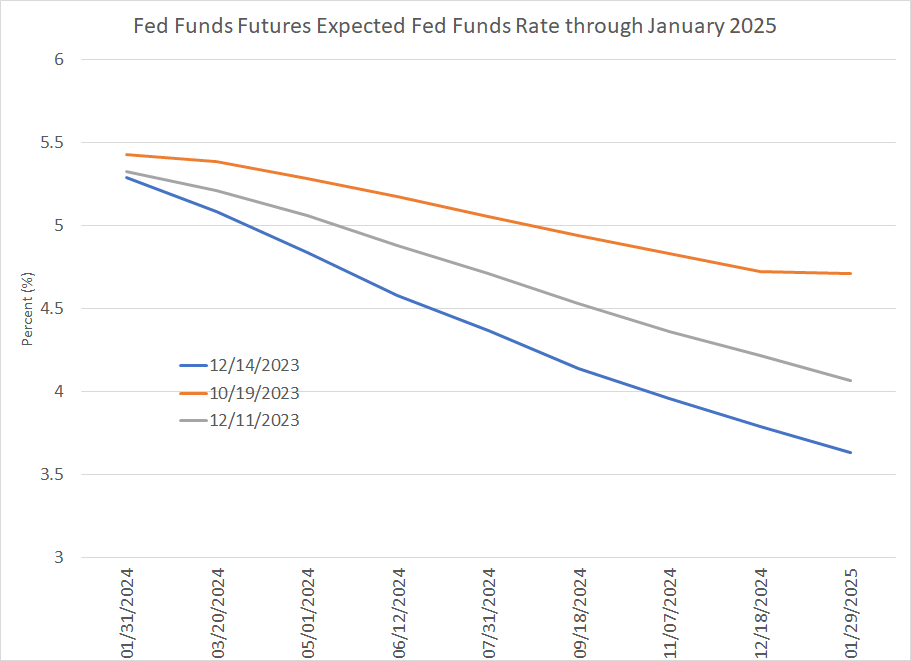
This chart shows market expectations for the Fed Funds rate following every central bank meeting through January 29, 2025 on three different dates – October 19th (the ’23 peak for 10-Year Treasury yields), December 11th (Monday this week) and today (December 15, 2023).
As you can see, at the peak of the “higher for longer” narrative on October 19th the market was pricing in near 40% probability of at least one more rate hike and a Fed funds rate of 4.71% by late January 2025.
On Monday this week, Fed Funds futures saw the Fed cutting rates starting at its May 2024 meeting and pushing rates to around 4.065% by late January 2025.
And this morning, the market saw 99.5% probability the Fed cuts rates 25 basis points at its March 20, 2024 meeting and has priced in a 3.62% Fed Funds rate by late January 2025 – that’s almost 175 basis points worth of cuts in just over a year based on the current effective Fed Funds rate near 5.35%.
All these changes in less than two months.
If you needed a reminder market narratives about stocks, interest rates, inflation and the health of the economy can change at near light speed these days, this is it.
As readers know, I never embraced the higher-for-longer craze that gripped markets back in October; in fact, in the October 26th issue “Bull Steepening, Bear Steepening and Recession,” I wrote the spike higher in yields (sell-off in bond prices) likely marked at least a short-to-intermediate term low.
Truth be told, on November 14th, “Forget the Fed, It’s the Economy,” when I wrote 10-Year Treasury yields could return to their early 2023 range of 3.30% to 4.00% (the yield at the time was about 4.45%) I never expected that to happen before the end of 2023.
The more important point in the longer term is I suspect the recent plunge in yields is not good news for markets or the economy.
I wrote about the bizarre drop in the unemployment rate in the November employment report from BLS in my piece earlier this week “Another Bizarre Jobs Number” and I covered signs of consumer weakness evidenced in retail giant Walmart’s (NYSE: WMT) latest quarterly report in late November “Don’t Forget the Micro Tells.”
Simply put, I suspect the Fed will cut rates in 2024 and bonds will rally, but the driver of policy easing next year will be growing evidence the US economy is slipping into recession rather than Goldilocks and a painless disinflation trend.
Indeed, the Fed seems to have nodded in that general direction, in the most subtle way possible, in this week’s Summary of Economic Projections – expected US real economic growth for 2024 was trimmed by 0.1% to 1.4%, below the Fed’s longer-term estimate for the trend of real economic growth at 1.8%.
I want to make one point crystal clear – NONE of this is an issue to worry about for 2023.
My view has been, and remains, positive seasonality can support the broader stock market into January 2024 and, consistent with historical norms, we’re likely to see a continued rotation in favor of laggard groups in coming weeks including small-cap stocks and more cyclical, value groups outside the Magnificent 7 and technology.
Further, as I explained in my December 5th piece “Stealth Easing and Bank Reserves,” the current conduct of fiscal and monetary policy in the US is more accommodative than the consensus believes.
In particular, US bank reserves continue to grow as money market funds have shifted more than $1.4 trillion out of the Fed’s Reverse Repurchase (RRP) facility and into Treasury Bills (T-Bills) since the end of May this year alone:
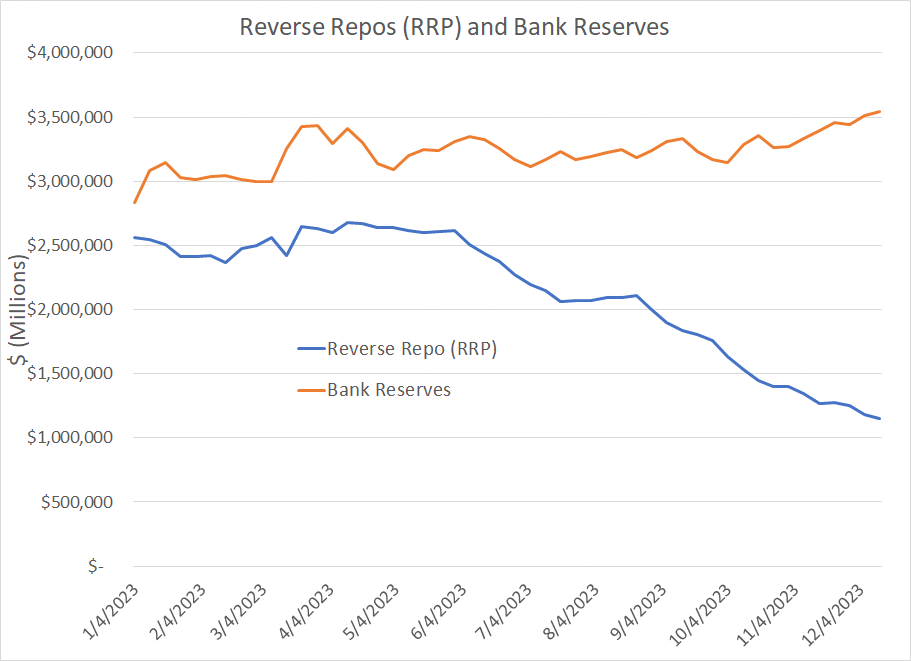
Source: Bloomberg, Federal Reserve
This situation remains a tailwind for stocks that could persist until the RRP is exhausted, likely by Q2 2024, and the money needed to fund the Treasury’s immense deficits are likely to come out of commercial bank deposits (and bank reserves).
There is, however, one asset that doesn’t fit with this short-to-intermediate term market narrative: Crude oil.
Take a look:
Source: Bloomberg
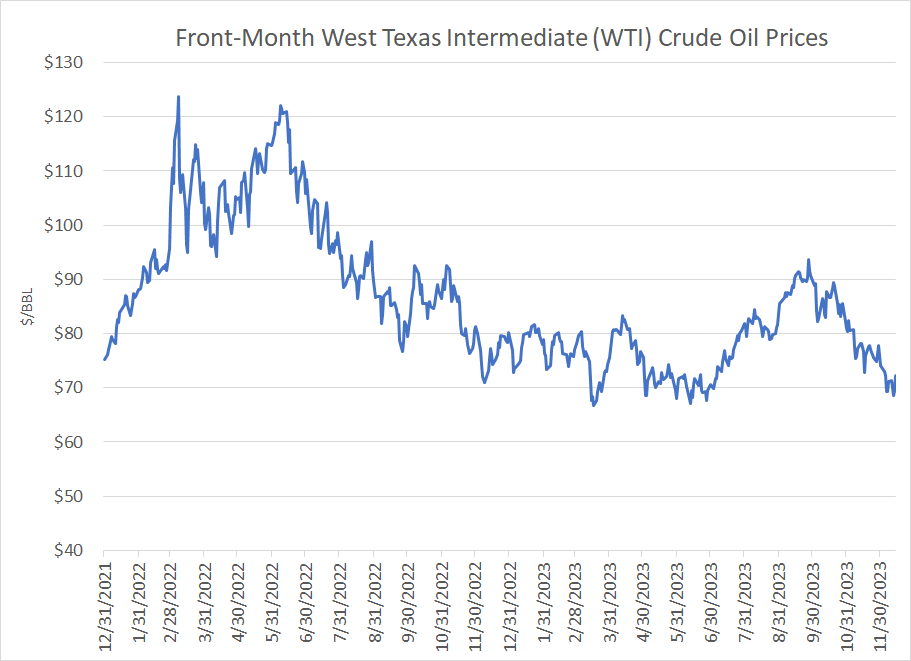
This chart shows the front-month price of West Texas Intermediate (WTI) crude oil since the end of 2021.
As you can see, oil prices recently slipped below $70/bbl, retesting summertime lows in the high $60’s per barrel, down from a late-September peak in the mid-$90s.
There are really only two forces that can move oil and other commodity markets – supply and demand – and oil bears have cited both sides of that equation as a rationale for the weakness in crude.
Let’s start with demand.
In a recession, US and global oil demand will tend to fall, or growth will falter, at least temporarily. I continue to believe the US economy is headed for a hard landing; however, currently, that view is decidedly outside the consensus on Wall Street.
Simply put, either the stock market is right, or the crude oil bears are right – it can’t be both.
The rally in the broader market since mid-November has been led by more cyclical and economy-sensitive groups – the S&P 500 is up 5.24% compared to a 7.64% gain for the cyclical Russell 1000 Value Index and a whopping 11.33% surge in the Russell 2000 index of small caps.
This divergence has intensified so far this month with the Magnificent 7 up just 1.6% compared to a 4.8% gain in Russell 1000 Value and a 10.7% gain in the Russell 2000.
The stock market is screaming soft-landing while embracing a more dovish Fed, and if that’s the case, US and global oil demand are likely to at least hold up reasonably well into early 2024.
Certainly, while there was some weakening in US products supplied data – a proxy for demand – earlier this fall, there’s no evidence of a cliff in demand you’d expect to see when recession is imminent.
Here’s a look at motor gasoline demand:

Source: Bloomberg
I can certainly see some weakness in oil demand relative to seasonal norms in September. However, in recent weeks demand appears to have recovered to more normal levels.
I suspect at least some of that late summer demand weakness was a function of rising gasoline prices – in September, AAA reports average regular unleaded gasoline prices in the US were around $3.90/gallon, the highest in nearly a year. In contrast, gasoline prices fell below $3.50/gallon at the end of October and are now nearer $3.10/gallon. As prices have declined, demand seems to have improved.
At a minimum, I certainly don’t see anything on this chart to justify a decline in oil prices from over $90/bbl to under $70/bbl.
The International Energy Agency (IEA) projects global oil demand will rise 2.3 million bbl/day in 2023 and 1.1 million bbl/day in 2024, reaching 102.8 million bbl/day next year. The IEA has revised lower their estimate for total demand in 2023 from 101.9 in their October 2023 release to 101.7 million/bbl day in December, but their outlook for demand of 102.8 million bbl/day in 2024 is unchanged because they’ve bumped up their estimate for 2024 demand growth over the past two months.
Couple these estimates with the fact IEA has a long history of underestimating demand growth, I don’t see anything in these revisions that could justify the decline we’ve seen in prices.
There’s No New Shale Boom
I suspect the bigger driver of the recent slide in oil is a concern about the supply side of the equation and the risk that growth in US shale production could lead to a glut next year. Market memories of the shale boom years, and the late 2014 collapse in oil as Saudi Arabia and OPEC gave up on supply cuts, still haunt oil traders to this day.
However, the oil bears’ excess shale production argument suffers from two major flaws in my view.
First, there’s this:
Source: Bloomberg, EIA
Every Wednesday, the Energy Information Administration (EIA), part of the US Department of Energy, releases its weekly Petroleum Status Report, which estimates the amount of oil held in storage (inventories), the amount of oil produced domestically, imports, exports, and demand for various refined products.
The key word here is “estimates” because these weekly numbers are all based on independent surveys EIA conducts as well as US Customs data on oil and refined products trade.
EIA also provides a more accurate monthly release covering the same basic data. This series is released with a two-month lag; for example, the most recent estimates were published at the end of November, covering data for September 2023.
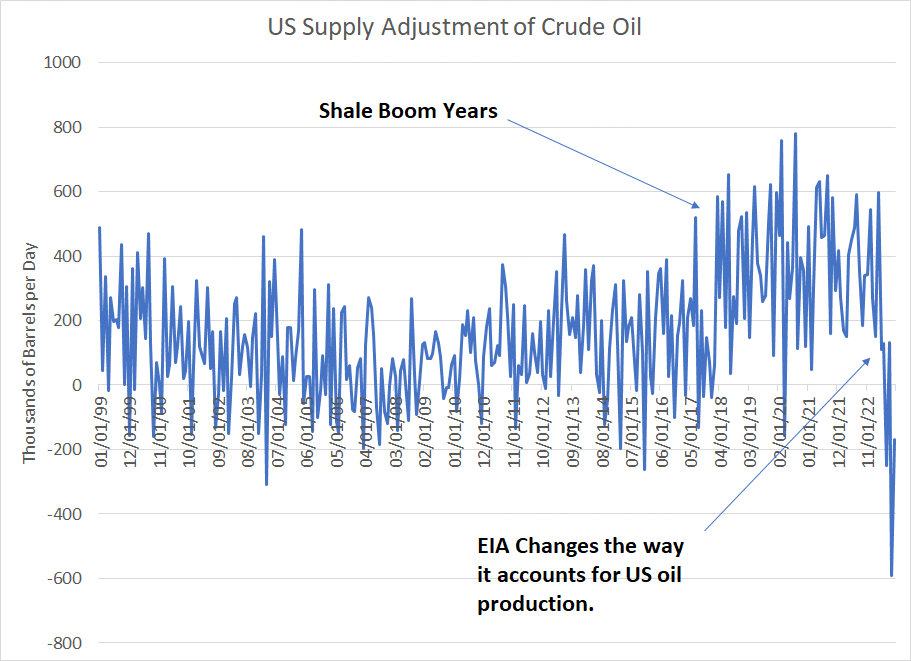
As part of both its weekly and monthly series, EIA includes a “petroleum supply adjustment” figure, which is essentially an error term. In other words, when the agency’s estimates of oil production, inventories, demand and trade don’t fully balance, EIA uses this adjustment to force the nation’s petroleum balance sheet to behave.
There’s nothing sinister about the adjustment term -- the US petroleum market is both vast and complex, so it would be shocking, and strain credulity, if all EIA’s numbers added up perfectly each week.
Ideally, this error term would average near zero over time. In other words, perhaps EIA overestimates some supply figures in one month, resulting in a negative adjustment factor while underestimating supply in the next month resulting in a positive adjustment.
If there’s no consistent bias in the data – either consistent positive or consistent negative adjustments – it follows EIA data provides a broadly accurate picture of US petroleum markets.
The chart above shows the adjustment factor included as part of the monthly series from EIA. As you can see, starting in roughly 2016-17, the EIA adjustment factors started to exhibit a clear positive bias, suggesting there was some underlying problem with the EIA’s data or estimation methodology.
To its credit, EIA recognized this problem and has been taking steps to revise its methodology and correct the issue.
Basically, the US oil market can be expressed in the following equation:
Supply = Demand + Change in Inventories
In other words, if supply is greater than demand over time you should see a rise in oil held in storage and if demand exceeds supply, inventories should drop to fill the gap.
The next level of detail would then be:
Domestic Production + Imports + Adjustment = Crude Used in Refineries + Exports + Change in Inventories
So, if the adjustment factor is positive, the other two items on the left-hand side of the equal side are too low – EIA is underestimating supply relative to demand.
EIA identified early on a couple of potential culprits to account for this consistently positive adjustment factor. One is that some natural gas liquids (NGLs) produced in the US like natural gasoline are blended with crude oil and then exported as crude.
This effectively adds to US oil supply but doesn’t show up as crude oil production. So, EIA has started adding a column to their reports showing transfers to crude oil supply – they began with the monthly reports over the summer and have added a similar column to their weekly tables starting in November.
EIA’s has one more adjustment planned for its Petroleum Supply Monthly dataset that’s scheduled to be finalized by March of next year.
Take another look at the chart of the monthly adjustment factor above and you’ll notice the EIA’s first adjustments to their data series appears to have solved the consistently positive adjustment factor that plagued reports starting in 2016/17.
However, there now appears to be a (smaller) problem in the opposite direction – a series of consistent negative adjustment factors indicating EIA is overestimating supply or underestimating demand.
The key point to note is that EIA has not made these changes retroactively, so their data from the past few months does not directly correlate to the data the agency published a year ago. That means some of the sizable year-over-year US production growth figures you see repeated in the mainstream and financial media are a chimera. This “growth” represents paper production adjustments to EIA data rather than a real change in output on the ground.
Bottom line: Positive adjustment factors a year ago suggest US oil production was higher than what EIA reported. Similarly negative adjustment factors in recent months suggest EIA is overestimating US oil production right now. When you compare too high numbers today with too low numbers a year ago, you end up with an inflated picture of US oil production trends.
While it’s likely US oil production has been growing, the rate of production increases is skewed higher by EIA’s recent adjustments to its monthly releases and it pales in comparison to the level of growth US shale delivered back in 2013-14, leading to Saudi/OPEC efforts to floor the market with crude. Saudi Arabia, with an unparalleled bird’s eye view of the global industry can see these trends and is unlikely to react to the “paper” glut in oil production in the same way they did to a real oversupply 9 years ago.
The M&A Boom
The second point relates to the wave of merger and acquisition (M&A) activity we’ve seen over the past several months headlined by two mega-deals: Exxon Mobil’s (NYSE: XOM) acquisition of Pioneer Natural Resources (NYSE: PXD) and Chevron’s (NYSE: CVX) deal to buy Hess (NYSE: HES).
While these two megadeals attracted a fair amount of investor attention, what flies under the radar for most is myriad smaller deals to acquire private operators in the Permian Basin, America’s most important shale field.
Take a look:
Source: Bloomberg
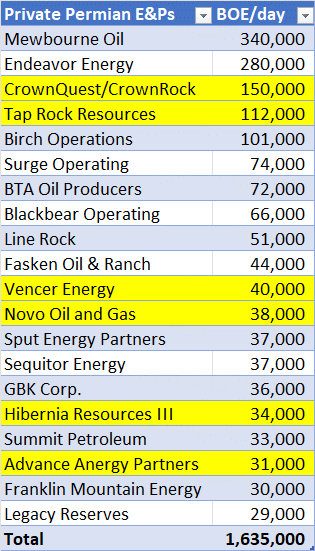
This table lays out the 20 largest privately held producers in the Permian Basin and Bloomberg estimates for their production in barrels of oil equivalent per day (BOE/day). As you can see, these operators may not be traded on NYSE, but they are also not small fry – in total these 20 operators produce more than 1.6 million BOE/day with the top 5 alone contributing almost 1 million BOE/day.
The six operators I’ve highlighted in yellow are all private producers that have been acquired this year or have recently received offers to be acquired. The latest on this list to announce a deal is CrownRock, which received a $10.8 billion acquisition offer from Occidental Resources (NYSE: OXY) on December 11th that’s expected to be completed by the end of Q1 2024.
CrownRock’s assets are primarily in the Midland Basin, the portion of the Permian located further east in Texas that tends to produce higher oil and liquids output than wells located further to the west in the Delaware Basin of the Permian.
Here's a map from Bloomberg to help visualize the Occidental-CrownRock deal:
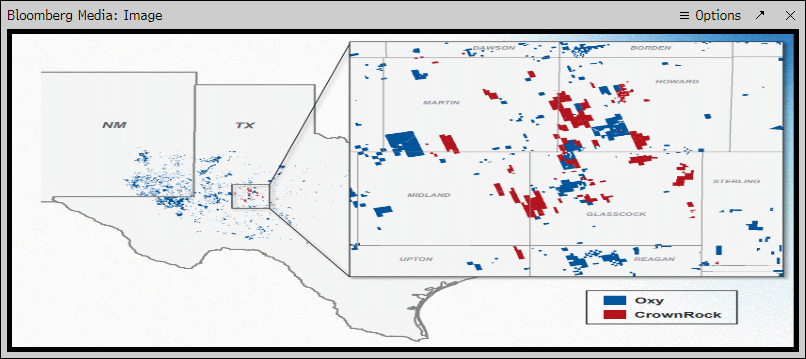
Source: Bloomberg, Company reports
Historically, OXY has had more concentrated exposure to the Delaware portion of the Permian (west Texas and New Mexico) though it holds significant acreage in the Midland, so this deal fills a significant gap in their portfolio.
From an industry perspective, what’s more important is that purchase price of $10.8 billion.
You see, private producers are generally valued on two fundamentals – flowing barrels (a value based on the amount of oil/gas they’re producing) and a valuation based on the acreage they control.
In this case, CrownRock controls about 92,000 net acres and 150,000 BOE/day of production, so that translates roughly to a valuation of $47,250 per flowing BOE and $40,000 per net acre. Valuations on both metrics are considered attractive and represent a scarcity premium for Permian acreage and production.
Simply put, while the Permian is one of the largest and most impressive oilfields discovered anywhere in the world, there are still only a limited number of prolific premium drilling locations than generate free cash flow even with oil prices in the $60/bbl range or above.
Private operators looking to attract a big takeover offer from publicly traded peers – virtually all smaller producers fit in this camp -- can window-dress their valuations by ramping up drilling activity and production just ahead of a sale. By growing production just ahead of a deal, private operators generate a higher valuation based on the production portion of their valuation.
In short, to the extent there is real oil production growth out of the Permian this year, it’s mainly a function of output from private operators, not the large publicly traded E&Ps, which have been cutting their capital spending and focusing on cash flow generation.
After an acquisition is complete, however, financial motivations are different.
The acquiring firm generally justifies deals of this nature through cost-cutting, shared use of midstream infrastructure like pipelines, and slowing drilling/completion activity to maximize free cash flow. After all, the reason a company like OXY acquires a company like CrownRock is resource access – they’re looking to add premium drilling locations in the Permian to extend the reserve life of their most productive acreage.
Halliburton (NYSE: NYSE: HAL) is one of the largest oil services companies in the world and derives around 45% to 50% of revenues from North America. In particular, HAL is a major provider of key services like hydraulic fracturing, mission-critical to producing oil and natural gas from shale fields like the Permian.
In Halliburton’s most recent quarterly conference call back in October, management had this to say:
Look, I think it’s going to be, unique to different, and certainly to different operators, and levels of efficiency, and many other things. Look, I think that, we’ll know a lot more as we go into next year, and start to see where production levels are. Clearly this year saw, a lot of broad activity, by a lot of operators early in the year. And I suspect North America is getting the benefit of that right now.
There was a strong, the private market was super busy the first year, part of the year, 2023. You saw that group not really drill wells as we got into the late summer, which is the time they normally would. And so, I think that will weigh on probably production as we go into 2024. That said, we’ve got a commodity market that is probably quite supportive. And so, it’d be hard to imagine less, not more. But in terms of production going into 2024, it would seem that, a big chunk of what was added in ‘23 is not repeating right now, which could weigh on production. That said, as I’ve said before, I think we’ll see activity up, not down from here for those reasons.
Source: Halliburton Q3 2023 Results and Conference Call October 24, 2023
This quote represents the answer to an analyst’s question regarding the level of drilling and completion activity in US shale, and whether it’s at a level that supports growth in production into 2024.
The passage I’ve highlighted in boldface type suggests private operators – NOT the publicly traded E&Ps – led drilling and completion activity in the first half of the year; Halliburton described this group as “super busy.” However, the company also noted their activity ground to a halt in late summer, a time of year when this group normally accelerates activity.
As you might expect, production follows activity with a lag – increased drilling and completion activity in the current quarter likely leads to production growth in the ensuing 1 to 2 quarters. So, to the extent that US shale output is increasing right now, that’s likely the result of strong activity, particularly from private operators, in the first half of 2023.
The decline in activity over the summer will start to show up in 2024, weighing on production into the first half of next year. The company does not see the private- operator-led surge in activity repeating next year.
This is all consistent with what you’d expect from a group of private companies looking to maximize output ahead of a well-telegraphed and anticipated pick-up in mergers & acquisitions (M&A) activity.
Longer term, the recent energy M&A boom reflects the maturity of the Permian shale resource, which has dramatic implications for long-term US oil production growth. Just consider the Permian Basin accounted for less than 20% of US oil output as recently as 2015, ballooning to almost 50% earlier this year – in many ways, the Permian is US shale oil production.
Companies like Exxon Mobil and Occidental paid unprecedented sums to acquire operators like Pioneer and CrownRock because, after many years of operating in this field, they realize there’s only a finite number of premium low-cost drilling locations remaining in the field.
The Permian is massive, but finite – M&A is a direct consequence of maturity.
Further, large operators like Exxon Mobil typically seek to scale up their position in a particular play and attain a plateau of production they can sustain for a period of many years, generating consistent free cash flow over time. The current M&A boom suggests the Permian is likely to reach a final production plateau over the next 1-2 years with a small number of operators controlling the best acreage and seeking to sustain production at a level that translates to strong free cash flow at moderate oil prices around $80/bbl.
While the market frets about near-term growth in output, I believe the bigger issue for the next 1-2 years will be a peak/plateau in Permian production. Since the Permian is arguably the single most visible and obvious source of non-OPEC production growth that’s a bullish development for global oil prices.
One more ingredient to the constructive outlook for oil and energy stocks right now:
Source: Bloomberg
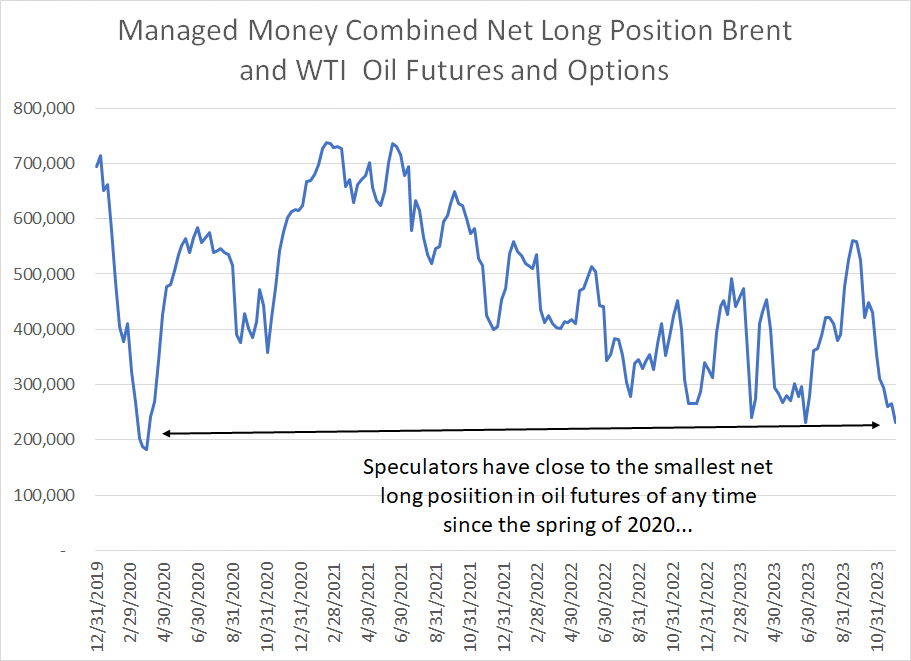
This chart shows managed money (hedge funds and speculator) net long positions in WTI and Brent oil futures markets. As you can see, speculators are about as bearish oil today as they were at the selling climax amid COVID lockdowns in 2020.
This data series from the weekly Commitment of Traders report is best used as a contrarian indicator – the time to look for a low in oil prices is when speculators are already bearish on oil and vice versa.
When you combine a bearish speculative position in oil futures with the bears’ questionable fundamental rationales – particularly the widely misrepresented and misunderstood data on US oil production – and an absolute support level for WTI in the high $60s and Brent in the low-$70s, I see the ingredients in place for a significant rally in oil prices into 2024.
With those points in mind, I’m recommending several adjustments to the model portfolio today including a new buy recommendation and a handful of sales:
Keep reading with a 7-day free trial
Subscribe to The Free Market Speculator to keep reading this post and get 7 days of free access to the full post archives.