

Santa Claus and the Dip-Buyers
Santa Claus and the Dip-Buyers
Signs point to a year-end rally

Yes, there is a Santa Claus.
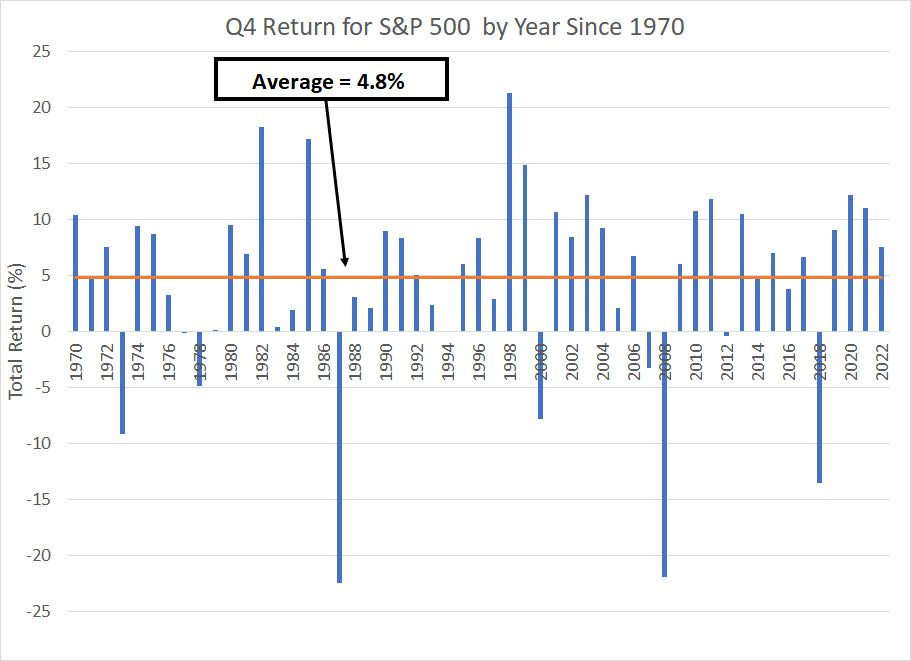
Since 1970, the stock market has rallied in the fourth quarter more than 81% of the time for an average gain of 4.8% including dividends:
Source: Bloomberg
There are a few nasty exceptions over the past half century -- the market plummeted 22.5% in the final three months of 1987, 21.9% in the final quarter of 2008 and 13.5% in Q4 2018. However, if you’re looking for a major fourth quarter sell-off you’re betting against the tide of history.
I’m always suspicious of market calls based purely on simplistic analysis of seasonal patterns; yet, at a minimum, the history of fourth quarter market returns over the past 50+ years should give the benefit of any doubts to the bulls.
No other quarter of the year can boast similarly powerful tailwinds:
Source: Bloomberg
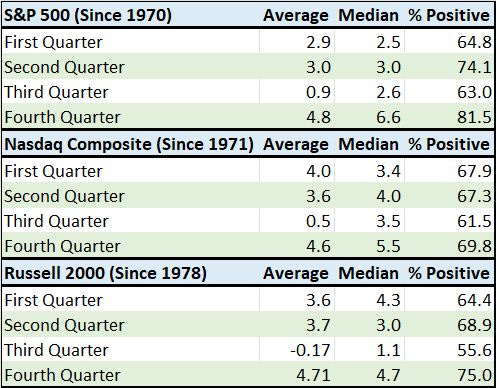
This table presents the average and median return for three major indices – the S&P 500, Nasdaq Composite and Russell 2000 (small caps) – since the 1970s broken down by quarter. I’ve also included a column that shows the percentage of all positive fourth quarters for each index.
Note the third quarter (ended September 30th) is the worst quarter of the year for all three indices both in terms of average returns and the percentage of years showing a positive return. Indeed, for the small-cap Russell 2000, Q3 has a negative average return based on data since 1978.
However, the worst quarter of every year for all three averages is followed by the best quarter -- again, whether you look at average returns, median returns, or the percentage of years that see a positive return, the fourth quarter is seasonally the best in every category.
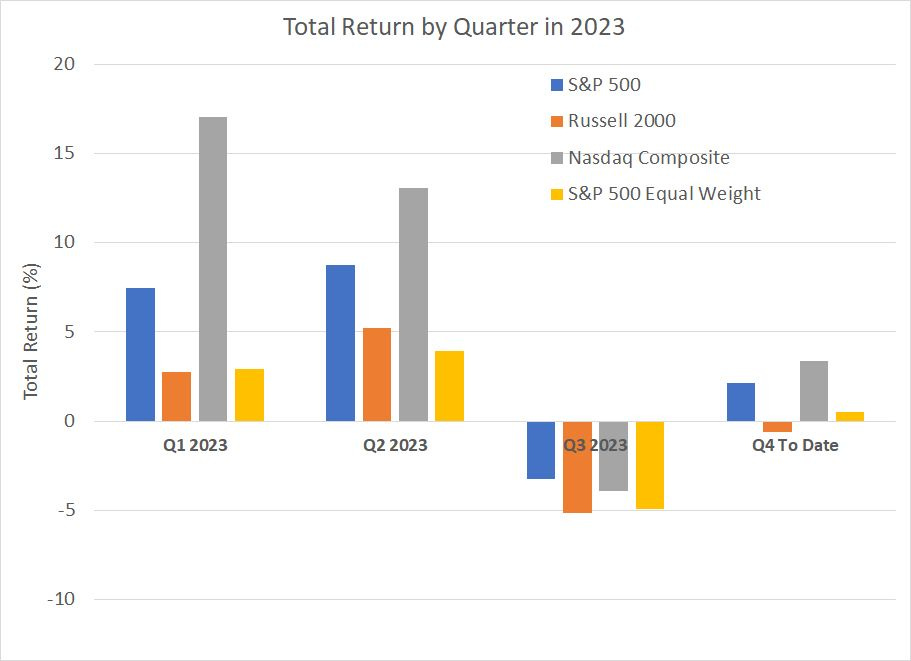
When we look at 2023 through that prism, it resembles a classic seasonal set-up for a year end rally:
Source: Bloomberg
Strength for all four indices in my chart in the first half of this year gave way to significant weakness in Q3. While the fourth quarter is less than two weeks old, we’re already seeing signs of a rebound in all three indices save the small-cap Russell 2000.
If history is any guide, there’s more upside to come for stocks this quarter.
Further, I could find little correlation between the S&P 500’s performance in the first 9 months of the year and Q4 returns. Since 1970, the S&P 500 returned more than 10% through the first 9 months of the year in 24 years; in 21 of those years, the S&P 500 also produced a positive gain in Q4 (87.5% of the time) with an average Q4 gain of 4.0% and a median of 6.0%.
So, the Q4 return phenomenon doesn’t appear to be a question of the market bouncing back from weak returns in the first three quarters of this year – the S&P 500’s 13.1% gain through the first 9 months of 2023 shouldn’t diminish the prospects for a Q4 rally.
Bottom line: I continue to have intermediate to longer-term concerns regarding the economic outlook and the prospect for stocks to produce strong long-term returns from current elevated valuations. However, probabilities support a Q4 2023 rally for the S&P 500 and it’s never a good idea to fight the tide.
In this issue I’m recommending some adjustments to the model portfolio including a new recommendation with significant, underappreciated exposure to some of the hottest trends in technology right now including cloud computing and artificial intelligence (AI).
Before I dive into the specifics of recommendations I’m making this week, it’s worth noting there are other reasons beyond simple seasonality to retain a bullish short-term bias on stocks.
They’re Buying “Bad” News
I’ve spilled a good deal of digital ink on the bond market in recent months, including in my September 28th piece, “About those Bonds,” where I outlined a constructive intermediate to long-term case for buying select fixed income exchange-traded funds (ETFs).
When it comes to equity markets, one of the most common explanations for the August-September stock market correction has been the surge in bond yields since June. The 10-year Treasury yield spiked from 3.60% at the beginning of June 2023 to a peak of around 4.8% on a closing basis on October 6th (last Friday). Similarly, the yield on 30-Year Treasuries jumped 115 basis points to near 5% over a similar holding period
Meanwhile, Fed Funds futures continue to mark down the probability of an aggressive Fed “pivot” and cutting cycle in 2024:
Source: Bloomberg
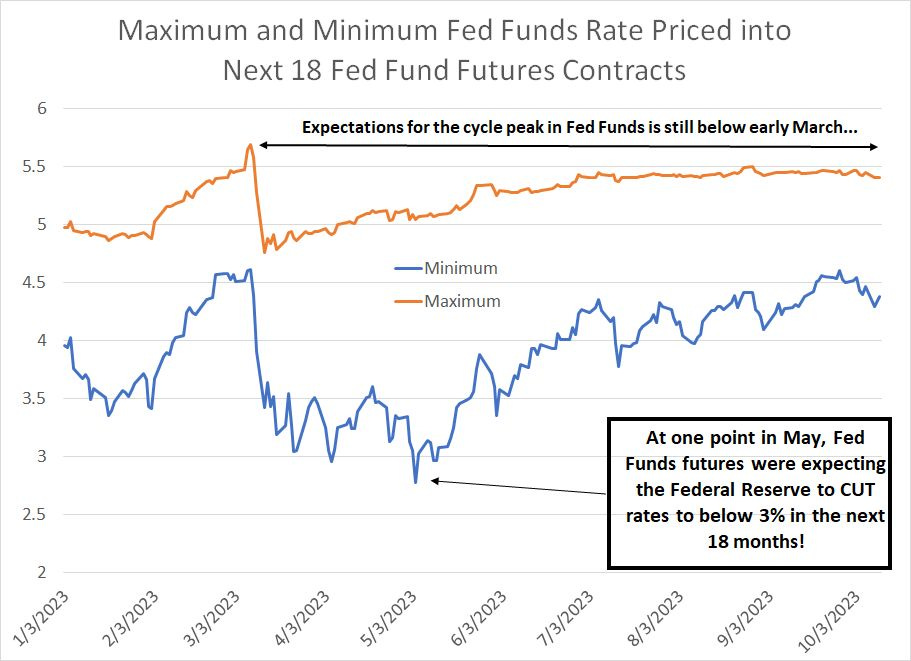
To create this chart, I looked at Fed Fund futures over the next 18 months to determine the maximum and minimum Fed Funds rate anticipated by markets over this time.
Early this year markets were fascinated with the question of how high the central bank might push short-term interest rates.
Expectations on that front peaked back in early March, just before the collapse of SVB Financial, parent of Silicon Valley Bank, and the start of the spring mini- crisis in regional banks. At the highs, markets saw prospects for the Fed to hike all the way to 5.75% or so before taking a pause on rates.
Today, with the upper bound of the Fed Funds target at 5.50% and the effective rate at 5.33%, Fed Funds futures appear to confirm the Fed is “done” for the current cycle. The orange line in my chart above, representing the peak of the current Fed cycle, has been flat as a proverbial pancake since July and remains well below that late-February, early-March peak.
That’s because the market’s obsession has moved from determining the exact peak of the rate cycle in favor of a different issue -- grappling with when the Fed might start cutting interest rates again and how low rates might go longer term. The blue line in my chart above shows the market action since June has been all about the prospects for future rate cuts, not the peak rate of the cycle.
At one point in May, futures were pricing in a low for Fed Funds under 3% over the next 18 months, compared to around 4.5% at the peak in recent days.
That, in a nutshell, represents the higher for longer view on rates that’s been powering the big surge in longer-term Treasury yields, and bear steepening of the yield curve, where long-term Treasury yields rise faster than shorter-term yields.
Against this backdrop, you’d expect strong economic data, or signs of buoyant inflation, to represent a significant headwind for both equities and bonds (bearish for prices, bullish for yields).
However, that’s just not been the case:
Source: Bloomberg
Long-time readers know I have my doubts about the utility of the monthly payrolls report from the Bureau of Labor Statistics (BLS) due, in part, to large subsequent revisions of the data. To make matters worse, the government historically undertakes the largest revisions to this data series at key economic turning points; this has the effect of making the economy appear stronger than it is near the top of the cycle and weaker near the lows of a recession.
However, there’s no doubt markets react to BLS data – some of the wildest trading action in both stocks and bonds you’ll see each month comes on the first Friday of each month when BLS releases its monthly Employment Situation Report at 8:30 AM Eastern Time.
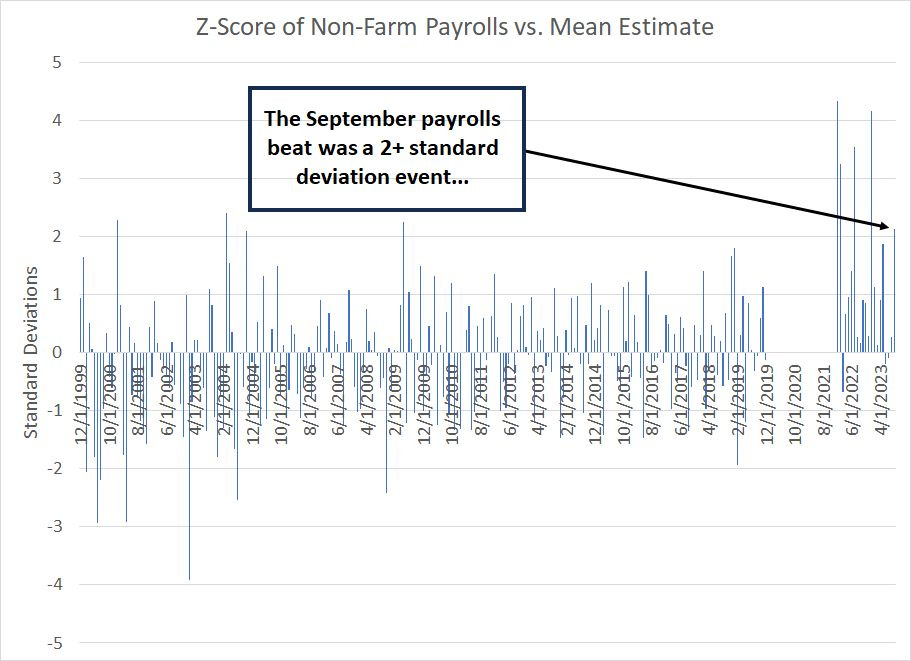
The chart above shows the Z-score of the initial payrolls release compared to the median consensus expectations from economists before the release – positive numbers indicate payrolls well above consensus and negative numbers the opposite. I’ve excluded all reports from 2020 and 2021; due to COVID-related distortions, monthly employment numbers were prone to historic volatility in that era.
The September Employment Report was a full 2.14 standard deviations above economists’ estimates based on data since 1999. Further, BLS revised the last two months of payrolls data higher by 119,000 jobs.
There’s plenty within the release -- such as the ongoing decline in economy-sensitive temporary employment -- that casts doubt on the strength of the US labor market and the veracity of that headline payrolls number.
However, brass tacks: The September Employment report was (very) strong and, in a vacuum, one would expect Treasury yields to rise as the market prices in tighter Fed policy, and for stocks to get hit hard due to equity markets’ ongoing preoccupation with the “higher for longer” narrative.
On top of that, let’s add two more datapoints to the list – the Producer Price Index (PPI) report on Wednesday this week and the Consumer Price Index (CPI) data release Thursday morning – both series were hotter than expected.
The headline CPI release came in at 0.4% month-over-month, above the 0.3% expected. Moreover, while core CPI – excluding food and energy prices – was up 0.3% month-over-month, in line with expectations, the actual, unrounded figure was 0.323%.
Since the government rounds sequential CPI changes to the nearest 0.1%, an unrounded release of 0.275% would be reported as 0.3% as would a 0.34% release, so an unrounded release of 0.323% is a “hot” 0.3%.
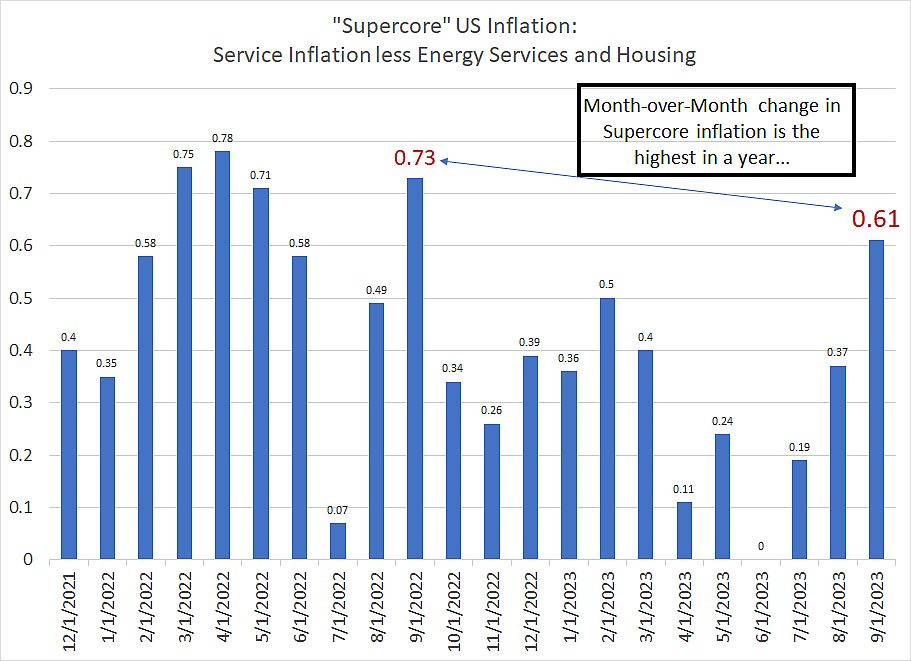
A quick look inside the CPI report shows further troubling trends in some of the Fed’s more closely watched inflation categories:
Source: Bloomberg
I’m not a believer in adjusting monthly inflation figures in this manner; after all, if you remove enough components from CPI every month, you can derive just about any conclusion about the path of prices in the US you might wish.
Nonetheless, we do know some FOMC members follow measures like Supercore inflation closely and, in this case, the news is even worse than the headlines–inflation surged 0.61% in September, its largest sequential gain in a year.
That sequential increase annualizes to a whopping 7.6%.
However, as always, it’s not the news that’s important, it’s the market’s reaction to the news.
After all, if the stock market rallies when confronted with a strong jobs number and a brace of hot inflation reports that suggests investors are already pricing in a higher-for-longer rate environment. And, if stocks first gap lower on the news and then rally, it suggests at least some investors are sitting on the sidelines with idle cash looking for an opportunity to buy.
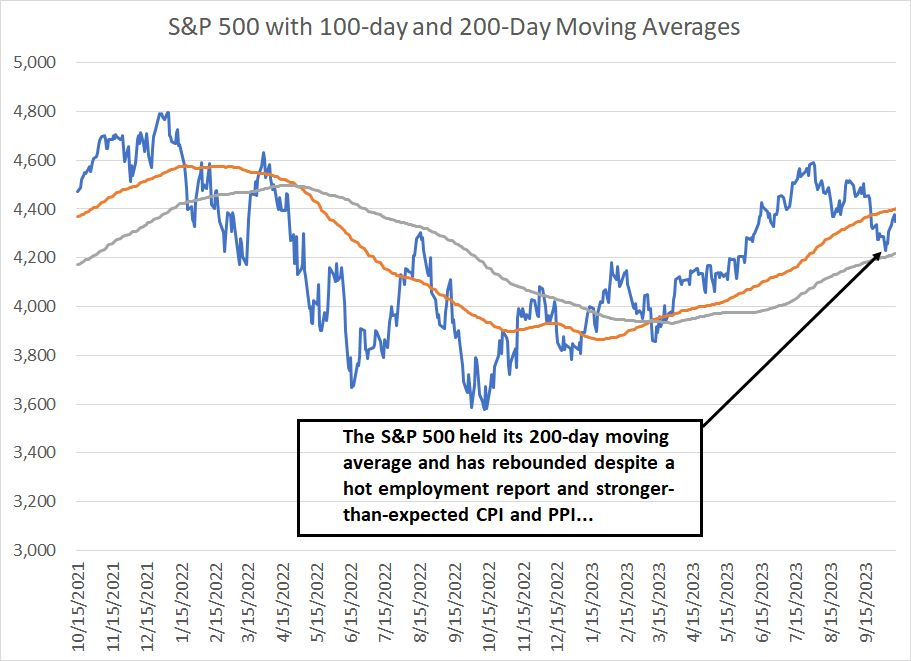
In this case, stocks have remained buoyant despite the hot employment number and higher-than-expected inflation:
Source: Bloomberg
The S&P 500 pulled back to retest its 200-day moving average in the seasonally weak months of August and September. However, that average held, and the market has rallied about 2.2% since the close on Thursday October 5th despite the strong jobs number and hot inflation data. The Nasdaq 100 fared even better, jumping more than 3% in a similar period.
Granted, the pattern in bonds has been more chop and less trend than for equities. However, the yields on the 10-Year and 30-year Treasury have each dropped some 20 basis points from last Friday’s closing peak. And that’s despite all the strong economic news and yesterday’s weak auction of 30-Year Treasury bonds.
In short, we have bearish news for both stocks and bonds; yet, investors just aren’t reacting to that news and appear to be using dips in equities as a buying opportunity. That’s short-term bullish.
Tightening and the Pause
If you’re looking for a fundamental rationale behind the stock market’s buy-the-dip fascination, it’s growing evidence the Fed sees risk of overtightening.
Over the past week, a handful of Fed speakers have noted the recent surge in long-term Treasury yields is tightening financial conditions in the US and may be obviating the need for additional hikes. This is essentially a hat tip to the chart I posted earlier on in this issue showing the peak expected Fed Funds rate over the next 18 months and the cycle low over the same period.
Earlier this year, despite the most aggressive tightening cycle since the 1980’s, market participants remained convinced a pivot – and a major rate-cutting cycle – was just around the corner. This is likely a vestige of the prolonged period of low interest rates, below-target inflation and a cautious Fed that prevailed following the 2007-09 Great Recession and financial crisis. Put less charitably, it’s investors’ “Pavlov’s Dog” reaction to the central bank – for the past 15 years, the Fed has acted quickly at the first sign of economic or market turmoil, bailing out the stock market.
In effect, this bias in favor of a fast pivot on rates blunted the impact of the Fed’s tightening, because longer-term yields, such as the yield on 10-year and 30-year Treasuries, remained relatively low compared to soaring short-term interest rates.
With traders abandoning the quick, definitive pivot narrative in favor of higher-for-longer rates, the yields on longer term Treasuries have (finally) responded, soaring to the highest levels since 2007, immediately ahead of the global financial crisis of that era. This has clearly started to tighten US financial conditions:

Source: Bloomberg
This chart shows the Goldman Sachs US Financial Conditions Index – a rising index suggests tightening financial conditions and vice versa.
As you can see, financial conditions on this basis reached a cycle peak in October 2022 and then eased significantly into early July 2023 despite continued rate hikes from the Fed. Only over the past 3 months has the index started to tighten notably again.
While the effect isn’t immediate, it’s clear a spike here should ultimately act to slow US economic growth; recent comments from FOMC members, and the text of the Fed’s September meeting released yesterday, all suggest the Fed may be willing to take a pause to see how this recent bout of tightening impacts the economy.
I continue to watch the weekly Fed release showing the state of bank reserves:
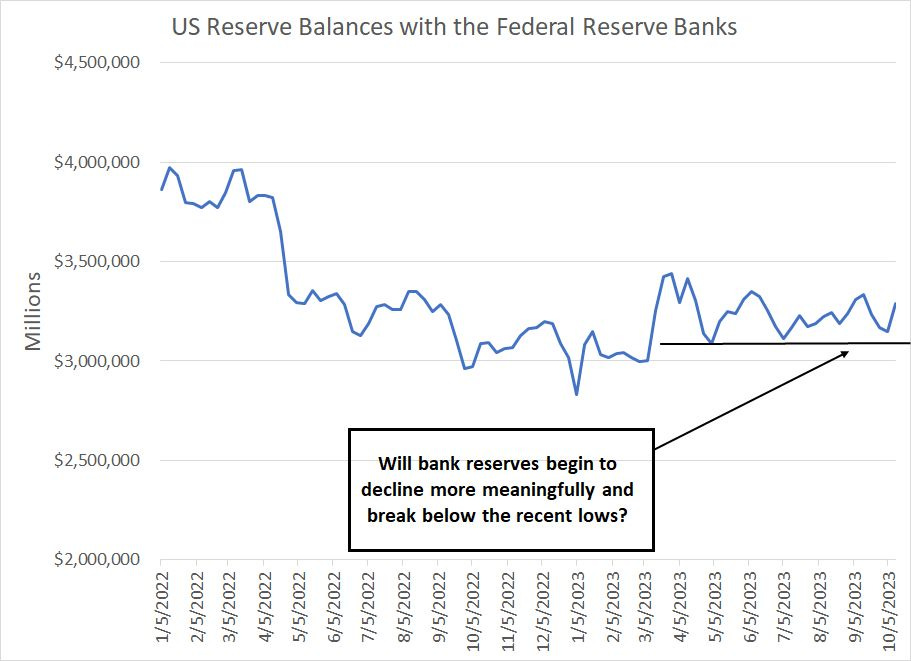
Source: Bloomberg
Since the March regional banking mess, bank reserve balances held at the Fed have remained buoyant at levels above $3 trillion. Should reserves begin to break down more meaningfully, it would be a strong indication the Fed’s quantitative tightening policy is beginning to bite.
Just remember this:
Historically, it’s not the Fed hiking interest rates that brings the most violent meltdown phase of a bear market, it’s the tipping point for the economy.
In my view, the bear market that started in early 2022 is not yet complete. Ultimately, I still expect a US recession and, if history is any guide, market sentiment towards the economy could shift from “Goldilocks” to recession in the blink of an eye, just as it did in late 2000 and the autumn of 2007.
For now, however, the bulls remain in charge, seasonal trends favor more upside and market response to recent hawkish economic news looks benign – the tide is still rising.
With these points in mind, I’m adding a new recommendation to the model portfolio and booking gains on a long-held ETF recommendation:
Keep reading with a 7-day free trial
Subscribe to The Free Market Speculator to keep reading this post and get 7 days of free access to the full post archives.