

The Golden Rules
The Golden Rules
Two key trends that could send gold to $3,000 per ounce

The price of gold recently topped $2,000 per ounce on an intraday basis.
That’s up about 25% from the late September lows near $1,615 and it’s close to all-time highs at $2,075.
The last time gold prices broke out from a basing pattern was mid-2019, when the yellow metal shot up about 50% from $1,375 to $2,075 in the space of just over one year and I wouldn’t be surprised to see a move of similar magnitude over the next 12 to 24 months if we take out those highs:
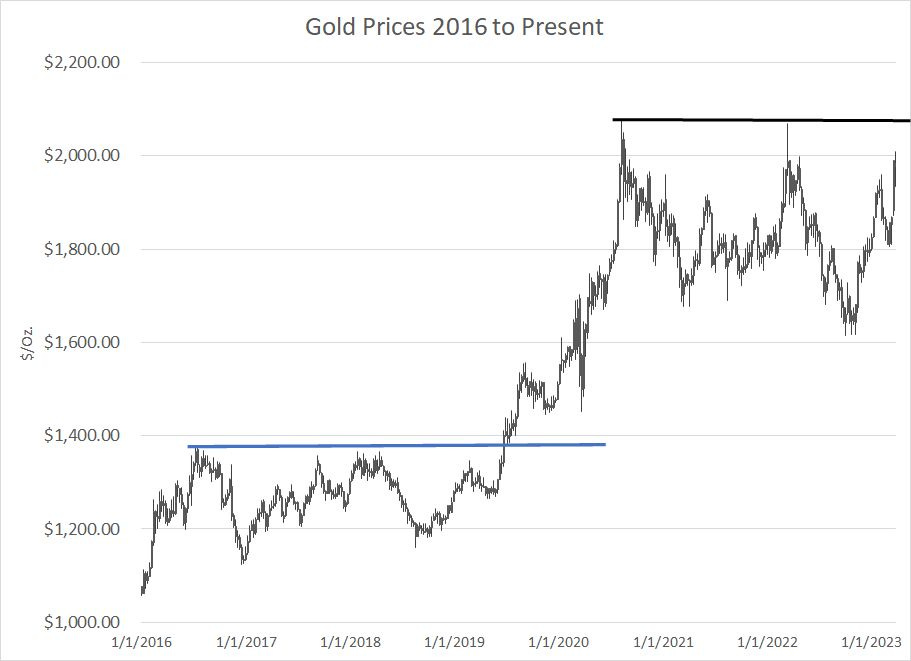
Source: Bloomberg
I’ve written about gold before including in the June 13, 2022 issue of The Free Market Speculator “The Long and Short of Gold,” where I outline a simple two-variable model I use to monitor this market. Given the number of questions I’m receiving from readers, it’s high time we review that model and what it’s telling us about the fundamentals for the gold market.
First up:
What Drives Gold Prices?
Two key factors that drive gold prices are real interest rates and the US dollar.
Unlike equities or bonds, gold doesn’t pay dividends or interest. That means there’s an opportunity cost to holding the metal – when you buy gold, you’re giving up the opportunity to earn dividends or interest in stocks and bonds respectively.
So, when rates and yields are high, that opportunity cost is more punitive, and holding gold is less attractive – in other words, gold prices tend to be inversely correlated to real (inflation-adjusted) interest rates such that rising rates are negative for gold and falling rates bullish.
And then there’s the dollar. Since gold is traded in US dollars, when the dollar weakens against other currencies like the euro and yen that tends to be bullish for gold.
I’ve created a simple model to explain the five-week percentage change in gold prices using the contemporaneous five week change in yields on 5-Year Treasury Inflation-Protected Securities (TIPs), a proxy for the level of real rates, and 5-week changes in the US Dollar Index (DXY):
I created this model using historical data from August 1997 through to the end of 2020 and here’s the regression output from Excel:
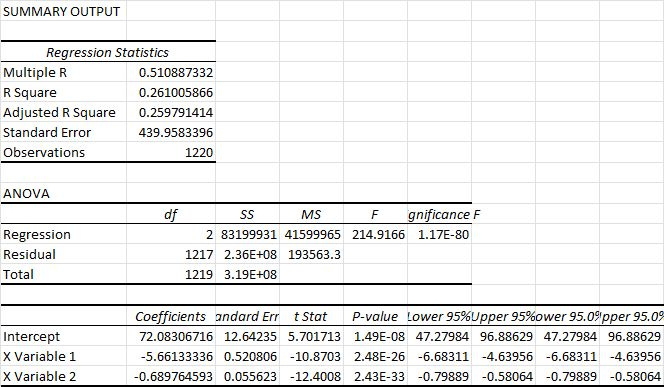
Source: Bloomberg, Excel
The first thing to note is that the R-Squared value is roughly 0.26, meaning this two-variable model only explains about 26% of 5-week changes in gold prices over this period.
Simply put, there’s more, a LOT more, that moves gold prices other than real rates and the US Dollar Index. However, while an R-squared of 26% might seem low in absolute terms, models created using economic and financial market data typically yield relatively low R-squared values. An R-squared value of 26% suggests this model has significant value in outlining the factors that drive prices.
The model, outlined in the Excel Output above, is as follows:
5-Wk Change in Gold = 72.08 + (-5.661 * 5-Wk Change in Real Rates) + (-0.6898 * 5-wk change in DXY)
Note: All Changes are measured in basis points where 1% = 100 basis points.
So, let’s use this equation to model out-of-sample 5-week changes in gold prices since the end of 2020:
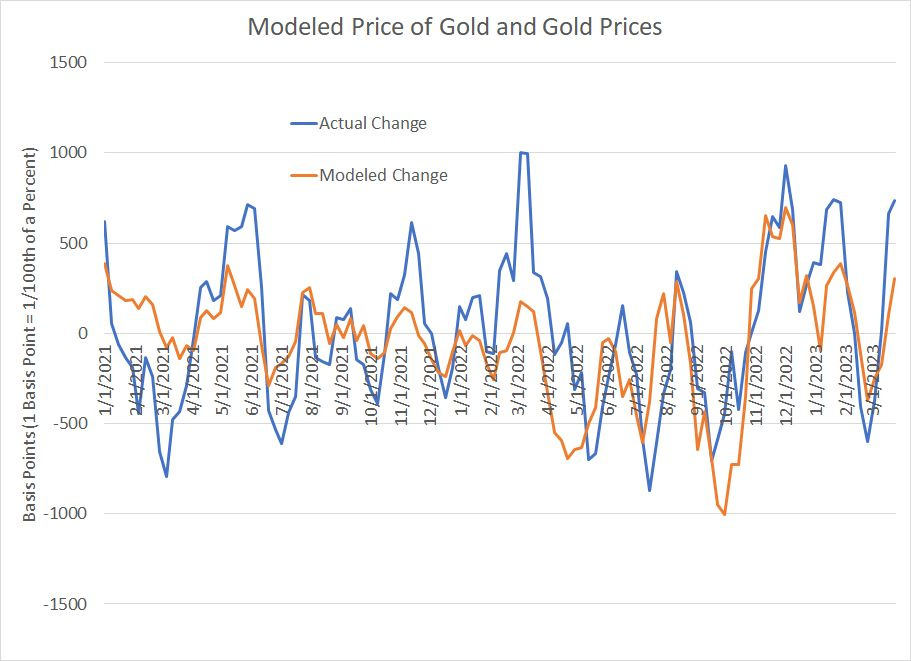
Source: Bloomberg
A quick glance here shows the magnitude of swings in the 5-week change in gold prices (blue line) is much larger than what this model (orange line) would predict.
That said, the model is broadly correct in calling direction – when the model suggests gold prices should rise or fall, they usually do. And you can also see that when gold overshoots the model’s expectations – such as in mid-2021 and March 2022 – it often subsequently corrects in the opposite direction.
Over the past 5 weeks both real interest rates and the US Dollar Index have declined; if I plug the numbers into the model above, it suggests we should have seen a 3.63% increase in gold prices.
The actual rise in gold over the past 5 weeks is about 7.88%, so gold has risen as the model has projected, though the magnitude of the rally appears somewhat overdone.
That suggests there’s room for a correction in gold prices near-term, but the more important issue isn’t what’s happened over the past 5 weeks, but the likely path of real interest rates and the US dollar in coming weeks.
Let’s start with rates:
Stagflation and Real Rates
In the March 16th issue of The Free Market Speculator, I explained why I’m looking for stagflation through the 2020s, much like the 1970s.
One key piece of this is the “Stop-Go” economic policies of that era. Simply put, after a period of excess fiscal and monetary accommodation in the late 60s and early 70’s, inflation began to rise.
The Federal Reserve did make several attempts to quell inflation in the 70’s. Perhaps the most dramatic was a series of rate hikes and a deeply inverted yield curve in 1973-74, which led to the most vicious US recession since the 1930s from 1973 to 1975.
However, ultimately, the Fed relented in the face of an increasingly painful economic contraction and loosened policy too early in late 1974. While that did lead to economic recovery, it also reignited inflation which reached new heights in 1980. In effect, the Fed flipped from fighting inflation to supporting economic growth several times from the late 60s through the 70’s, leading to short business cycles and increasingly entrenched inflation.
The government didn’t start issuing Treasury Inflation-Protected Securities (TIPS) until the 1990s, so we can’t chart the yield on 5-Year TIPS – the input for my gold model – from this stagflation era.
However, look at this chart:
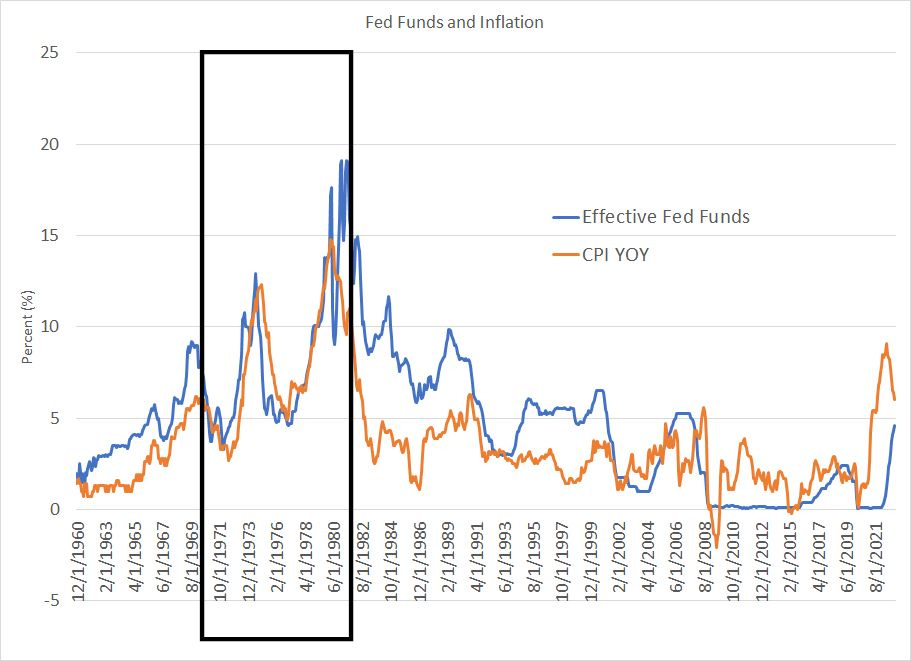
Source: Bloomberg
This chart shows the effective Fed Funds Rate (blue line) and the year-over-year headline inflation rate (orange series) since the end of 1960.
As you can see, for much of the 70s – the boxed area on my chart – the Fed Funds Rate was at or even below the inflation rate. In other words, real (inflation-adjusted) interest rates were near zero or negative. Real rates weren’t consistently positive again until the 1980s, when inflation started to retreat.
Now look at the hard right edge this chart and you’ll see the inflation rate has generally been above the Fed Funds rate since the Great Financial Crisis of 2007-09. Meanwhile, despite all the tough talk from the Fed over the past year and the talk of “high” interest rates in the financial media, the real Fed Funds rate is still negative.
Meanwhile, check out this chart:
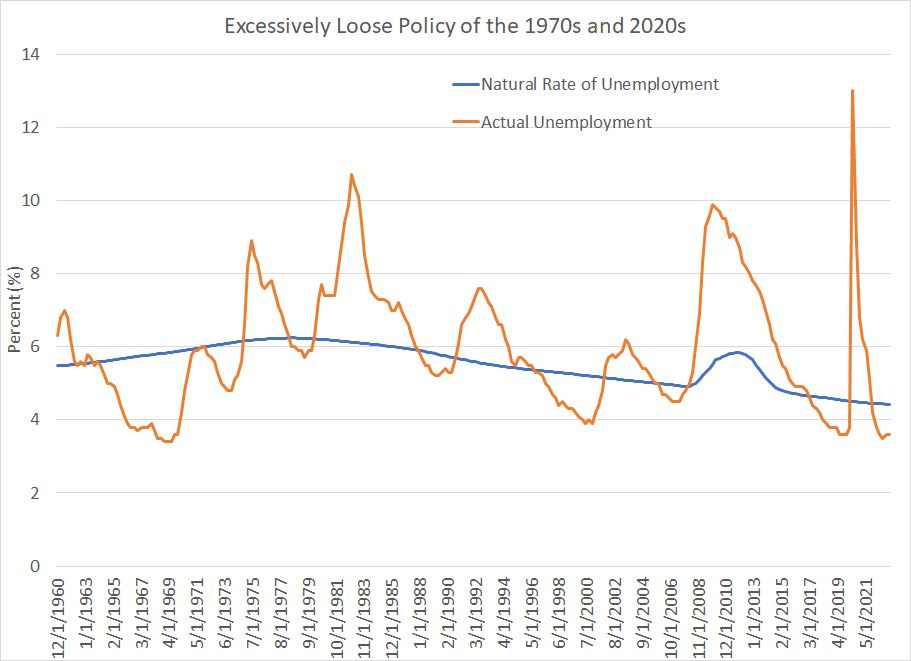
Source: Bloomberg
This chart shows the unemployment rate (orange line) compared to the natural rate of unemployment estimated by the Congressional Budget Office (CBO).
Granted, this is something of an “Old School” economics concept that’s fallen out of favor in the low-rates, low-inflation and low-unemployment era of the past 20 years.
However, the concept is that if unemployment is too low you will see upward pressure on wages as employers compete to attract a dwindling supply of labor. Wage inflation often feeds on itself since rising wages boost costs for companies, which respond by raising prices. Rising prices in turn reduce the purchasing power of money, resulting in ever greater wage demands.
The natural rate of unemployment – sometimes called the Non-Accelerating Inflation Rate of Unemployment (NAIRU) – is the level of unemployment consistent with stable inflation. If Unemployment drops below NAIRU, inflation will accelerate.
Of course, it’s impossible to know what NAIRU is at any moment in time and we can’t know if current CBO estimates are accurate. However, I suspect CBO estimates of 70’s era inflation, constructed with the benefit of hindsight, are closer to the truth than real-time estimates made by the Fed at the time.
And, as you can see, from the mid-1960s to the mid-1970s unemployment was below NAIRU, consistent with the experience of that time of a steady rise in inflationary pressures. Eventually, it took a sustained rise in unemployment well above NAIRU for inflationary pressures to abate.
The second point to note is at the hard right edge of my chart. As you can see, the CBO currently estimates NAIRU at about 4.4% compared to an actual unemployment rate of 3.6% right now. In other words, if the CBO estimate of NAIRU is even close to correct, the labor market will have to weaken significantly for inflation to glide back down to target and it’s tough to see that happening without a recession.
In addition, the Fed’s Summary of Economic Projections from the March 22, 2023 meeting shows the unemployment rate rising to about 4.5% this year and 4.6% in 2024, only a few tenths above NAIRU.
Yet, despite that paltry rise in unemployment, core PCE inflation is expected to recede to 3.6% this year, 2.6% in 2024 and 2.1% in 2025. That seems like pure fantasy – it took serious recessions in the 70s and 80’s, and a spike in unemployment several percentage points above NAIRU, to bring down inflation even temporarily.
In addition, the Fed has been talking tough on inflation for about a year now, but the labor market remains strong and the economy isn’t in recession yet, so the central bank hasn’t really faced much of a pain test. Indeed, the first real sign of stress was the banking crisis in recent weeks, which prompted Powell to quickly back off on increasingly hawkish rhetoric made mere hours before the Silicon Valley Bank collapse.
Do you really think the Fed has the fortitude to sit on its hands and maintain positive real rates as the economy enters recession and unemployment rises significantly?
In effect, the US government and Fed have already repeated the mistakes of the late 1960s and early 1970s -- too much fiscal and monetary accommodation ignited a surge in inflation over the past 3 years just as it did 50 years ago.
I find it hard to believe they won’t now repeat the mistakes of the 1970s by loosening policy too soon and by too much to truly forestall entrenched inflation.
On top of that, as I’ve written here previously, some sources of inflation can’t be quelled through higher interest rates. For example, the lack of investment in traditional energy projects – new sources of oil and natural gas supply – is likely to result in a persistent shortage of commodities. It will take years of investment, and new sources of supply, to bring down prices longer term.
Bottom line: Short-term gyrations aside, I’m looking for real interest rates in the US to remain low in coming years due to a combination of persistently high inflation and the Fed and federal government’s desire to ease policy and stimulate growth when the economy sours.
Low-and-or-falling real rates are a positive for gold prices.
The US Dollar
The US Dollar Index tracks the value of the US currency against a basket of foreign currencies including the euro (57.6% weight), the Japanese yen (13.6% weight), British pound (11.9% weight) and the Canadian dollar (9.1% weight).
As you can see, the index touched the highest levels since 2001 last autumn:
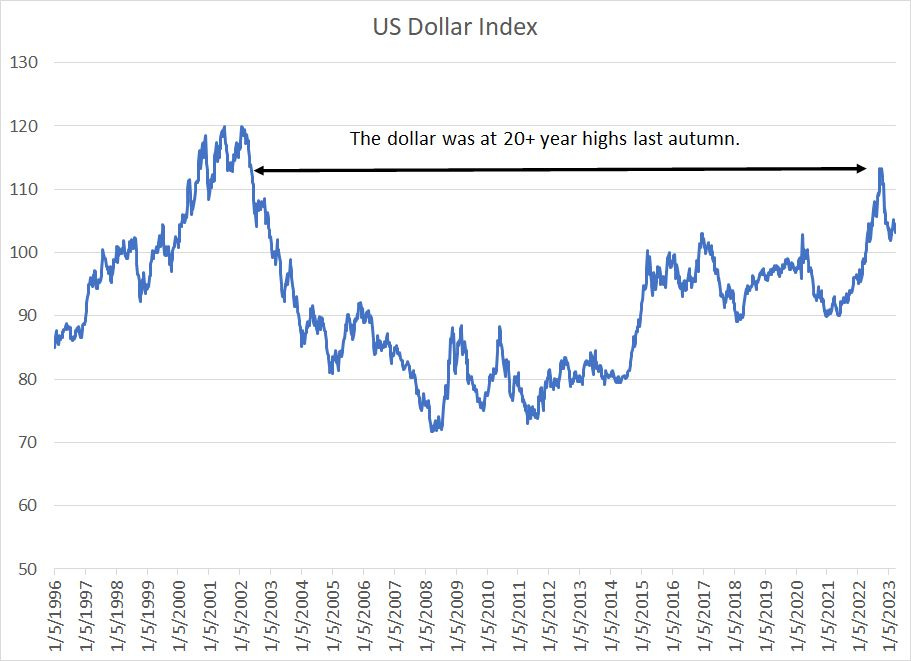
Source: Bloomberg
Of course, the main driver of the dollar’s strength was the perception the Federal Reserve was the most aggressive major central bank in terms of tightening policy.
After all, the European Central Bank (ECB) didn’t start hiking rates until July 2022 and the current main refinancing rate is set at 3.5% compared to 5% for Fed Funds.
The second-most weighted currency in the Dollar Index is the Japanese yen and the Bank of Japan has been running the easiest monetary policy of any major central bank.
In 2013, the BOJ introduced yield curve control, a policy of buying bonds to maintain longer term interest rates near zero. Previously, the BOJ capped 10-Year Japanese Government bond yields at 0.25%; in December of last year the BOJ tweaked the policy to allow rates to rise as high as 0.50%.
However, now that script is starting to flip.
Just before the regional banking crisis this month, the market was pricing in a peak Fed funds rate of close to 5.7% and there was some talk a Fed Funds rate near 6% would be needed to bring down inflation.
Today, the market believes the Fed is likely finished hiking for this cycle – there’s only a 46.5% chance priced in Fed Funds futures for a 25 basis point hike in early May. Meanwhile, there’s growing speculation the Fed is likely to cut rates at least once by the time of its September 20, 2023 meeting; Fed Funds are looking for a benchmark rate of just 4.16% by January 31, 2024, implying 75 to 100 basis points of cuts by year-end.
In April Japan will have a new central bank governor and there’s growing speculation the BOJ will soon adjust its policy of peak accommodation. Most recently, annual wage negotiations with Japan’s main labor unions resulted in major employers agreeing to an overall wage hike this year of 3.8% with base pay up 2.33%.
Those are the largest wage increases agreed in three decades and well above consensus estimates for an overall pay rise of less than 3%. Wage growth north of 3% is a necessary condition for Japan to exit its extraordinary monetary easing measures, ending yield curve control.
Bottom line: The Fed no longer appears to be a hawkish standout as it did last September and the Dollar Index has started to weaken accordingly.
In the near-term, I wouldn’t be surprised to see gold pull back and consolidate recent gains as it appears to have outpaced underlying fundamentals. However, looking out past the next few weeks, an emerging “stop-go” policy environment in the US, persistently high inflation and a weakening dollar are all powerful tailwinds for gold.
Look for prices at significant new all-time highs later this year.
DISCLAIMER: This article is not investment advice and represents the opinions of its author, Elliott Gue. The Free Market Speculator is NOT a securities broker/dealer or an investment advisor. You are responsible for your own investment decisions. All information contained in our newsletters and posts should be independently verified with the companies mentioned, and readers should always conduct their own research and due diligence and consider obtaining professional advice before making any investment decision.