

Warning: Happy New Year!
Warning: Happy New Year!
Pullbacks are likely though they may mark buying opportunities

Santa Claus was particularly generous last year.
As I outlined in my October 13th post, Santa Claus and the Dip-Buyers, the fourth quarter is the strongest of the year for the stock market, and 2023 looked to be setting up for a classic end-of-year rally.
However, returns for both the S&P 500 and small-cap Russell 2000 were stronger than anything I anticipated. The S&P 500 soared 14.1% in the final two months of 2023 and the Russell 2000 was up a whopping 22.4%. Except for the 15.2% gain in 2020, that’s the best final two-month return for the S&P since at least 1970.
From a trading perspective, here’s a fact to put in the seasonality tidbit file.
Since 1970, the S&P 500 has produced an average total return of 3.71% in the final two months of the year and there have been 10 years (excluding 2023) where the index has produced a gain of 7.5% or greater (roughly twice the average).
The average gain for every January since 1971 is just shy of 1.4%. However, following the 10 years where the S&P 500 has rallied more than 7.5% in the final two months of the year, the average gain in January is just 0.19%, well below average.
Two additional points to note about this January pullback effect.
First, it doesn’t apply to the Russell 2000 (small caps). In fact, based on data since 1980, the Russell 2000 tends to perform a bit better than average in January following a strong two-month finish to the prior year.
Second, the effect is short-term at best. In fact, in years where the S&P 500 rallies more than 7.5% in the final two months of the year, the index goes on to return an average of almost 6.1% in the first quarter of the following year. That’s better than double the average return of 3.02% in every Q1 since 1970.
So, that points to elevated probability of at least something of a pullback for the broader market this month, especially if you consider just how overbought the stock market is right now:
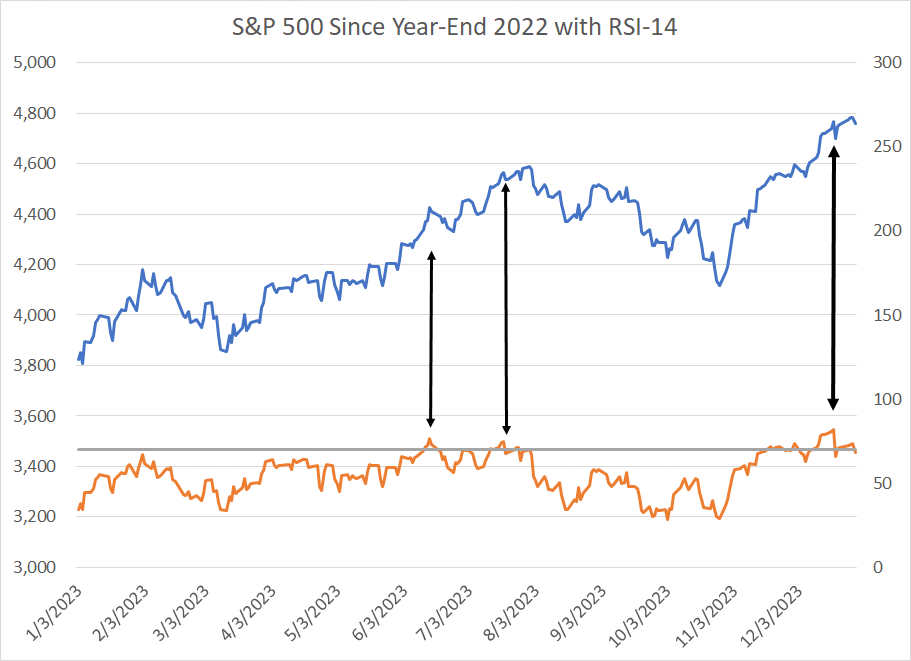
Source: Bloomberg
Based on the 14-day Relative Strength Index, the S&P 500 is just coming off the most overbought reading of the year (82.18 on December 19th). Obviously, this is not an infallible indicator; however, prior overbought readings on the S&P 500 in the past 12 months have led to at least short-term market peaks and minor pullbacks.
More broadly, since January 1990 (a total of 8,566 trading days) there have only been 22 trading days where the 14-day RSI has exceeded 82 as it did in late December:
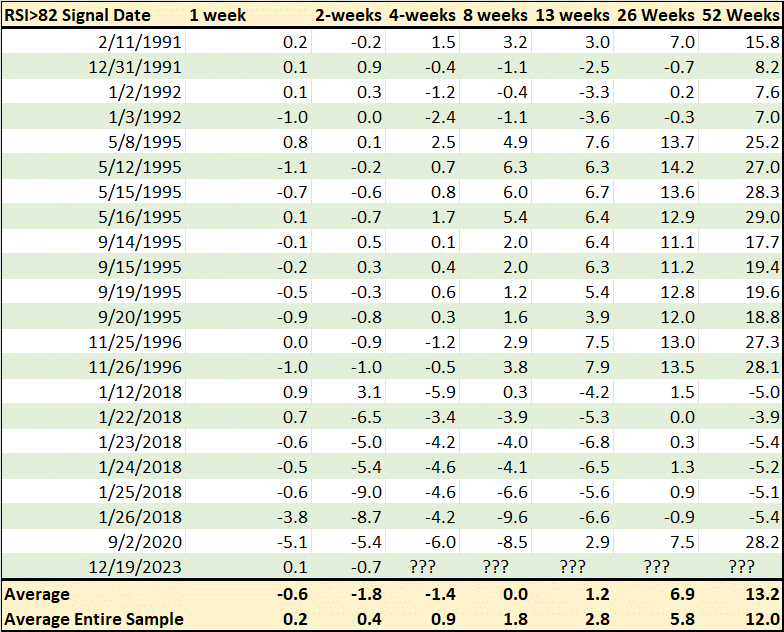
Source: Bloomberg
This table shows the total return for the S&P 500 over various holding periods following the 22 occasions since 1990 where the 14-day RSI on the S&P 500 exceeded 82. I’ve also included the rolling average return for the S&P 500 for the same holding periods across the entire sample of trading days since 1990.
As you can see, returns from holding stocks following such an elevated overbought reading are negative out to about 8 weeks, and below average through 13 weeks (one quarter). Beyond that, returns from buying overbought markets are actually well above average over 26-week and 52-week holding periods (6 months and one year).
Twenty-two trading days is a tiny sample size; however, this effect is logical.
Take a quick look at this table and you’ll see a large number of overbought signals in 1995, a year that marked the start of the powerful bull market of the late 1990s that produced an average annualized gain of +28.5% from the end of 1994 through the end of 1999.
In 1995 alone, the S&P 500 rallied more than 37%.
In powerful bull markets, stocks, commodities and indices tend to flash frequent overbought signals and remain overbought for prolonged periods. Pullbacks are mild and short-lived.
So a string of overbought readings over periods of 6 to 12 months can simply indicate powerful upside momentum as was the case in 1995. On a short-term basis, however, strong overbought readings, even in uptrend years like 1995, also invite some profit-taking and consolidation — some mean-reversion in returns.
All this has me inclined to anticipate something of a pullback in January followed by some additional upside as we move through Q1 2024.
Longer term, I am watching two main themes at the start of 2024.
First up, I continue to anticipate rotation as I outlined in the December 21, 2023 issue “Rotation’s Turn.” Specifically, I believe the Magnificent 7 stocks that dominated last year’s rally could take a back seat to some unloved groups like small-caps and value stocks.
Second, I continue to have some significant reservations about the health of the US and global economies. That’s not a huge near-term market concern — stock returns are usually above-average in the latter stages of a bull market — however, recession and excess valuations are historically a toxic combination for stocks.
DISCLAIMER: This article is not investment advice and represents the opinions of its author, Elliott Gue. The Free Market Speculator is NOT a securities broker/dealer or an investment advisor. You are responsible for your own investment decisions. All information contained in our newsletters and posts should be independently verified with the companies mentioned, and readers should always conduct their own research and due diligence and consider obtaining professional advice before making any investment decision.