


2022: The Year in Review
2022: The Year in Review
Liquidity reversal, policy inefficaciousness, resilient growth, valuation comeuppance

Liquidity Reversal
Our 2022 outlook note was titled Inflation Politics & Policy and began with a section titled “liquidity trickle”. In retrospect we got the effect of the reversal of excessive liquidity in ‘21 on markets correct, and while we expected higher fiscally driven inflation and a higher terminal policy rate than consensus, we underestimated the Fed’s response in the second half even as inflation peaked. We wrote frequently in 4Q21 about how the Fed was trapped in their policy process, but we did not expect a tightening strategy so heavily skewed towards rates hikes given the pandemic easing’s reliance on large-scale asset purchases. Consequently, because the process left the vast majority of the stock of Fed holdings — ~1/3 of the nominal and inflation-protected Treasury and agency mortgage-backed securities market — untouched, while raising the policy rate 425 basis points in 9 months rather than a measured removal of policy accommodation, they caused the mother of all Fed tightening corrections.
This wasn’t only the case in the stock and bond markets. The decision to delay the end of asset purchases during an inflation soft patch in 3Q21, then taper those purchases before ending them and waiting to end reinvestment, led to a final blowoff top for house prices that didn’t peak until spring of 2022. The Fed had some help: in 2021, Treasury Secretary Yellen barely sat down at her new virtual desk before she decided to drain $1.7 trillion from the Treasury General Account primarily by reducing issuance, an injection that was $200 billion larger than the Fed’s QE bank reserve creation, in 2/3 of the time. It was not a coincidence that when the TGA injections were at their maximum velocity in March-June, crypto, meme and concept capital reached a crescendo.
In 2022, the Treasury cranked up the auctions and drained $900 billion in the first 18 weeks of the year leading to a sharp reversal in real rates that permeated across risky assets and decimated speculative malinvestments. Strategists and economists continued to attempt to attribute the valuation comeuppance to fundamental deterioration, and while growth was slowing, it was not slow, and the magnitude and nature of pandemic rebalancing and normalization did not justify a 27% peak to trough S&P 500 correction. The Fed, Congress, Administration and Treasury massively overreacted to the pandemic, and when the politics of inflation caused consumer confidence to plunge to levels lower than during the Global Financial Crisis, the Fed and Treasury attempted to put the inflation genie back in the bottle by shrinking bank reserves. Turns out, banks didn’t want the money anyway due to regulatory handcuffs. Consequently, policy tightening reduced asset inflation, but thus far has had virtually no impact on consumer price inflation. Inflation is falling, but this is primarily due to the spontaneous economic order, not policy.

Rebalancing Growth
Though economic activity and earnings had a smaller than typical impact on asset prices in 2022, because it’s hard to know where you’re going if you don’t know where you’ve been, we are going to work through the consumption, trade and inventory rebalancing that led to a very misleading GDP pattern. The pandemic recession was unique due to consumption contracting more than investment, and spending on services falling more sharply than goods. While this was well known, we still heard endless commentary about excess inventories and intractable services inflation, developments that were easily forecastable. As we wind down the pandemic rebalancing process, our work on the prior business cycle, which began with 5 years of household deleveraging, implies that the correct base for trend consumption is mid-2014 when spending recovered to 3%. From that baseline, it appears to us that the goods binge and subsequent correction is complete and if there is a soft spot in consumer spending in 2023, it will be in services. While this could lead to softer GDP and GDI growth, it also implies cooler services less rent of shelter inflation and demand for labor.

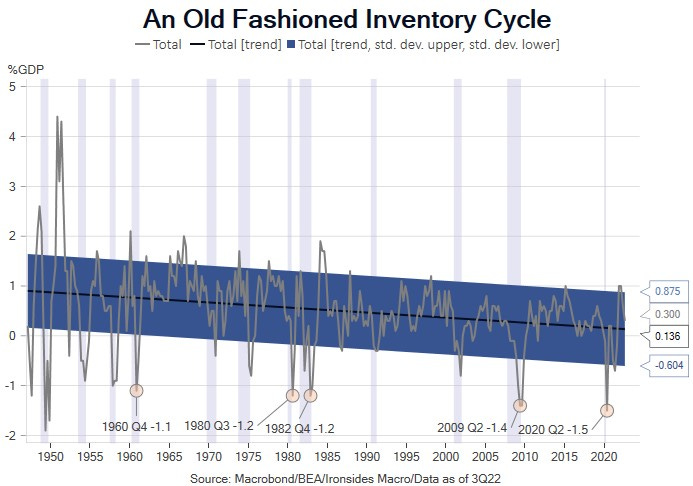
The Mother of All Inventory Cycles
The astonishing 30% quarterly annualized plunge in GDP in 2Q20 was accompanied by the largest contraction in inventories as a percent of GDP since the 1949 Truman reelection recession. Throughout 2021 the goods sector was plagued by shortages, underscoring the vulnerability of global value chains. In March ‘22 imports surged, inventories recovered as demand shifted from goods to services, leaving big box retailers with truckloads of goods in their parking lots. At present, the leading edge of global trade, Asian exports, are falling at an 8% annualized rate. It’ll take time to restructure supply chains however; there hasn’t been much economic edge to produce a wide range of goods in China for global distribution since the early ‘10s. The series of supply chain shocks, the Great East Japan earthquake and tsunami, US/China trade war, pandemic, and Russian invasion of Ukraine, are compelling reasons to derisk global ‘value’ chains. Global trade grew ~1.5 times as fast as industrial production in the ‘00s as supply chains were stretched across the globe; in the ‘10s, trade grew at half the rate as the ‘00s and at the same rate as production as the process stalled. In the ‘20s, we expect even slower trade growth below the pace of production. Some, including Fed Vice Chair Brainard, have argued that deglobalization will increase inflation volatility and slow productivity growth, but we think this is wrong. As production moves closer to final demand, the manufacturing sector will increasingly adopt technology innovation, and substitute capital for labor, leading to faster productivity growth and stable prices. This does not imply a return to the two decades of goods disinflation, and it does mean China, Japan and Germany need to restructure their export dependent economic models.
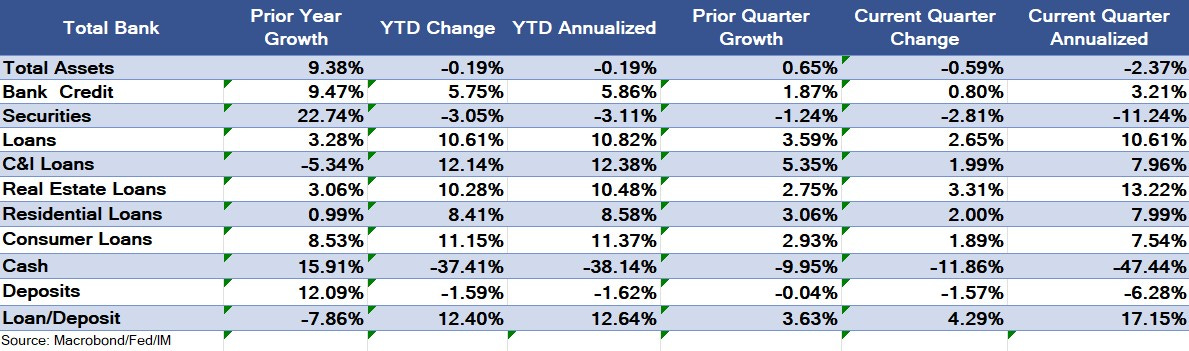
We made a serious assertion in saying that monetary policy tightening has had little effect on inflation. There are two elements to our view: the first, which holds the impact on housing is not yet evident in inflation measures, is non-controversial. The second is that one of the primary monetary policy channels, bank credit, was flooded in ‘21 to the point of counterproductivity and the reversal in ‘22 was welcomed by banks and led to greater credit creation. The evidence is compelling: in ‘21 commercial bank cash assets grew 15.9%, in ‘22 they contracted 38.1%. Banks added 22.7% to their securities holdings, and these assets were big losers, contracting 3.1% in ‘22. Loan growth more than tripled in ‘22 from 3.3% to 10.8%. So much for the flatter yield curve policy channel. A key element of our expectation for resilient growth in ‘22 was counterproductive monetary policy in ‘21 leading to stronger loan growth in ‘22.
Blunt Monetary Policy
While the Fed’s suboptimal monetary policy tightening process backfired in terms of bank credit and the related impact on consumer spending, they would likely assert it had an impact on spending through confidence and wealth channels. We’ve been watching wealth channels closely since the refi boom in 2002, and academic research concluded that the impact is 3-6% over two years. In our ‘22 outlook we concluded that the strike on the Fed put was considerably lower than following the Global Financial Crisis, when household debt and financial obligations ratio (interest as a percent of disposable income) were at all-time highs and the 16% hit to household net worth wasn’t reversed for 3 1/2 years.
The contrast to the pandemic couldn’t be starker. Debt levels were much lower, interest expense was at the lowest level since the Fed began tracking it in 1980, the hit to household net worth lasted one quarter and even with this year’s contraction, total net worth is 23% above the pre-pandemic peak. The negative wealth effect from the correction in financial assets in 2022, 3.5% over two years of the $7.3 trillion hit to net worth, is $130 billion or 50bp of nominal GDP in ‘22 and ‘23. This is an exceptionally inefficacious monetary policy channel.

At the core of our view that the tightening process would have been more efficacious had they chosen more active balance sheet management was the impact of easing on housing. During the pandemic the FOMC cut rates 150bp and expanded their balance sheet by the equivalent of 250bp of rate cuts. During 2021 we rebuilt a framework for house prices we first conceived during the summer of 2011 when our Bayesian prior was that house prices were bottoming based on excess inventories in recourse states no longer impacting prices in nonrecourse states (go to court relative to drop your keys in the mailbox and move on). We were astonished to learn that the r-squared of the 20 cities in the Case Shiller composite house price index was .97 where it remained for the first 10-months of ‘21. With Fed outright purchases of $40 billion and reinvestment of prepayments ~$55-$60 billion per month, it was clear that the QE was the cause of mortgage rates and spreads to Treasuries at all-time lows. While some FOMC participants continue to attribute the house price boom to pandemic factors like work-from-home, our analysis points directly at monetary policy due to the homogeneity of house price appreciation during the ‘21 boom. The reversal caused a sharp reversal and widening of agency mortgage-backed securities spreads to record wide levels. If the FOMC’s intention was to avoid a taper tantrum disorderly unwind, they failed.

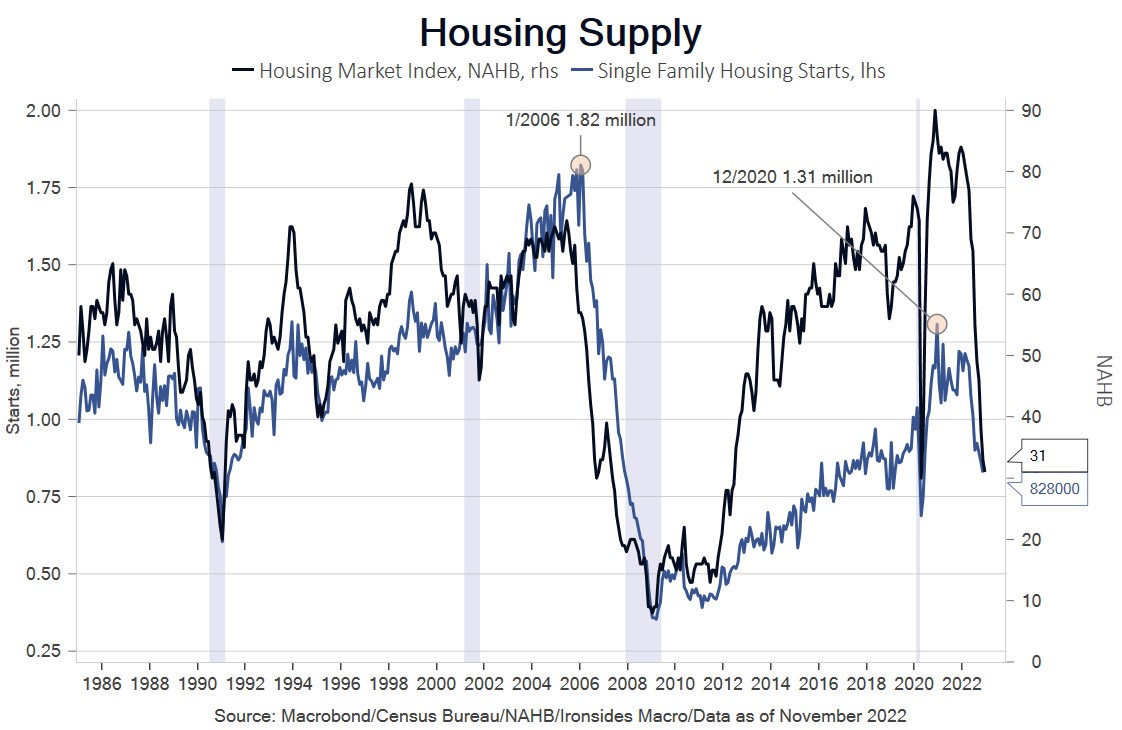
The household sector is relatively insulated due to the highest level of equity since the late ‘50s and the vast majority of issuance since the financial crisis in 30-year fixed rate mortgages. The broader issue is the impact on housing supply. The Fed’s excessive accommodation and suboptimal tightening process is damaging builders at a point where demographically driven demand is strong and the market has been underbuilt since the peak of the ‘00s boom in 2006.
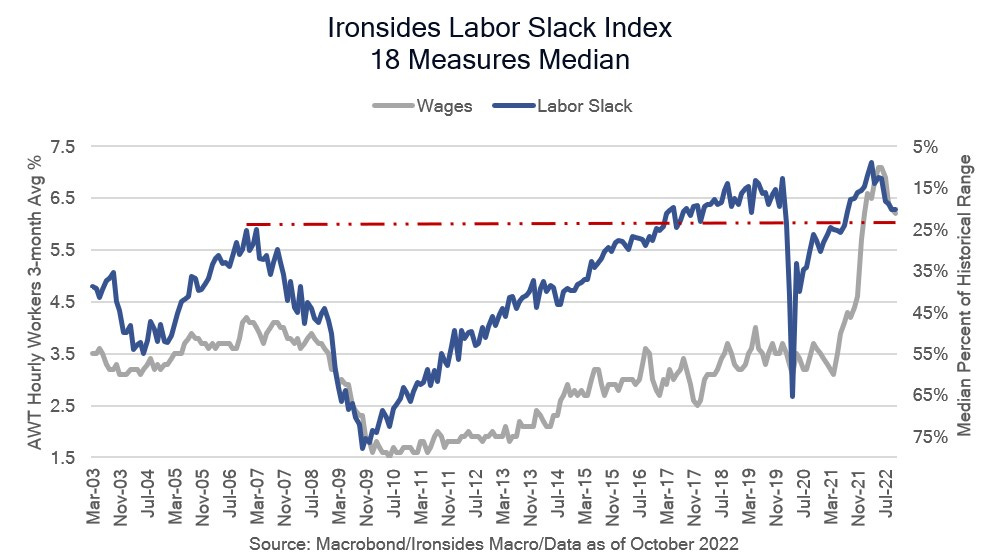
Our 18-factor labor slack index peaked in March, coincident with nonsupervisory average hourly earnings and shortly before the more robust Atlanta Fed Wage Tracker and Employment Cost Index, both of which are 3-month average rates of wage growth. Labor supply was recovering rapidly early in ‘22 before stalling in 2Q. Chairman Powell’s recent Brookings speech concluded the labor force was 3.5 million smaller than the pre-pandemic trend. He attributed 2 million of the shortfall to early retirements, and the other 1.5 million to a combination of Covid related health factors and reduced immigration. There was a large omission, perhaps due to the political sensitivity: the 16–24-year-old cohort is 1.2% lower than pre-pandemic despite lower college enrollment. Reduced immigration should have increased employment in this less skilled cohort and health should not be an issue either. The missing workers can be traced to an increase in transfer payments from 16.5% to 17.6% of considerably stronger total personal income growth (~8% vs. 5%). Fiscal policy is another reason why consumer spending is likely to remain resistant to tighter monetary policy. There are some increased work requirements coming in a handful of states for Medicaid, but on balance transfer payments are likely to remain robust until at least 2025.
The biggest open questions relate to labor market demand. The overarching question is whether demand is softening and the inability of the household survey, labor market flows, purchasing manager surveys, analysis on the benchmark revision of the establishment survey by the Philadelphia Fed’s research department, and the birth/death model to capture turning points and job openings. The second question is whether tighter policy and associated weaker business confidence will reduce the surplus of openings over unemployment. This Beveridge Curve thesis is the only way the FOMC evades a political pivot from inflation to employment now that the midterms are over, and the 2024 presidential election cycle has begun.

There is one more important economic factor before we move on to markets, namely the strong secular capital investment forces more than offsetting the business confidence impact of monetary policy tightening. From February through October, regional Fed manufacturing surveys 6-month forward capital spending plans weakened, however on both an absolute (shown here) and annualized growth rate basis they steadily increased and gathered momentum in 3Q22. The drag on capex for two decades has been physical plant, and that is turning up and will likely be a driver for the decade to come.

One final investment chart before moving on to inflation and markets: structures/physical plant investment has been weak for two decades during the outsourcing globalization era. One element to our positive view on productivity, a potential offset to fiscally driven inflation, is a strong capital investment cycle. One of the factors that exacerbated the ‘70s Great Inflation was a weakening of capex following a decade of robust growth attributable to stable prices, underinvestment in the ‘50s and supply-side tax reform. We have two of those three factors in place at present, capex was well below trend in the ‘10s and though the Biden Administration and Democratically controlled Congress has been chipping away at the Tax Cuts & Jobs Act, the most important factor for structures investment is the marginal tax rate due to lengthy depreciation on those assets.

Straight to the ‘70s
We ended our 2022 outlook note citing the ‘70s analog as the biggest risk to our outlook for a late year recovery in the equity market. When we wrote that note we knew about the pandemic shock, and while we originally wrote that the ESG was supportive of energy prices and energy companies return on invested capital in December 2019, the Russian Invasion created an OPEC Embargo like second shock that catapulted inflation right past the late ‘60s gradual ascent through 4% to nearly double digit ‘70s style inflation. The question remains unanswered as to whether inflation stalls near 4% as we expect. The supply shocks should ease, allowing for a benign mid ‘60s environment for the corporate sector where strong nominal growth provides operating leverage without an unstable marginal cost environment.

Valuation Comeuppance
The excessive, counterproductive liquidity injections contributed to a wide range of overvalued assets at the end of 2021. The most direct effect of Fed large-scale asset purchases is the level of real rates, and perhaps unintentionally, interest rate implied volatility. The average duration of Fed QE was ~6 years, consequently, 5-year real rates (TIPS yields) began 2022 at -1.66% and the benchmark rate for equity risk premium models, the 10-year real rate was -1.1%. We wrote numerous notes in recent years about real rate shocks triggering broad risk-off volatility spikes. We identified Fed policy normalization corrections back to WWII, each cycle had one until the ‘10s when there were eight, mostly related to the Fed’s large-scale asset purchases. In 2018, there were two different 30bp rapid increases in 10-year real rates. The first, in January, led to an extreme volatility shock in equities known as Volmageddon. The second, in September, started the QT Crash 20% drop in the S&P 500. In 2022, the peak to trough increase in 10-year TIPS was 274bp. You might be tempted to conclude that the process is complete, however as we discussed in our 2023 outlook note, the stock of Fed holdings of Treasuries, TIPS and agency mortgage-backed securities will continue to suppress rates in the belly of the curve for years to come. The impact of their holdings is evident in term premium models. The Adrian Crump & Moench 10-year term premium (available on Bloomberg) is -62bp; in other words, you have to pay for the ‘privilege’ of waiting 10-years to get your money back from the government. While this might sound ominous, absent a change in the Fed’ balance sheet contraction strategy to include outright sales of mortgages, overvaluation of Treasuries is likely to persist for years to come.

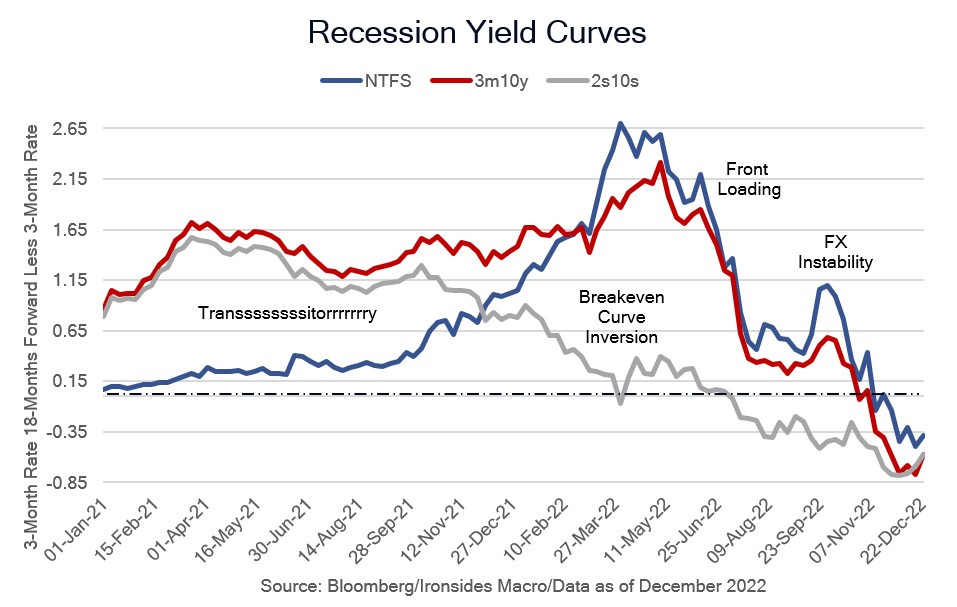
One of the interesting, and misunderstood, elements of the failure of the risk mitigating asset in the 60/40 asset allocation model, was the persistent flattening of the yield curve across a wide range of tenors. When the widely watched 2s10s curve initially inverted in April, it prompted pronouncements that it is never different this time and a recession was inevitable. This was precisely wrong: it turns out the inversion was attributable to a 200bp inversion of the 2s10s breakeven inflation curve — in effect the Treasury market was forecasting, correctly as it turns out, peak inflation. The curves that have more academic support as recession indicators, the 3-month 10-year Treasury curve and near-term forward spread (3-month rate, 18-months forward less the current 3-month rate) were steepening in April and did not invert until the very end of 2022. Since the 50bp increase in the FOMC’s terminal rate forecast at the December FOMC meeting, despite two cooler than expected inflation readings, (a change that appeared to be a form of forward guidance intended to increase real rates) Treasury prices rallied even at the front-end as the market questions the Fed’s forecasts.
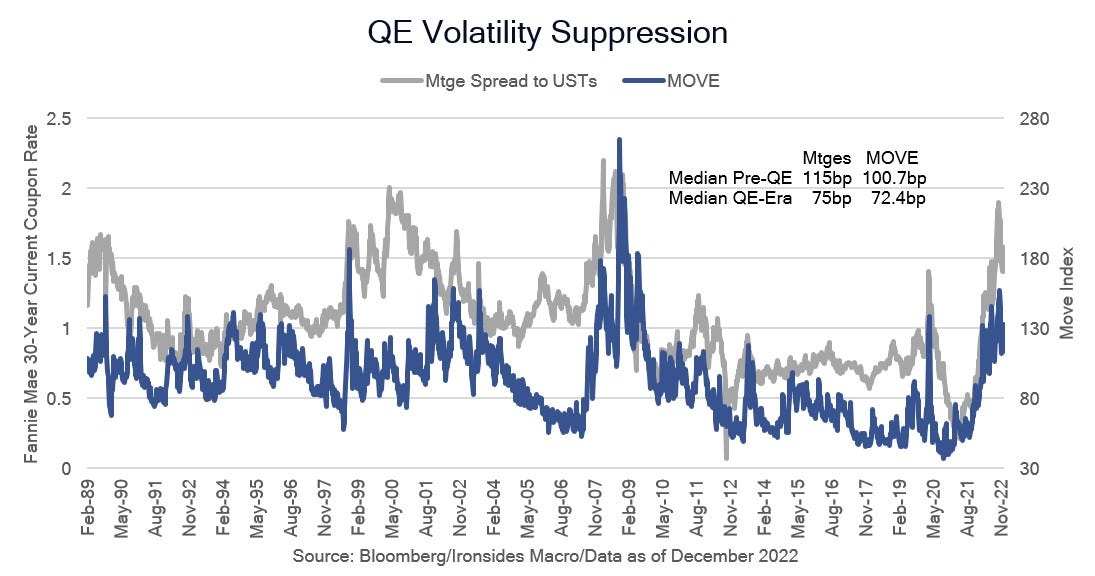
One of the themes we have focused on for years is QE volatility suppression resulting from Fed purchases of the largest source of interest rate volatility, mortgage prepayment risk. Unlike the private sector, and the GSEs from 2002-2008 when Fannie Mae and Freddie Mac each held $1 trillion of agency MBS, the Fed does not hedge prepayment risk known as convexity risk due to the nonlinearity of an option payoff profile. In 2021, interest rate implied volatility and the spread of mortgages to Treasuries contracted to all-time lows. As the Fed ended MBS outright purchases of $40 billion and reinvestment of prepayments of $55-$60 billion per month, interest rate volatility spiked, thereby exacerbating the risk-off tone that contributed to the valuation comeuppance for a wide range of assets.
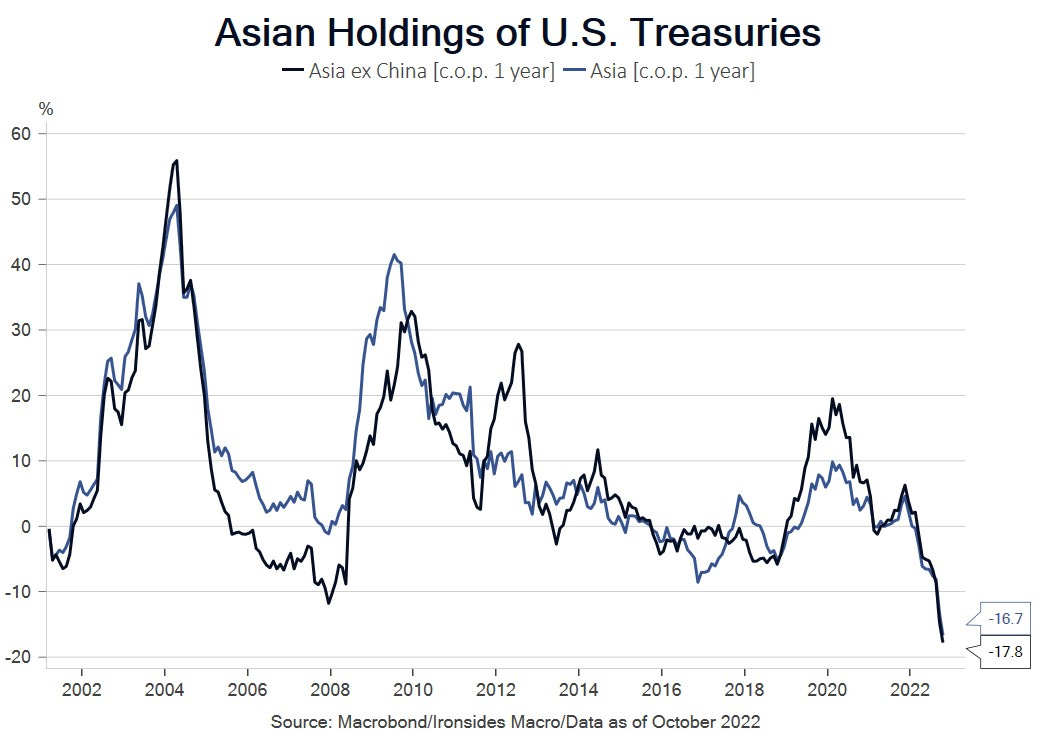
One final comment on fixed income, two decades of price insensitive buying began with Japan and China buying $400 billion each during the globalization boom as an integral component of their Mercantilist economic models. Deglobalization implies continued divestment of their large stock of Treasuries.
Tech, Defensives and Cyclicals
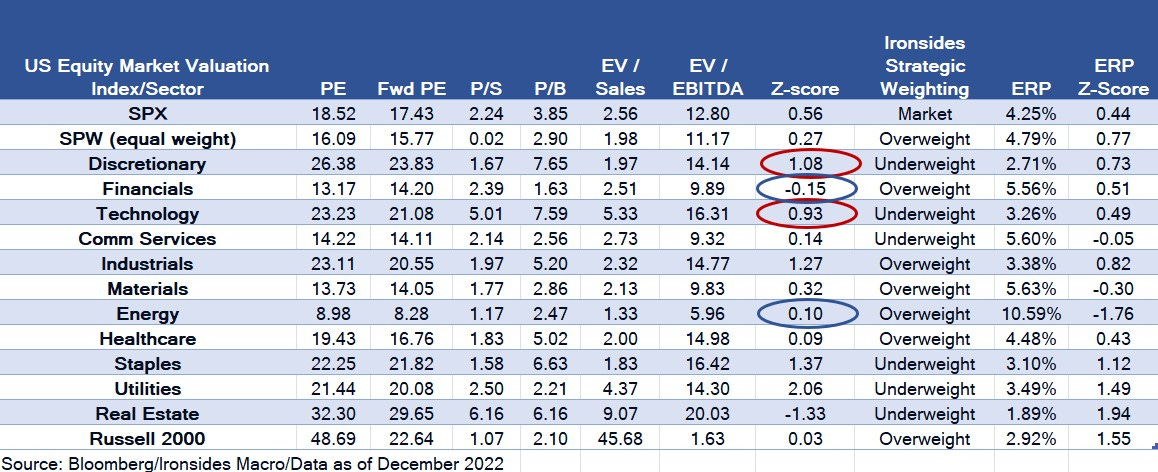
The year began with equities rich on an absolute basis relative to history, but still cheap relative to real rates and credit-based equity risk premium models. As the 60/40 model suffered its worst year in decades, beneath the surface technology and related sectors (consumer discretionary and communication services) were absorbing the bulk of the valuation compression. But with the exception of communication services, technology and consumer discretionary remain rich. Perhaps underappreciated was the effect of investors’ reducing portfolio risk that left defensive sectors, with the exception of healthcare, excessively valued as well. The cheap sectors are economically sensitive cyclical sectors, again with one exception (industrials). Given our view that a contraction in nominal growth is a very low probability outcome, this is an exceptional opportunity, and we expect it to be the source of outperformance in 2023. When we hear economists state emphatically markets haven’t appropriately discounted recession, in a sense we agree, the premium of defensives and discount of cyclicals are excessive.
One final thought about earnings, we heard a lot of strategists and investors forecast a sharp decline in earnings in 2022, and again now for 2023. We made the point early in the year that in the early stages of a recovery prices paid rise faster than prices received, however operating leverage due to faster revenue growth and fixed costs is an offset to marginal cost pressure. This dynamic is most acute in the industrial sector, this chart hints that the marginal cost rebalancing process is largely complete. Industrial sector profit margins have been flat for the last two months, given our expectation that the inventory destocking process is largely complete, industrial sector margins could positively surprise in 2023.

We are going to leave a discussion of the dollar and energy prices for upcoming notes, and the decision by the Bank of Japan to widen the band ahead of Kuroda’s coming retirement requires a lengthy discussion. Energy and the Chinese pandemic pivot are topics that warrant more than a few sentences. We hope you enjoy our outlook notes including our year in review, it was a difficult, but fascinating year.
Barry C. Knapp
Managing Partner
Director of Research
Ironsides Macroeconomics LLC
908-821-7584
bcknapp@ironsidesmacro.com
https://www.linkedin.com/in/barry-c-knapp/
@barryknapp
Thanks Barry, looking forward to your upcoming notes, Merry Christmas and Happy New Year