We covered Opendoor on our deepdive published June 20th called Opendoor: The Market Maker in the middle of a Real Estate Market slowdown and we did again on August 15th after their Q2 Earnings, this earnings season we will update and analyze once again all the companies that we have previously covered, so make sure to subscriber to the substack to get the updates when these come.
Thanks for reading LongYield! Subscribe for free to receive new posts and support my work.
Opendoor reported earnings last Thursday, with both bigger revenue than expected and bigger losses than expected. The stock has been crushed, by the time we are writing this the stock is down to 2.02 (-14%). The current situation of the Real Estate market in the US has the company operating in perhaps the second worst market of the past 30 years. From these quarters Opendoor will prove if their model can withstand these strong volatile moves in the real estate market.
Performance Summary:
Revenue
Q3 2022 Revenue was $3.3b up 48% vs Q3 2021
Revenue was down 20% vs last quarter
YTD Revenue $12.7b vs $4.2b last year 203% growth YoY
Key Metrics:
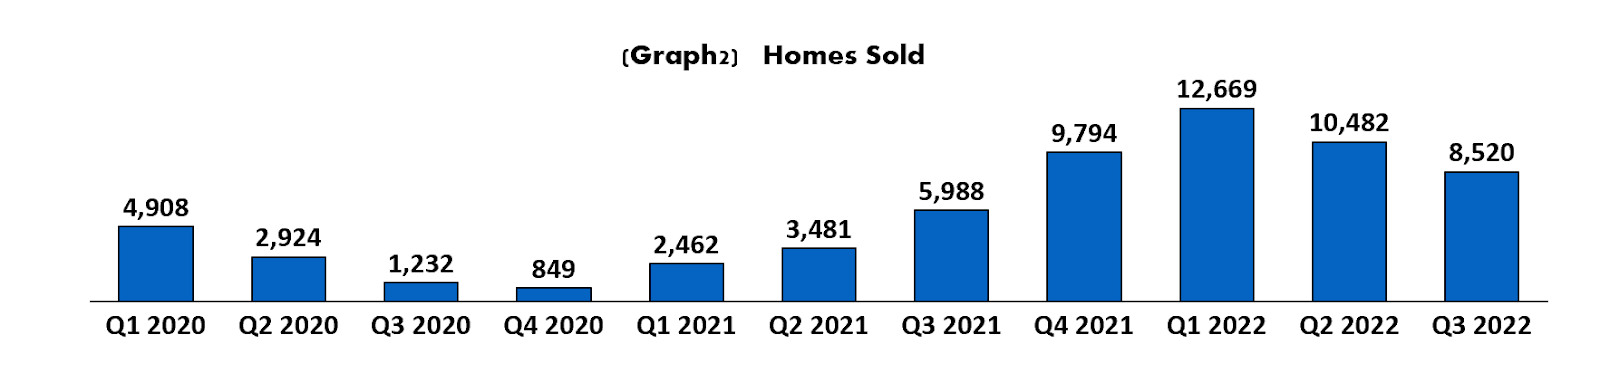
8,520 Homes sold, up by 42% from Q3 2021
Homes sold in the quarter came down by 18.7% or 1,962 fewer homes
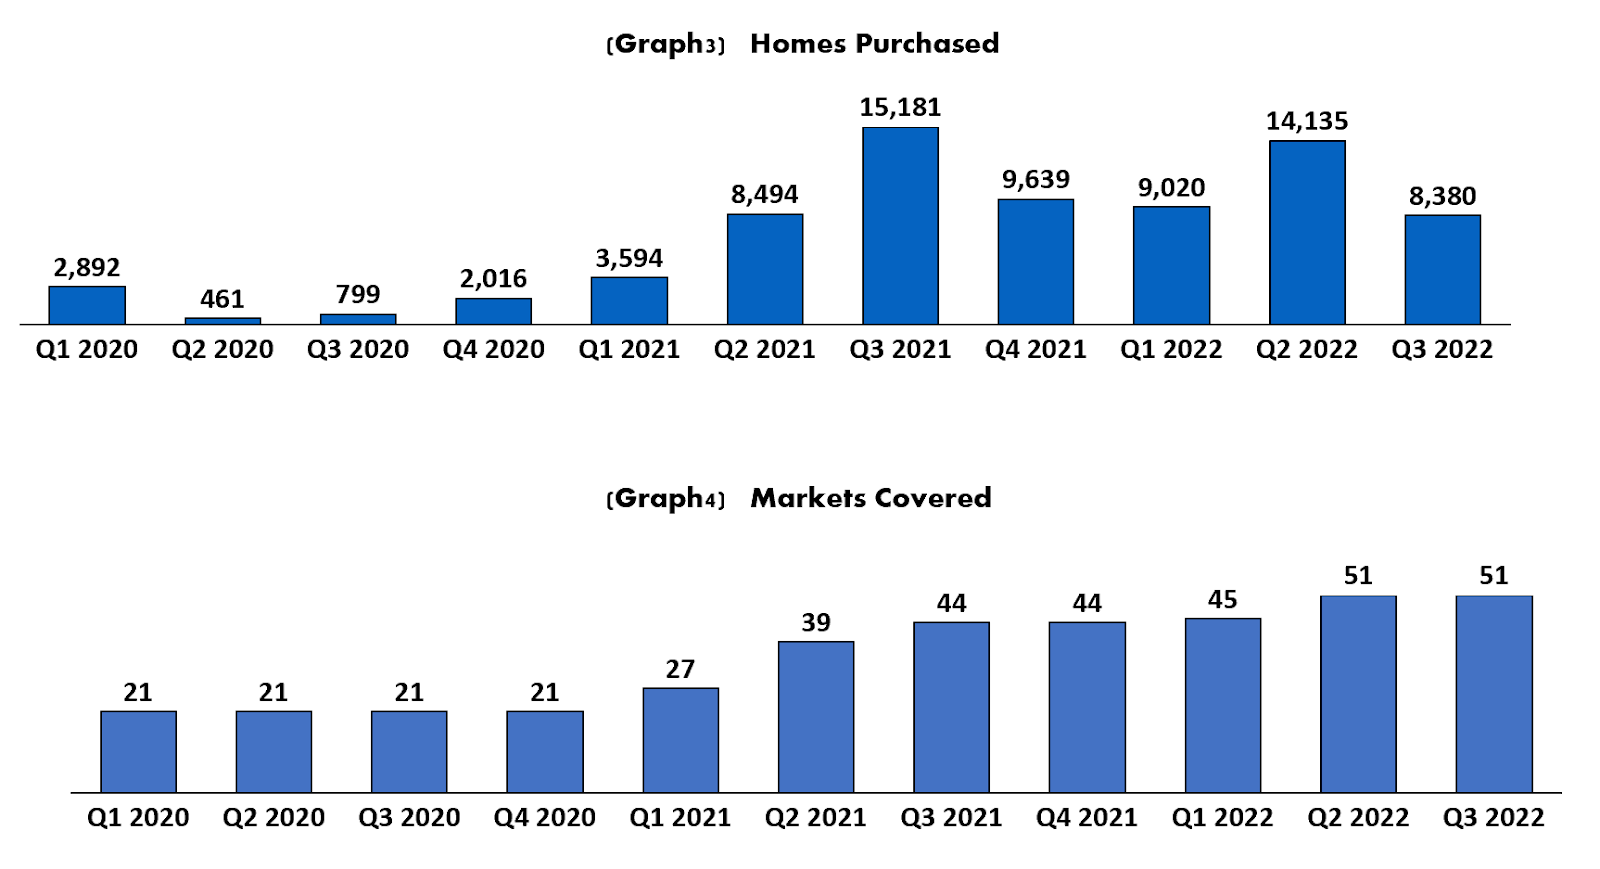
8,380 homes were purchased in the quarter
The inventory at the end of the quarter was 16,873, very close to the previous quarter, which closed at 17K homes.
The value of the inventory at the end of the period was $6b
Opendoor finished the quarter with presence in 51 markets, flat from the previous quarter and up 7 since the start of the year
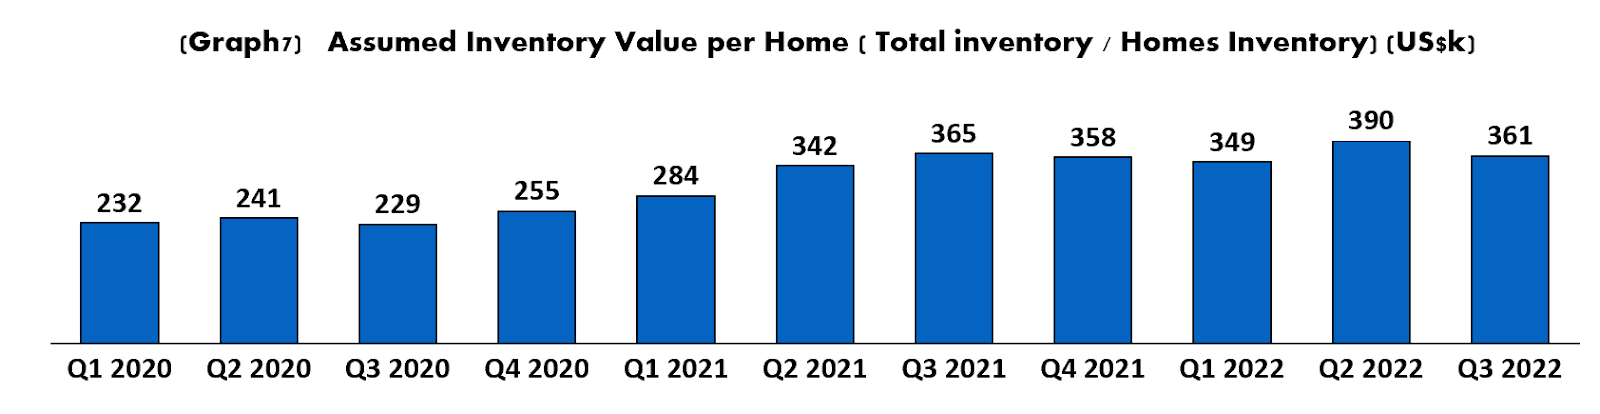
Inventory value per home came down by 7.4% to $361K, this is the same level that it had back in Q3 2021.
Revenue per home for the quarter was $394K, 9% higher than the current value of the average home in their inventory.
Cost and Expenses:
Cost of sales was 83% above Q3 2021 or $3.7 billion vs $2.0 billion last year
The increase in cost of revenue was primarily attributable to higher sales volumes and a 11% increase in cost of revenue per home
Gross margin for the quarter was a loss of $425m or -13% of revenue
During the quarter Opendoor performed a $573 million of inventory valuation adjustments to adjust the cost basis of homes remaining in inventory at September 30, 2022
When excluding this valuation adjustment the gross margin for the quarter would be $148m or 4.4% of revenue
That gross margin percentage is a drop from 12% during Q2 2022 and an average of 11% for the previous 6 quarters prior to Q3
Sales, Marketing and Operations increased by $107 million, or 70% YoY
The increase was primarily attributable to a $48 million increase in resale transaction costs and broker commissions, consistent with the 42% increase in the number of homes sold and inclusive of temporary agent commission bonuses in order to drive sales.
Property holding costs increased by $28 million, consistent with increased inventory levels and longer inventory holding periods compared to the three months ended September 30, 2021.
Advertising expenses increased $11 million, from the $34 million of Q3 2021 to $45 million for Q3 2022 as they increased marketing to drive acquisition volumes in both existing and new markets.
General and administrative expenses decreased by $6 million, or 7%, during Q3 vs last year’s Q3 primarily attributable to a reduction in stock-based compensation.
When combining all and looking at SG&A per home sold, Opendoor reported a cost of 1.2% cost per home sold in SG&A, that is an increase from the one seen in Q2 2022 of 0.94% but no that far from the previous 4 quarters where they averaged 1.06% of revenue
Operating expenses were 11% during the quarter, very close to the same level the prior quarter but a bit higher than Q1 2022. (which was the lowest ever at 8%)
Operating losses from operations were $810 million, without the revaluation of inventory they were $237 million. This was the first operating loss after two consecutive quarters of profitability
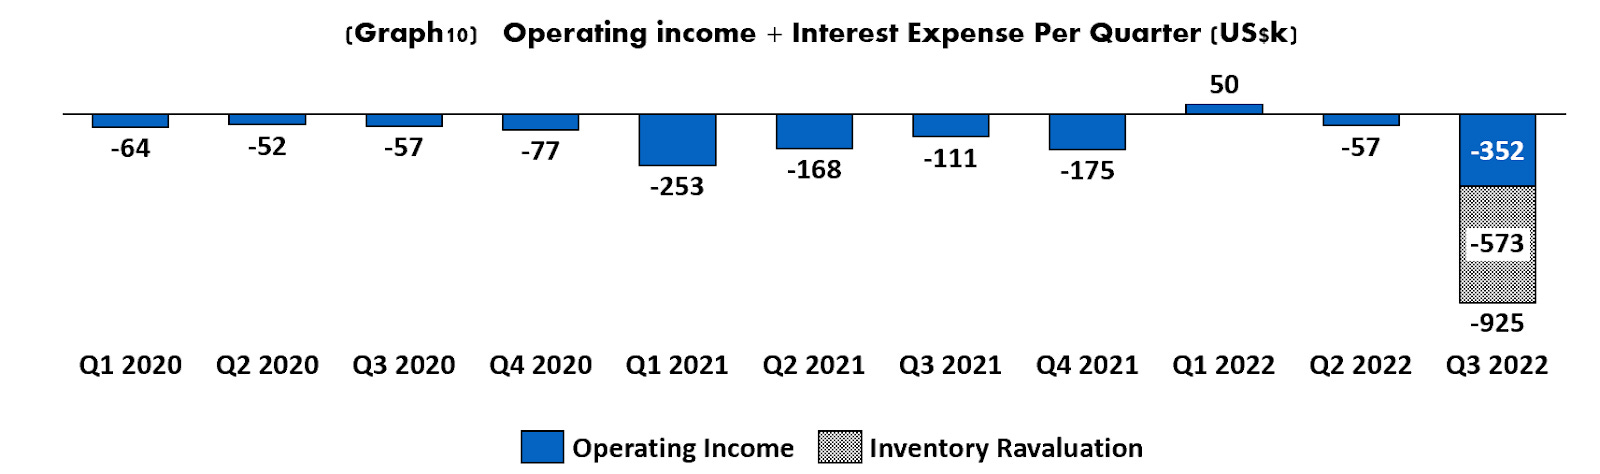
A company like Opendoor finances its inventory with debt, hence, interest expense is pretty much close to operating cost. If we include these, the operating activity looks a bit different.
From this point of view the only quarter with profits so far has been Q1 2022, when they produced $50 in profits. It is important to look at what Opendoor reports as Adjusted Ebitda, as we have mentioned in many of our articles, you must never blindly trust any adjusted EBITDA that a company might report, these are usually an easy tool to show whatever type of performance you want. Despite this we will show you below what they presented this quarter as adjusted Ebitda.
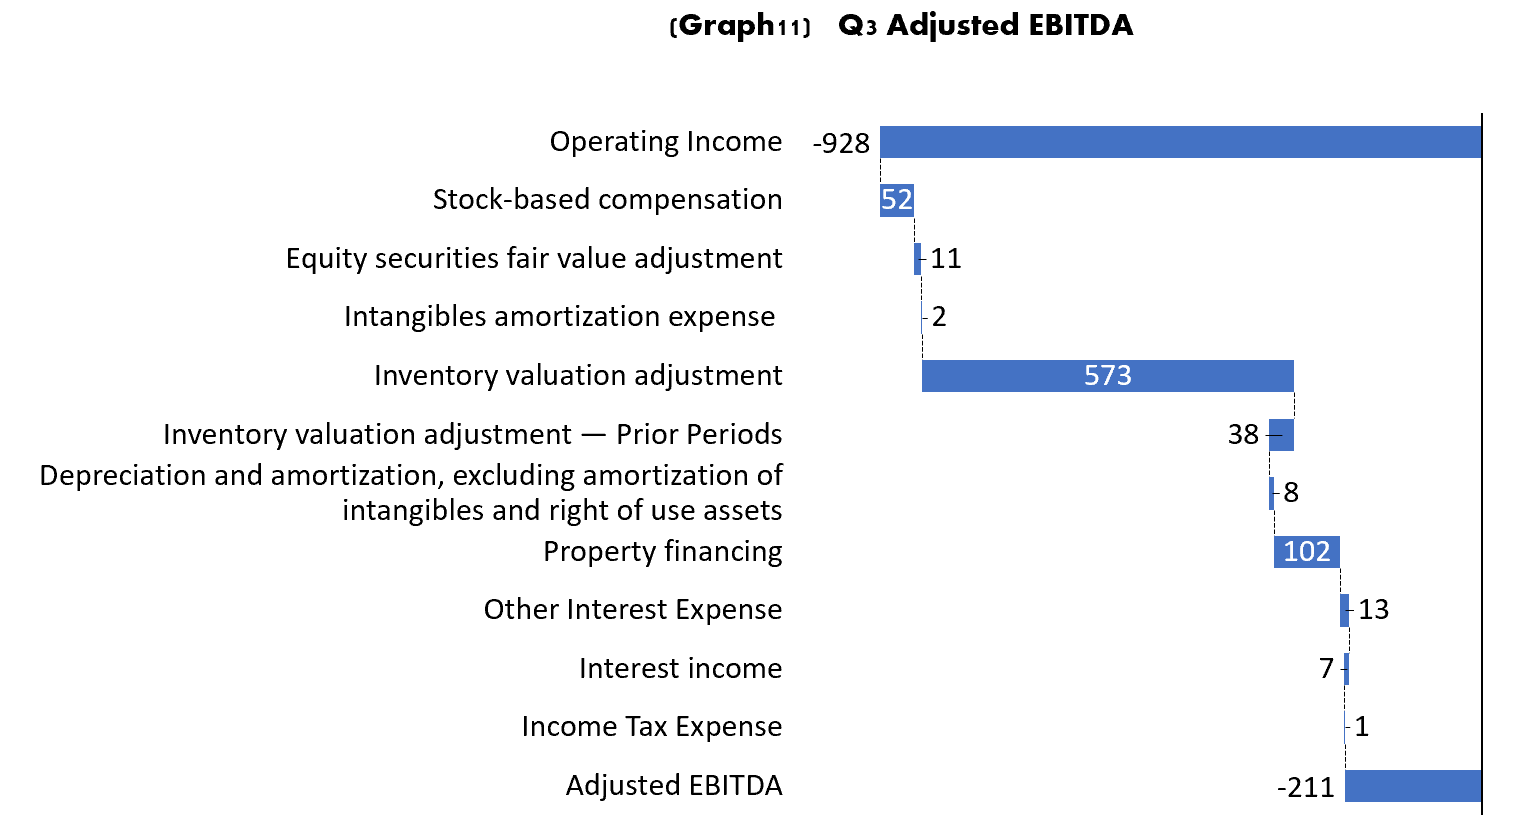
There are many non cash expenses that are excluded from their adjusted EBITDA. Stock based compensation, accounting adjustments (Equity fair value adjustment, Inventory valuation adjustment, depreciation). They also exclude property financing, which we believe that should not be excluded since it is core of their business, this is how they finance their properties. If you add back these 102 million to the adjusted EBITDA the result from Q3 would go to $313 million
YTD adjusted EBITDA reported by Opendoor is positive $83 million, when including back the property financing the number would go to negative $53 million. This is probably the closest to the correct number way to look at it in terms of adjusting out the “noise”. No terribly bad when considering the year has been really bad for Real Estate, and is nothing that would break the bank, at least at the current levels.
Balance Sheet
Cash And Short Term Investments close the period at $1.3b down from $2.2b
Additionally Opendoor holds $1.752b in restricted cash, up from $615m during the previous quarter
Short Term Investments were down from $233 to $178m
Total debt $8.07b, of which $4.1b is long term debt and $3.4b is short term debt.
Inventory like mentioned before was $6b, this number is important and it is important to compare this to total debt, since Opendoor finances its home purchases with asset backed debt, these two numbers usually move very closely together.
Operational highlights
Products
Opendoor highlighted during their call that they have two main products, one that would be called 1P or first party, which is the most developed product at the time. This is when Opendoor buys and sells directly the homes. The second product type would be the 3P or third party, this is the marketplace where they connect buyers and sellers. This will be Opendoor exclusives.
As for the current state of 1P, operating in this type of real estate market will likely be the most difficult thing Opendoor has done so far. Their focused as indicated on the call is in 4 different areas:
To improve inventory health by accelerating the selling of homes from Q2 offers. They are estimating that by the end of 2022 they would have sold at least 65% of this inventory.
Acquisitions at better spreads with the expectation for contribution margins to perform neat the targets of 4% to 6%
Operational and platform changes acceleration. It is expected that these will reduce the time that takes to do repairs. This would bring the number of days that Opendoor takes to list the house from an average of 23 days to 15 days during Q3
Rightsized, they announced this past week that their personnel was reduced by 18%
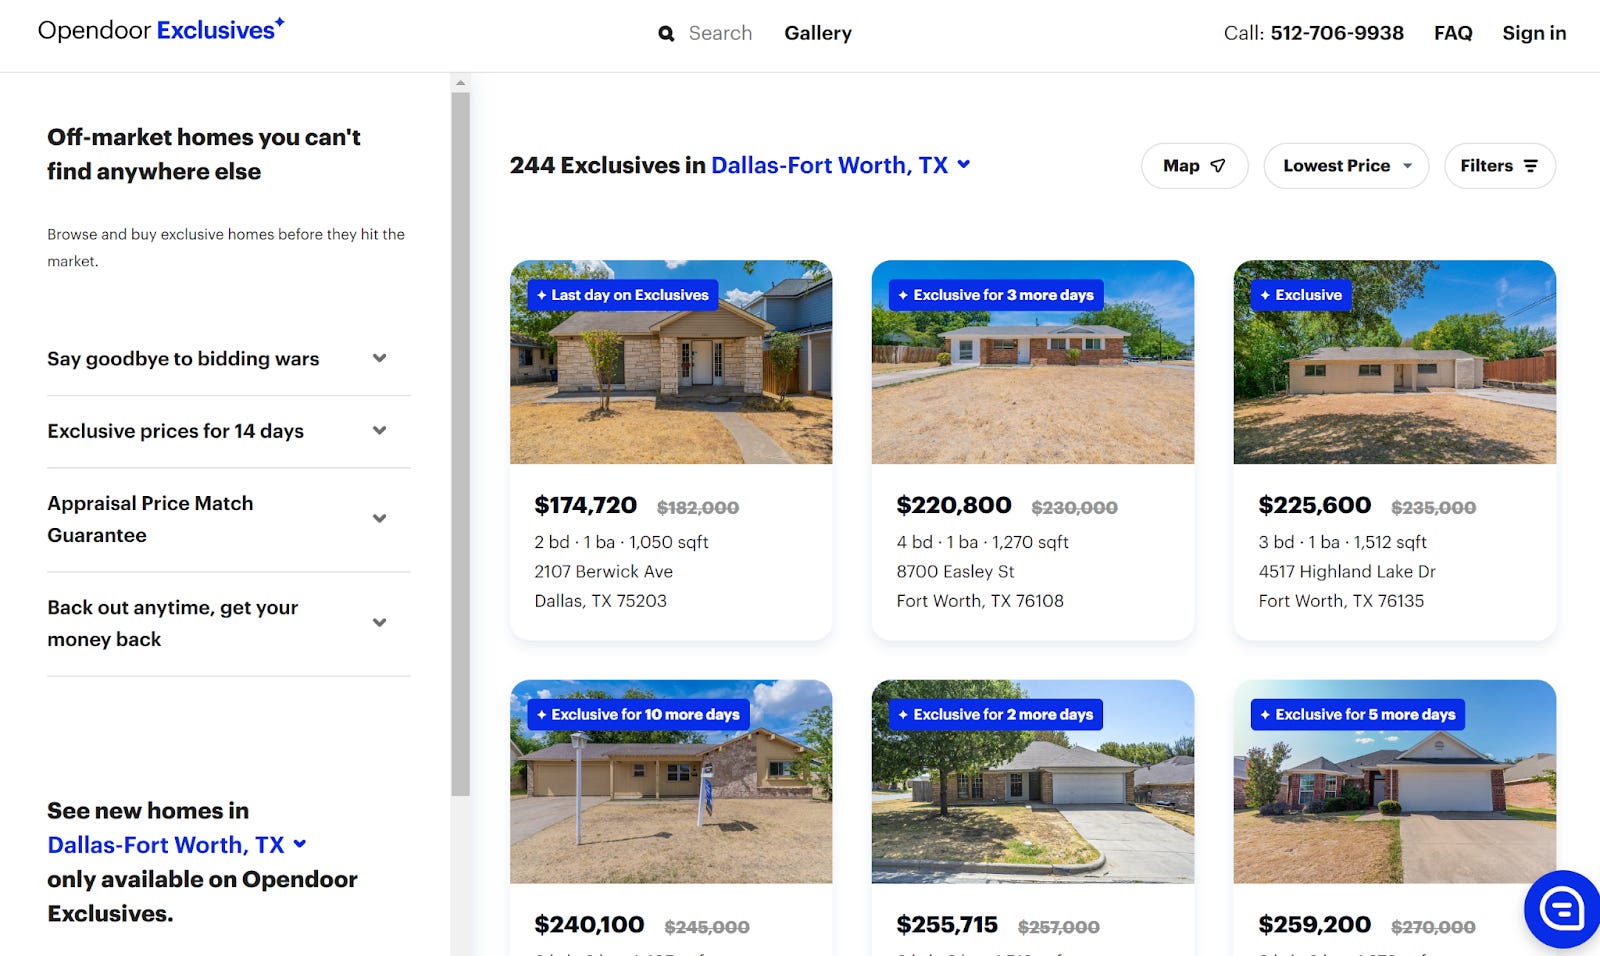
In our Q2 Earnings article we covered Opendoor exclusives with a short explanation of what they had announced at the time. During this call they gave a little more color into their vision for Opendoor Exclusives.
As seen by Opendoor, this will be the main marketplace for the company, it won’t be only homes that Opendoor purchased and sells on their own platform. This product will also allow buyers and sellers to list or buy homes on the marketplace. It will become an online marketplace for buying homes. The intention is to make buying a home as easy and painless as buying anything else online.
Opendoor has already been testing the product, they have been offering this product to institutional buyers. In fact, 10% of the homes sold during 2022 have been to institutional buyers, in some cases they had a home sold already before even closing with the home’s seller. Today 20% of the homes are under contract within two weeks.
At the time this is only available in a few Cities in Texas, but we would expect that this will be accelerated once the overall Real Estate Markets stabilizes.
Zillow Partnership
Last quarter it was announced that Opendoor and Zillow would enter into a partnership, where Zillow would allow customers to request an Opendoor offer of their home on Zillow’s website. This will be of great value to Opendoor as it would reduce efforts in terms of marketing and overall brand recognition. The Partnership is now expected to start somewhere during Q1 2023 as announced by Zillow during their call.
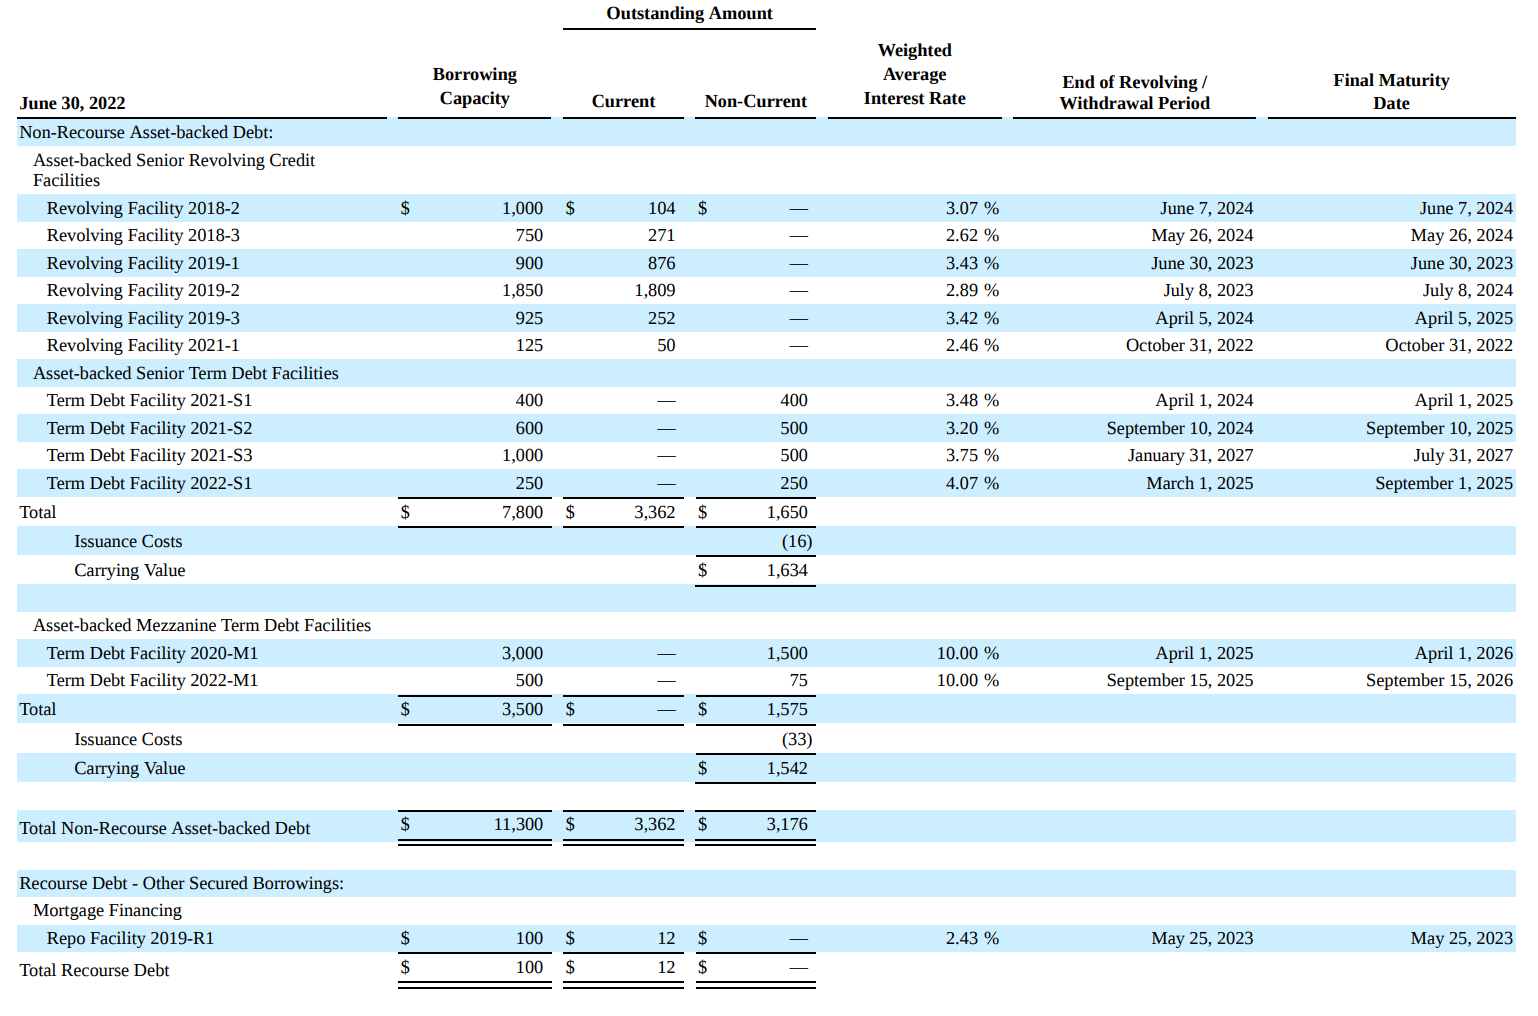
Financing Cost.
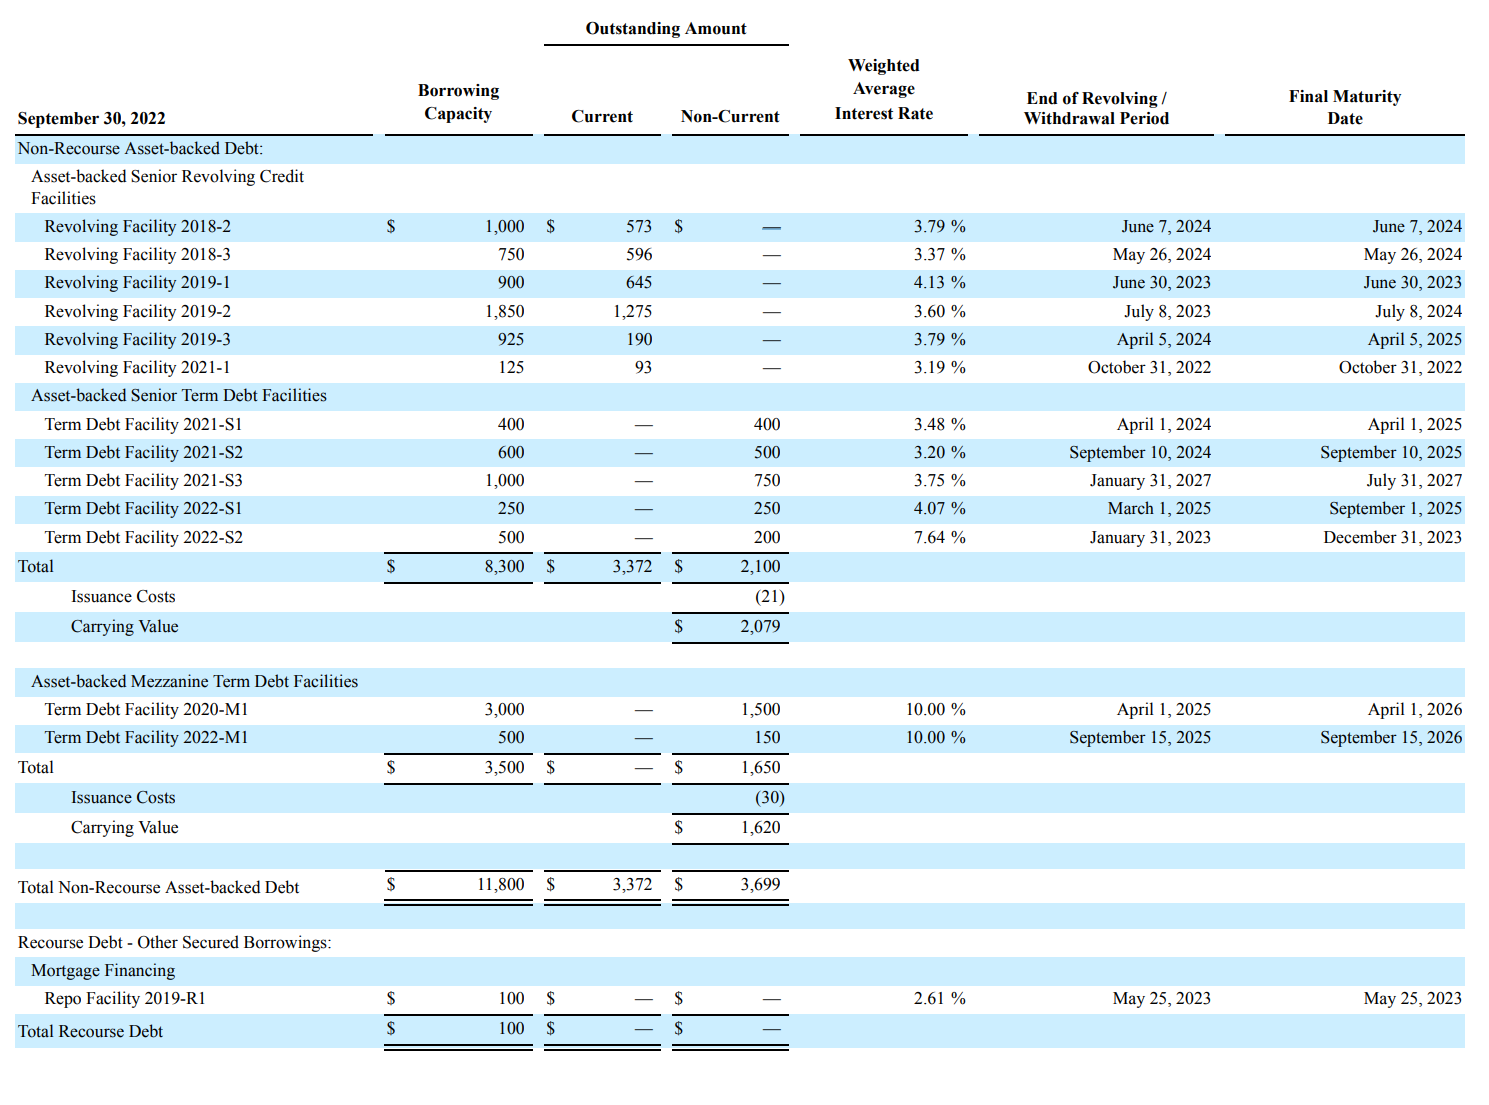
Their latest debt facility came in with considerably higher cost than the previous ones (7.64%), some of their debt is fixed (50%) to future years, somewhere around 2024 and 2025, the fixed rate debt is under “Asset backed senior term debt facilities”. Any new added facilities will certainly come at higher rates, and the section under “Asset backed Senior Revolving credit facilities” will trend higher as well (as 50% has a floating rate). This will make purchasing homes more expensive, reducing margins.
They previously had reported that it took about 100 days to sell a house. Using this metric they would at least be able to use the same money to buy 3.65 homes per year. At a rate of 3.79% this becomes 1.03% per home, at a rate of 7.64%, like the facility recently added in 2022, the financing cost per home becomes 2.09%, that if the 100 days remains the same, if the number of days increases, because of a slower real estate market, that number could increase, for example if it is 120 days the 3.79% rate becomes 1.24% and the 7.64% becomes 2.51%
Opendoor added these comments regarding the risk of a higher debt cost to the business.
‘’We may use interest rate cap derivatives, interest rate swaps or other interest rate hedging instruments to economically hedge and manage interest rate risk with respect to our variable floating rate debt. Many of our floating rate debt facilities also have Benchmark Rate floors. Assuming no change in the outstanding borrowings on our credit facilities, we estimate that a one percentage point increase in the Benchmark Rate would increase our annual interest expense by approximately $36 million and $37 million as of September 30, 2022 and December 31, 2021, respectively.”
Q3 Reported Credit Facilities and Long Term Debt
Q2 Reported Credit Facilities and Long Term Debt
Thanks for reading LongYield! Subscribe for free to receive new posts and support my work.
Outlook
Their short term outlook is directly depending on what happens with the real estate market. A lot of people, perhaps most, think that there will be at the least a hard correction of the market in the coming months. The most pessimistic are calling for a crash similar to the one seen in 2008.
At the time we could summarize the market as follows:
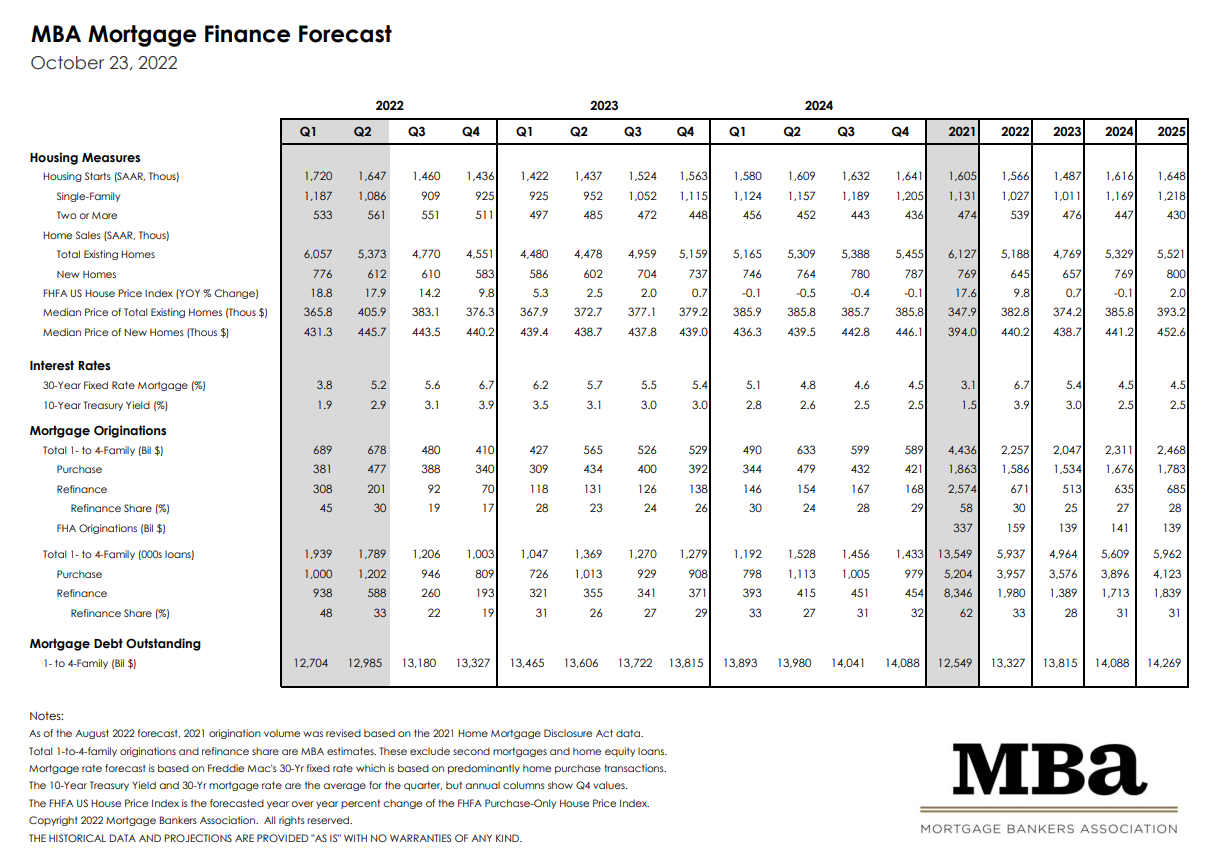
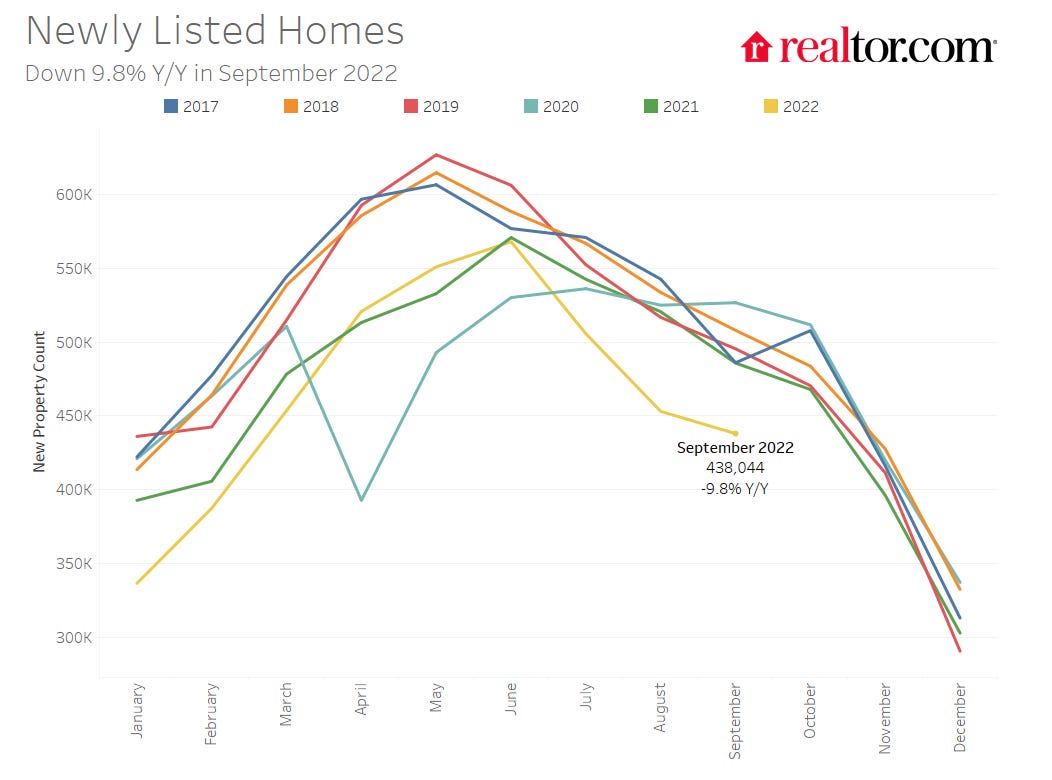
Selling has crashed: The amount of existing homes sold during October was 4.7 million, the lowest in a long time, and the last time the number of homes sold was close enough to 4.7 was in November 2015. That time the number bounced back quickly. This time that is not likely.
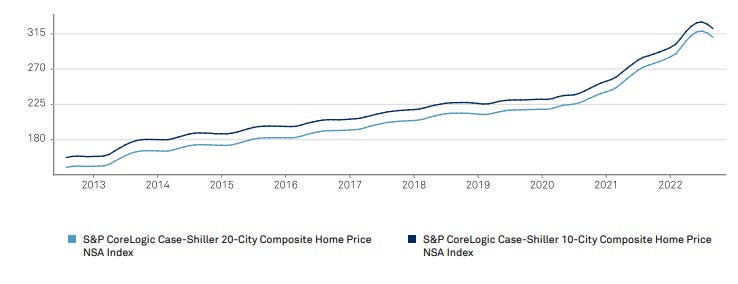
S&P CoreLogic Case-Shiller 20-City Composite Home Price NSA Index saw a decrease of 1.63% over the last reported month and 2.2% over the last 3 months. Cities like San Francisco (-4.3%), Seattle (-3.9%) and San Diego (-2.8%) are already seeing prices down considerably when looking at month over month.
Mortgage originations are even lower than what it was seen in 2019 and the Mortgage Bankers Association is forecasting similar performance in 2023 and 2024.
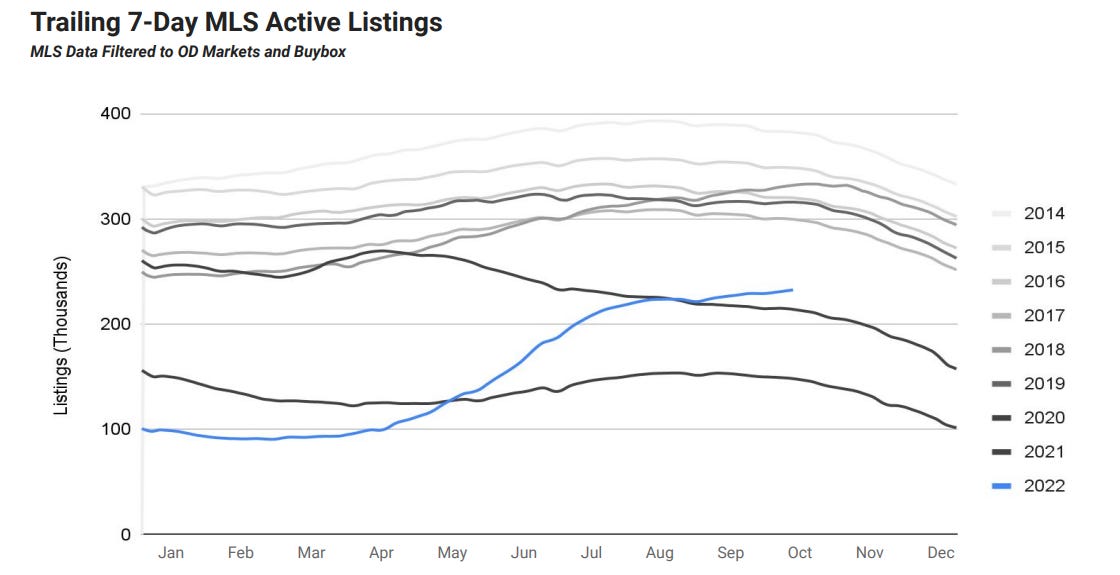
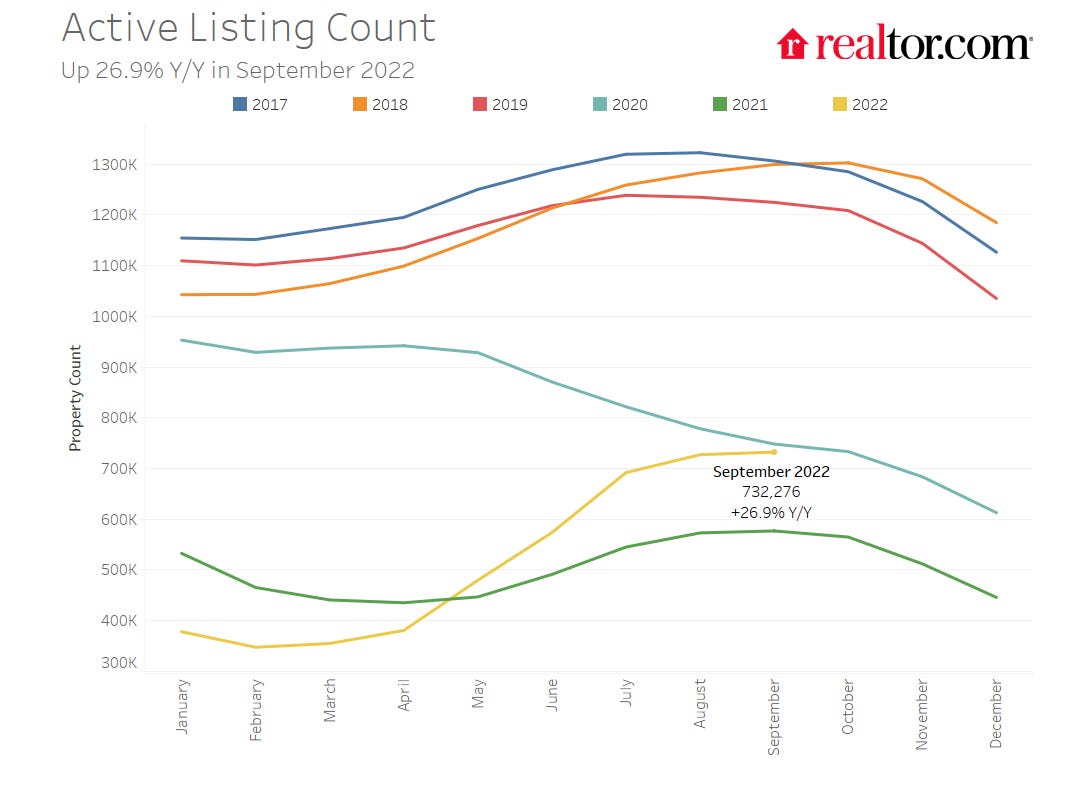
Inventory is low, for the cities and buybox were Opendoor operates looks better, but overall both the inventory levels are lower than the number in 2019 and many previous years. Inventory Levels are still low, trend though is going up
Mortgage rates continue to make new highs. Latest Survey by Freddie Mac has them at an average of 6.95%. Extremely high, the affordability index reported recently by the National Realtors Association is at decades lows. The index by August was at 104, the average person needed an income of $84,000 to qualify for the typical 20% down mortgage. In 2019, before the pandemic, the index was at 160 and it was needed to have $51,000 in income. The rise in income needed has nearly doubled in just 3 years
Transaction in the Real Estate market is definitely down, prices have started to come down. 1.63% MoM is a considerable drop. If that would continue that would be more than 4% per quarter (so far the last 3 month was 2.2% drop). The big question is how long will this continue to take place, when would we see a turn or at least some stabilization in the market? At the moment, this is 100% dependent on the Fed.
The Fed has been aggressive, very aggressive in hiking interest rates. They have done four consecutive hikes of 75 bps and the Fed funds rate today is at 4.0%. The highest in a long time. The Fed could start to slow down the pace of hikes in December with a 50bps hike, that would be at least the start of the end of this hike Cycle, but damage has been done already. With the mortgage rate at 7% the Real Estate market will remain slow.
At the end of the day, it is thought that the Fed might not stop hiking interest until the Fed's funds rate is at least above the inflation rate. This is not the CPI, The Fed uses a different measure, that is PCE. The PCE is still going up, the last 3 quarters it has gone up, last time it was reported it had a 5.1% print, we would be 1.1% away from being at the same level as Feds fund rate. The next few reports of these numbers will be very important, the Fed’s decision to stop hiking will be likely tied to when this number starts showing some signs of going down or that they actually are well above the PCE number.
Opendoor does not necessarily need a high activity market like the ones in 2020 and 2021, they just need stability, they need homes prices to move normally within 2% to 4% a year. With rates at 7% is difficult to expect that prices will not adjust down, affordability is way out of reach for most, the only thing playing in favor of overall price stability is demographics. There are a lot more Millennials reaching Home formation age. The amount of millennials looking for a home will overwhelm low inventory, an inventory that will remain low if there is no big unemployment rise. Inventory will remain low with high rates because having a sub 4% mortgage will start to act as an asset, very few people will sell their home if it means going up from 4% to 7% mortgage rates, even if the new home they buy is the same price as the one replaced. The amount of people with sub 4% mortgage is large, currently about 65% of mortgage holder have a mortgage below 4% ( 24% are 3% or lower, 285K people have mortgages below 2%)
Worst thing that could happen to Opendoor would be a slow 2% to 3% drop in value every quarter. This has to stop for them to reach stability, even flat prices are huge for them considering their availity to play with the spreads.
2023 might be a difficult year, but in terms of where they want to go it is starting to look clear. The 3P product, or market place, is something that if done correctly will definitely change how a home is purchased in the US forever. Buying a home is very time consuming and annoying. Realtors are not the most loved people in the US, but as for now they are a “necessary evil”. If this recently launched marketplace actually takes the home selling process online the opportunity is very large and promising. Yet, what they are trying is very difficult and only time will tell. First, they need to survive well into 2023, so far they look that they are well placed to come out of this phase well. But everything can change very quickly with the Fed and where Mortgage rates are today.
We have updated our models once again, this time we see considerable changes in our assumptions for 2023 and 2024, as well as in our conservative scenario. We became more pessimistic assuming what would happen if we have a continuing Real Estate price drop for the next 3 to 4 quarters. In terms of our most aggressive scenario we assumed big changes for future years. The marketplace if successful should bring a lot better margins, less risk and faster adoption.
Given these changes our base scenario has dropped a little from $16.5 a share in our previous article to $15.4 today. Not a big difference, it is mostly the years 2023 and 2024. Our conservative scenario is the one that has come down the most, from $9.6 per share to $4.3, this is due to a slow consistent drop of Real Estate prices that does not allow them to have any profitability for a long time. The most aggressive scenario actually went up, thanks to the marketplace, went from $27 per share to $33. A lot of that growth is in the second half of a 10 year model. Since it would be when their platform would start to grow exponentially in terms of penetration of the market.
One very big assumption that is taken in all of these models is the fact that the business model is actually scalable and grows and penetrates the market. Without that assumption, which again, is a big one, the value would eventually be zero. But there is no reason to make that assumption in our scenarios since it would be a waste of time since the result would be known from the start. If the business model does not work, there is no business. The year 2022, and most of 2023 will definitely answer that, if they come out of 2023 strong the model can sustain all types of difficult scenarios.
The Content is for informational purposes only, you should not construe any such information or other material as legal, tax, investment, financial, or other advice. Nothing contained on our substack constitutes a solicitation, recommendation, endorsement, or offer by LongYield or any third party service provider to buy or sell any securities or other financial instruments in this or in any other jurisdiction in which such solicitation or offer would be unlawful under the securities laws of such jurisdiction. LongYield participants may or may not hold positions or interests in stocks discussed in this website.
Thanks for reading LongYield! Subscribe for free to receive new posts and support my work.