
Where do Rebounds Come From?
Where do Rebounds Come From?
Answering the question that all parents fear

As someone who prides themselves in having different topics to explore, I found myself in a bit of a writer’s block this week. The Bruins have broken the NHL wins record after victories over the Toronto Maple Leafs and New Jersey Devils at TD Garden on Thursday and Saturday night before setting the record on the road in Philadelphia on Easter Sunday. As witnessed Sunday, they are also getting ready for the playoffs, resting key players as well.. The vibe surrounding the team is one of peaceful celebration as they work to put themselves in the record books while also preparing for the long road ahead. Unfortunately (or fortunately), I’ve found myself encapsulated by the energy, leaving me without much passion to do anything other than take it all in.
As I went to leave the ninth floor on Saturday night, I had to stop and look out at the empty arena as it was my last game of the season. If anyone had told me in August that I would’ve witnessed the Bruins tie the NHL wins record and that I’d have to go home to write for my newsletter, I would’ve called them crazy. But here we are, and I am so grateful.
A conversation resurfaced this weekend surrounding a long-held myth that has been disproven; point shots create rebound opportunities. The first time I remember this theory being debunked is by Ryan Stimson in his article on Hockey Graphs comparing low-to-high and behind-the-net offense in 2016. He says:
To quickly recap: you are more likely to score and generate rebounds by playing behind the net rather than going through the point for offense. There is qualitative data to support this as well, summed up here by none other than the goalie victimized in this series, Jonathan Quick.
At the time Stimson wrote that article, the California teams were good - especially San Jose and Los Angeles. But the two played dramatically different offensive systems. The high-quantity, perimeter play of Darryl Sutter’s Kings lost out to the more methodical, grinding Shark’s the Peter DeBoer was leading.
While the NHL may be a copycat league, not everyone would follow suit of the Sharks, who made their way to the Stanley Cup Final that season. Under Rod Brind’Amour, the Carolina Hurricanes play a chaotic perimeter game, and they play it well. Heck, Darryl Sutter, the losing coach in that series, still plays his team the same way in Calgary. This season, the Flames rank 3rd in their ability to generate unblocked shots, but 7th in expected goals and 8th in actual goals. So despite their high corsi-for percentage which ranks them second in the league, they are going to miss the playoffs unless a miracle happens for them over the next few days.
However, I think coaches are slowly starting to adapt as the numbers help them understand the game they are seeing a bit more. I think back to this article from Alison Lukan discussing the Seattle Kraken’s rebound creation last season. The Kraken had the highest density of low-to-high offense in the league last season, and they weren’t creating the second chance opportunities that they wanted to. The language surrounding how Hakstol aimed to fix this caught me off guard.
The percentages may look pretty good, but I just don't know if we're giving ourselves enough opportunity to be inside for those rebounds. By that I mean that I think we can shoot the puck more entering the zone, initially in the offensive zone. We're still turning down too many shots, in my opinion, or missing the net on some of those first initial shots. That reduces your opportunity to get inside for seconds and rebounds.
Lukan’s ability to get quotes like this is invaluable. The way that I perceive what Hakstol was saying here is that the Kraken’s forwards were not creating enough shots off of the rush, or when the opponent would otherwise lack in structure. Once the opponent was set up, the Kraken weren’t skilled or creative enough to create high-quality chances. The low-to-high play was a symptom of poor play elsewhere, not by design.
While the Kraken have a similar roster to last season, lacking in high-end skill, they lead the league in 5-on-5 goals-for per 60 minutes. This is partially due to luck, but also due to a strong focus on counter attacks and creating offense off the rush (something Lukan has been stressing in her coverage all season as well).
Back to the topic of the article, where have the Bruins created rebounds from this season? Using the NHL’s play-by-play data, we can create a proxy for this. While every shot here may not be what we would collectively refer to as a rebound, my definition is a Bruins unblocked shot within 3 seconds of a Bruins shot on goal. This leaves some room for variance in timing from the manual trackers.
For some, the saying is, “The proof is in the pudding.” In reality, the proof is in the ggplots.
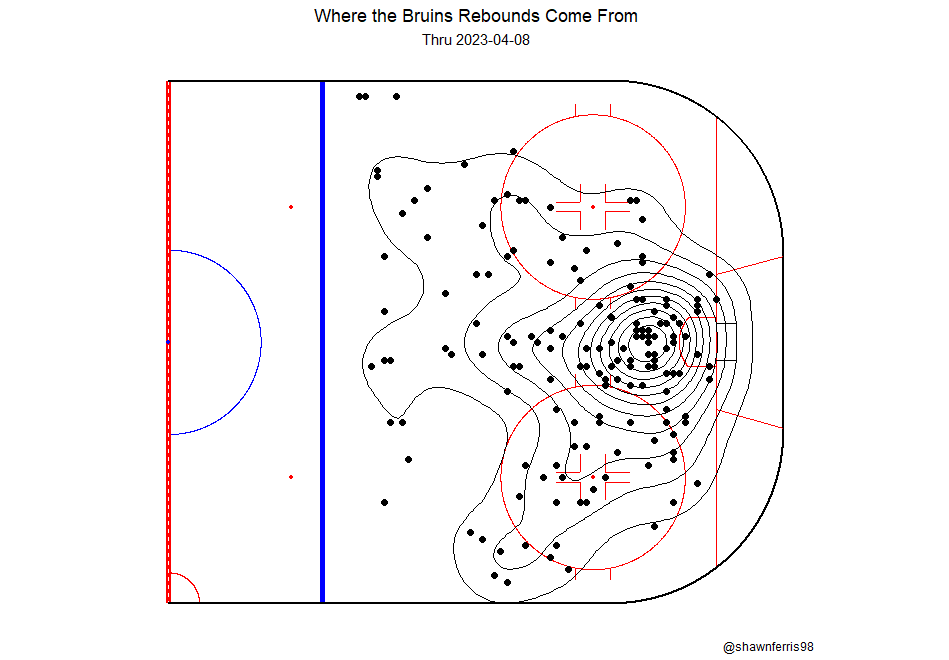
As you see, the majority of rebounds are created from shots inside of the home plate area. Those shots are much more difficult for the goaltender to handle, and probably signal some means of a loosened defensive structure than can be taken advantage of. I’m not sure if there is anything to the slight bias to the right side of the ice, or if that is just random given the small dataset.
Here are your top rebound creators on the team as well:
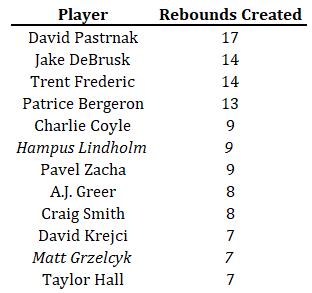
As you see, the list is mostly forwards. AJ Greer is Craig Smith stick out with 8. Greer only had 57 shots saved, while Smith only 44. That’s a 14% and 18% rate of rebound creation. Meanwhile, Connor Clifton who had 80 shots saved, only created rebounds at a rate of 5%.
Hopefully this was insightful. With playoffs beginning next week, I’m sure there will be plenty to talk about. See you then.