

Something Wicked This Way Comes

Double, double toil and trouble:
Fire burn, and cauldron bubble.By the pricking of my thumbs,
Something wicked this way comes.
MacBeth, Shakespeare
Fitting this seemed as I watched the fog swirl up through the trees, cloaking the mountains of Appalachia on this morning filled with seasonal foreboding and frightening tales from at home and abroad.
Awaking to the news of the Japanese removal of the 1% yield cap seemed ominous and to signal yet another inflection in our travels through the cosmic soupiness. The dollar wrecking ball and 10-year treasury yield have been wreaking havoc behind the scenes while many watch the stock market for signs of toil and trouble. I would argue these moves in the bond market are far more important to watch.
What does it mean? I can’t tell you for sure, but by removing this cap Japan has more flexibility in its decisions to buy or not buy bonds. Some fear that this could bring Japanese investors back home, roiling our bond markets even further. As we started the year, this was one reason I wasn’t so sure we would see rates drop like the housing bulls believed. But, what we do know for sure is that this brings another level of uncertainty about what comes next in an already spooky time in the shadow banking system.

Not a fan of Shakespeare? Perhaps Ray Bradbury’s novel recounting the misadventures of two adolescent boys when Cooger & Dark's Pandemonium Shadow Show comes to town is more your jam. Either way, I think you get my drift. Many of us can feel it, the foreboding, but can’t put our finger on it exactly, even when there is so much going on from which to choose.
But what about the uptick in home prices? Any celebration or depression on that front should be quickly eschewed as we can already see from more recent data (Redfin) home prices are starting to come down again in many key markets. Case Shiller is a reputable indices, but a lagged one. Today’s announcement is for August data and is yet another data point in a sea of data points that make the path incredibly hard to discern.
Lest we get confused in the funhouse, we must remind ourselves of some rather harsh realities:

The YOLO consumer keeps spending - perhaps as a last-ditch effort to forestall what’s ahead - but many are struggling with increased insurance, property taxes and debt service cost. The real fear of foreclosure or homelessness looms for many as it becomes increasingly difficult to stay afloat.
Fanning the flames, scary tales of increases in foreclosure filings haunted our newsfeeds last week. The bulls pointed out the low levels, while many of us bears asked how could this be?
It seems almost impossible we would have any foreclosures at all with all of the programs - state and federal - that worked to ensure no one lost their home during COVID. Believe it or not there are still state funds that have not been spent. I would caution anyone who thinks this will escalate quickly to beware the very significant regulatory changes after the GFC which make foreclosure much more difficult and time-consuming. We have turned page one of the prelude of what will be a Tolstoy-long novel.
For those of you who don’t remember or were too young to remember, the foreclosure crisis became the boogeyman of the GFC. In fact, instead of banks getting in trouble for speculative lending, they instead paid the price through the Consent Orders and AG Settlements borne out of accusations of improper foreclosure handling as they buckled under the increase in default expenses. At my company we somehow found a way to pay for a marketing campaign to re-brand GMAC Bank to Ally, but did not have enough money to ensure that there was enough operational staff to handle and help the deluge of prime borrowers that were unable to meet their mortgage obligations.
My company was not innocent, but I always found it a bit odd that it was the servicers that really bore the brunt while mortgage lending was pushed out to the nonbanks with new rules but also with some of the old players who never really paid the piper. As I’ve noted here before the Origination side of things is not really friends with the Servicing side of things (there would be actual fist fights at the local pub). But public whippings became the order of the day. A (not) funny case I recall was when New York’s largest default attorney firm, Steven J. Baum, decided it would be a good idea to throw a foreclosure-themed Halloween party and dress up as homeless people:

Not good. But the reality of this situation is a lot more complex than most want to admit. Many think of It’s a Wonderful Life when they think of foreclosure. It does not look anything like that anymore. To understand what the banks and now non-banks face you have to understand that foreclosure is a legal process that requires in many states attorneys to process these filings. But, as my former General Counsel used to say - there are “attorneys” and then there is default counsel. What did she mean? Let’s just say these firms were not staffed with the best and brightest. There were exceptions, but most were filled with low-paid staff, including the licensed attorneys. Add on top of that the milestone billing that the GSEs enforce and the struggle is real. With milestone billing you only get paid at certain milestones of the process like Complaint filing in a judicial state. It can take hundreds of hours to reach that stage before they get paid. So, the firms are always overwhelmed and understaffed.
Each of the servicers who service GSE and GNMA loans have to have a preferred attorney network which is comprised of at least two firms in each state to handle the actions. Sounds semi reasonable right - hire local experts to handle the matters versus keeping 100 attorneys on staff? The problem then and now is that the attorney-to-file ratio was very low. Firms outsourced to India or used very low-skill workers to do some of the more administrative work just as the servicers had done. Consequently massive delays and mismanagement were the order of the day.
Faced with threats from the GSEs to pull our servicing and jeopardize the GMAC auction we were told by Fannie and Freddie we had to reduce our seriously delinquent population. Yes, the government sponsored entities were threatening to cause harm to our employees and investors if we did not speed up foreclosure while we were still paying the FRB and the AGs penalties for trying to push foreclosures.
Consequently I went on the road and spent much of 2012 and 2013 in these attorney firms realizing that you just can’t Henry Ford a legal process, not effectively. Each state is a maze of noticing, mediation and service requirements that require real, specialized knowledge to traverse. That knowledge barely existed back then and it is much worse now as the firms caved under the expense and consolidated to national firms, losing a lot of the actual state expertise.
What did the firms do during COVID? They barely survived, utilizing PPP loans, but many died an inglorious death. What the firms and the servicers did not do was implement technology to ensure efficient and quality servicing - they didn’t have the money or the will. At best they instituted bubblegum and popsicle stick solutions to hobble through - all of which will completely fail under any increase in volume. There are a handful of servicers who will tell you they have great technology. Tell them you want to look under the hood as at most it is a slick veneer on top of crappy technology.
Why all the useless information, Mel? For anyone who thinks that this process will happen quickly and efficiently, please pay attention. In Louisiana it currently takes over 3,000 days to foreclose. And, this is before the state AGs get involved to interfere with the process like they did last time. During my day we easily saw foreclosure actions that had been ongoing for well, well over five years. In those cases you can run into Statute of Limitation issues as well. This may sound like a great thing for people who need a home, but the sad reality is that many of these cases are bad for both the borrower and the company causing so much stress as borrowers are unable to meet the modification requirements instituted by the GSEs, FHA/VA, etc.
But, what of the fraudsters and investors? You may have wondered about the sign above that the costumed homeless person holds and its reference to a third-party squatter who claims they didn’t get service of process (think, You’ve Been Served). When those investors walk away from the properties, you often get into all sorts of crazy situations around vacant properties that include squatters - some of which know exactly what they are doing. The GSEs allow you to speed up the process for vacant properties abandoned by (usually) investors or homeowners in hopes of preventing these types of situations which brings us to headlines like this:

In addition to expedited foreclosures on vacant properties, business purpose loans (think DSCR) are not covered by the CFPB so will take less time (small % of the market). But I also believe the counties will bear more of the burden this time as investors walk away from those properties purchased with all-cash which were not mortgaged, leaving unpaid tax liens behind.
No matter which way you look at it, foreclosure is a horrendous and costly experience for all involved. There are hardly ever any good outcomes. And, for those who have fond memories of the government modification programs, many argue they really didn’t help at all. We were often forced to evaluate the same borrowers over and over again for the same solutions by the FRB even when we knew the borrower would be denied, causing additional heartache to borrowers.
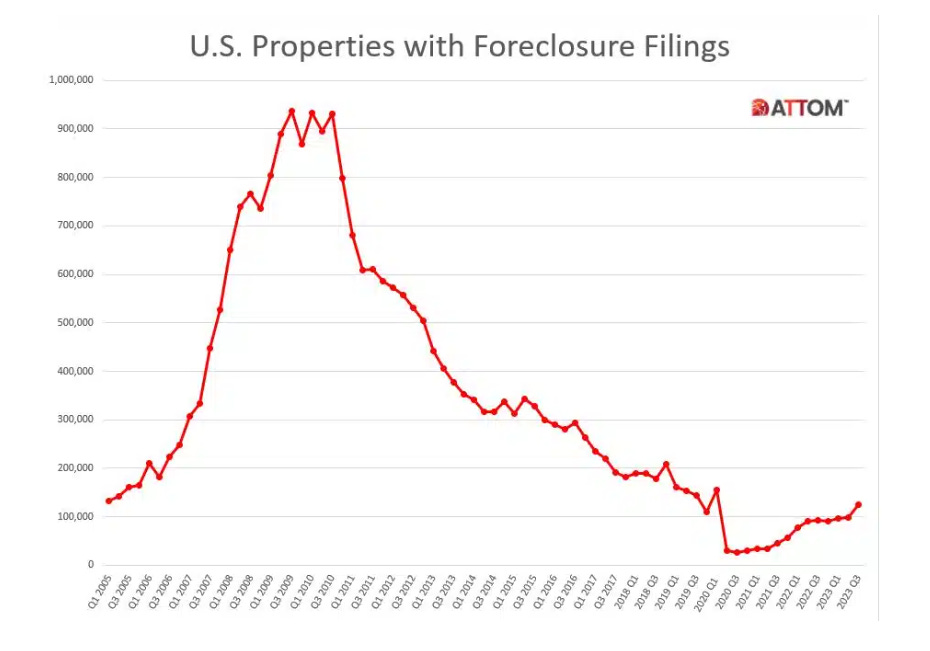
So, where are we? According to ATTOM there “were a total of 124,539 U.S. properties with foreclosure filings in the third quarter. That figure was up 28 percent from the previous quarter and 34 percent from a year ago.”
Texas (fastest foreclosure process in the nation), Florida, California and New York were the stars of the last show and will be stars again.
But, put another way, nationwide
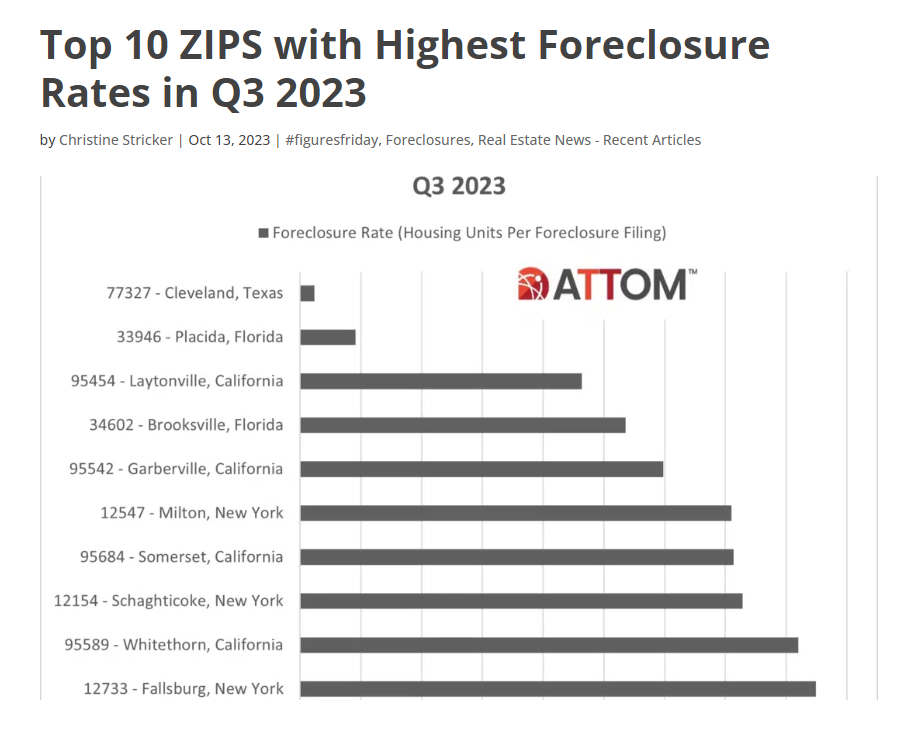
One in every 1,121 properties had a foreclosure filing in Q3 2023. The report noted that states with the highest foreclosure rates in Q3 2023 were New Jersey (one in every 595 housing units with a foreclosure filing); South Carolina (one in every 730); Delaware (one in every 739); Nevada (one in every 763); and Maryland (one in every 780).
The report also noted that among 223 metro areas analyzed in the report, those with the highest foreclosure rates in Q3 2023 were Houston, Texas (one in every 371 housing units with a foreclosure filing); Atlantic City, New Jersey (one in every 453); Cleveland, Ohio (one in every 459); Bakersfield, California (one in every 465); and Columbia, South Carolina (one in every 503).
Whether we look at home or abroad, it indeed feels as if something wicked this way comes. With so much wickedness afoot it is important we discern the true nature of the goblins hiding in the shadows of our housing sector and global monetary system versus becoming embroiled in moral outrage. Don’t get me wrong, there is much to be outraged about, but had we understood the crisis better last time versus the narrative perhaps things could have turned out differently and the GSEs wouldn’t have gotten away with selling our homes to Wall Street. All I ask is that we stay frosty, validate our assumptions and beware the funhouse mirrors and efforts to confuse - the only way forward through this mess is together.
Happy Halloween All! May yours be safe, devoid of tricks and full of fond memories.

Top 10 Cities with Foreclosures According to RealtyTrac
(Includes pre-foreclosure (just breached), auction and bank-owned assets)
Philadelphia 6,003
Miami 3,833
Westchester County 3,670 (also in top 5 for highest ADR for 22 and 23)
Chicago 3,355
Las Vegas 2,180
Rochester 2,082
Cleveland 1,779
Pittsburgh 1,570
Orlando 1,508
Houston 1,209
Listings for Sale
Of the 71 cities I track 33 had week-over-week inventory increases (down from 49 last week). I’ve noticed that listings tend to stay the same or drop at the end of the month and then rebound the first week of the month. In aggregate, listings for sale were flat week-over-week, but up 5.31% to the 16-week average and 20.10% compared to start (January).
Top Cities with Largest % Increase in Inventory Week-over-Week (10/22-10/29):
Brattleboro 6.9%
Portsmouth 4.60%
Encinitas 2.89%
Cape May 2.38%
New York 1.75%
Top Cities with Largest % Increase in Inventory Compared to 16-week Average (10/22-10/29)
Bakersfield 41.90%
Portsmouth 22.85%
Seattle 14.72%
Palm Springs 14.57%
Cape May 14.44%
Top Cities with Largest % Increase in Inventory from Start (1/1/23)
San Francisco 102.36%
San Ramon 101.67%
Bakersfield 84.53%
Couer d’Alene 72.80%
Denver 67.18%
Seattle 61.01% (back in the top 10!)
San Jose 50.14%
Salt Lake City 50.63%
Galveston 47.60% (back in the top 10!)
Boston 47.04%
*Austin BARELY kicked out of the top 10 (44.76%), but yeah
Honorable mention - Dallas 45.58%
Top Cities with Highest % Increase of Single-Family Rental Listings (10/22-10/29)
Listings for rent were down slightly by .71% week-over-week, but up compared to the 16-week average by 6.49%.
Portsmouth 12.00%
Sevierville 9.52%
San Ramon 6.38%
Destin 5.97%
Rosemary Beach 3.85%
Top Cities with Highest % Increase of Single-Family Rental Listings to 16-week Average
Cape May 134.78%
Rosemary Beach 72.95%
Sevierville 42.27%
Galveston 34.04%
Destin 19.66%
Top Cities with Highest % Decrease of Single-Family Rental Listings to 16-week Average (10/22-10/29)
Boston -16.96%
Wexford County -15.63%
Cleveland -14.07%
Bentonville -10.96%
Denver -10.24%
Top Cities with Highest Decreases in Occupancy for September Year-Over-Year (RealPages)
*Important to note that all the cities with occupancy information available on RealPages showed decreases in occupancy when compared to last year
San Antonio -2.32%
Boise -2.30%
Indianapolis -2.06%
Atlanta -1.94%
Augusta -1.87%
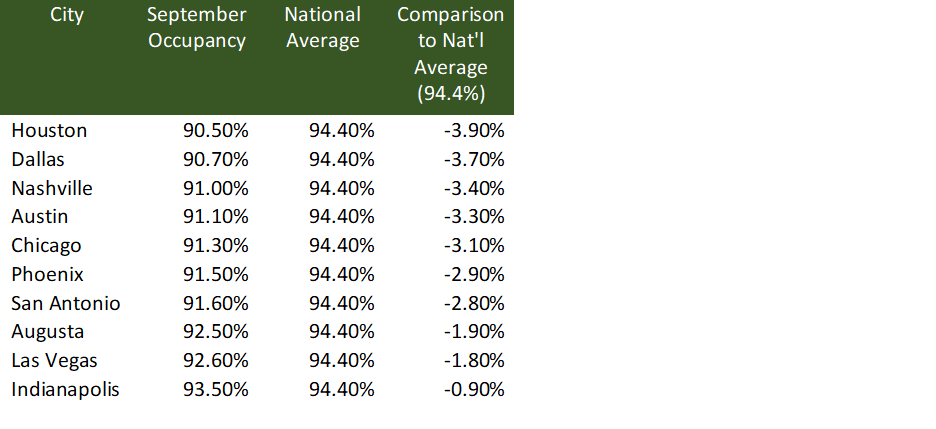
Top Cities This Month With Highest Negative Variance to Average Occupancy for the Month of September
Airbnb/VRBO - Short-Term Rental
Top Cities with Biggest Decrease in Airbnb Average Daily Rate Week-over-Week Compared to 16-Week Average
Average daily rates were down on average -4.32% week-over-week and -16.77% compared to their 16-week average
Rosemary Beach -55.65% / M-O-M -5.62% / Y-O-Y -3.92%
Destin -45.37% / M-O-M -8.72% / Y-O-Y -12.69%
Chicago -39.16% / M-O-M -4.84% / Y-O-Y -11.17%
San Francisco -32.89% / M-O-M 1.21% / Y-O-Y -.40%
Portsmouth -31.94% / M-O-M .73% / Y-O-Y 2.17%
Commercial Real Estate (CRE)
One of the recent big head scratchers is the announcement by the White House they will provide funding for commercial real estate conversions. We have learned these are especially hard to pull off, so it seems like yet another way to provide assistance to the struggle CRE sector without calling it a bailout. Get ready for more of this to come.
And if none of what I said above was scary enough for you, check out this maturity schedule from the latest Trepp report:
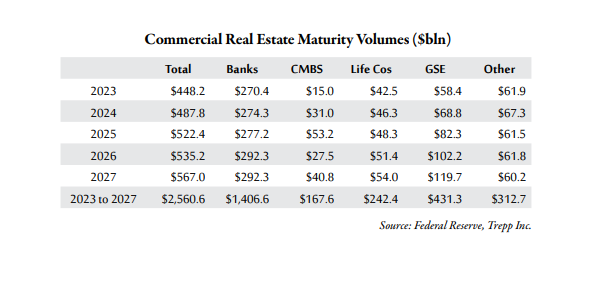
The money and the music has stopped for Commercial Real Estate. Unfortunately, our talking about it is really just beginning which seems odd since we have been talking about it for a very long time already.
Reference from Last Week
Top Cities with Highest % Decrease in STR Listings Year-Over-Year
September listings for short-term rental were up 13.28% compared to September 2022, while Average Daily Rate was up 0.47% and occupancy was down-0.87%.
*Telling that only 2 cities had year-over-year decreases in listings
Fort Myers -37.49% (Ian)
Westchester -11.11%
Top Cities with Highest % Decrease in STR Listings Month-Over-Month
Westchester -20.00%
Hoboken-14.24%
Indianapolis -9.05%
New York -8.54% (AirDNA uses a 3-month average, so this will come down significantly)
Missoula -3.62%
Top Cities with Highest % Decrease in Average Daily Rate (ADR) Year-Over-Year
Fort Myers -22.56%
Palm Springs -15.32%
Destin - 12.69%
Scottsdale - 11.40%
Chicago -11.17%
Top Cities with Highest Average Daily Rate - September 2023
Westchester $951.56
Newport Beach $765.06
Rosemary Beach $733.34
Cape May $665
Encinitas $611.72
Top Cities with Highest Average Daily Rate - September 2022
Rosemary Beach $763.23
Newport Beach $750.16
Palm Springs $704.31
Cape May $648.42
Westchester $558.47
Redfin Monthly Updates
Top 10 Cities with Highest % of Homes with Price Drops for September
Indianapolis 50.30%
Denver 47.90%
Salt Lake City 43.70%
Portland 43.10%
Boise 42.60%
Winter Garden 41.70%
San Antonio 40.30%
Sacramento 39.60%
Austin 39.00%
Carlsbad 37.90%
Top Cities with Largest Drop in Median Sale Price M-O-M
Palm Springs -29.22%
Sevierville - 21.04%
Sedona -16.41%
Brattleboro -12.73%
Tampa -9.78%
Top Cities in Florida with Largest Drop in # of Homes Sold M-O-M & Corresponding Y-O-Y
Winter Garden -34.72% / Y-O-Y -26.60%
Fort Myers -17.80% / Y-O-Y +4.90%
Miami -15.35% / Y-O-Y -16.20%
Fort Lauderdale -12.50% / Y-O-Y +4.08%
Tampa -11.00% / Y-O-Y +10.40%
Top Cities with Largest Drop of # of Homes Sold Y-O-Y
San Ramon -47.30
Portsmouth -37.50
Hoboken -37.20%
Rosemary Beach -35.70%
Cape May - 35.30%
New York - 32.20%
Raleigh - 30.70%
Stamford -30.70%
Sevierville - 29.60%
San Jose -29.50%
I just want to say I really appreciate your work and it is clear that you really know your stuff. When you move to a paid subscriber model I plan to be one of your first paid subscribers!
Thank you for the great work you are doing! I listened to your interview with Adam Taggart on the Wealthion podcast. I’m wondering what your suggestion would be to someone who is considering EITHER to stay in their paid off home in an HOA neighborhood, OR go into seven figure debt to purchase some land to farm and raise animals.