

Weirdo calls for 68% fall in stocks!
Weirdo calls for 68% fall in stocks!
S&P 500 targeting 1,540-ish (that's -65% from current levels)

Oh boy! I’m on a roll with this recession shit.
You remember my last post when I showed a bunch of evidence for currently being in a recession, and the time before that I did the same. Well, this time I’m doing just a little bit more of the same, but then - sort of like eating leftovers - I’m throwing everything into the same pan and making a meal out of it.
What’s new?
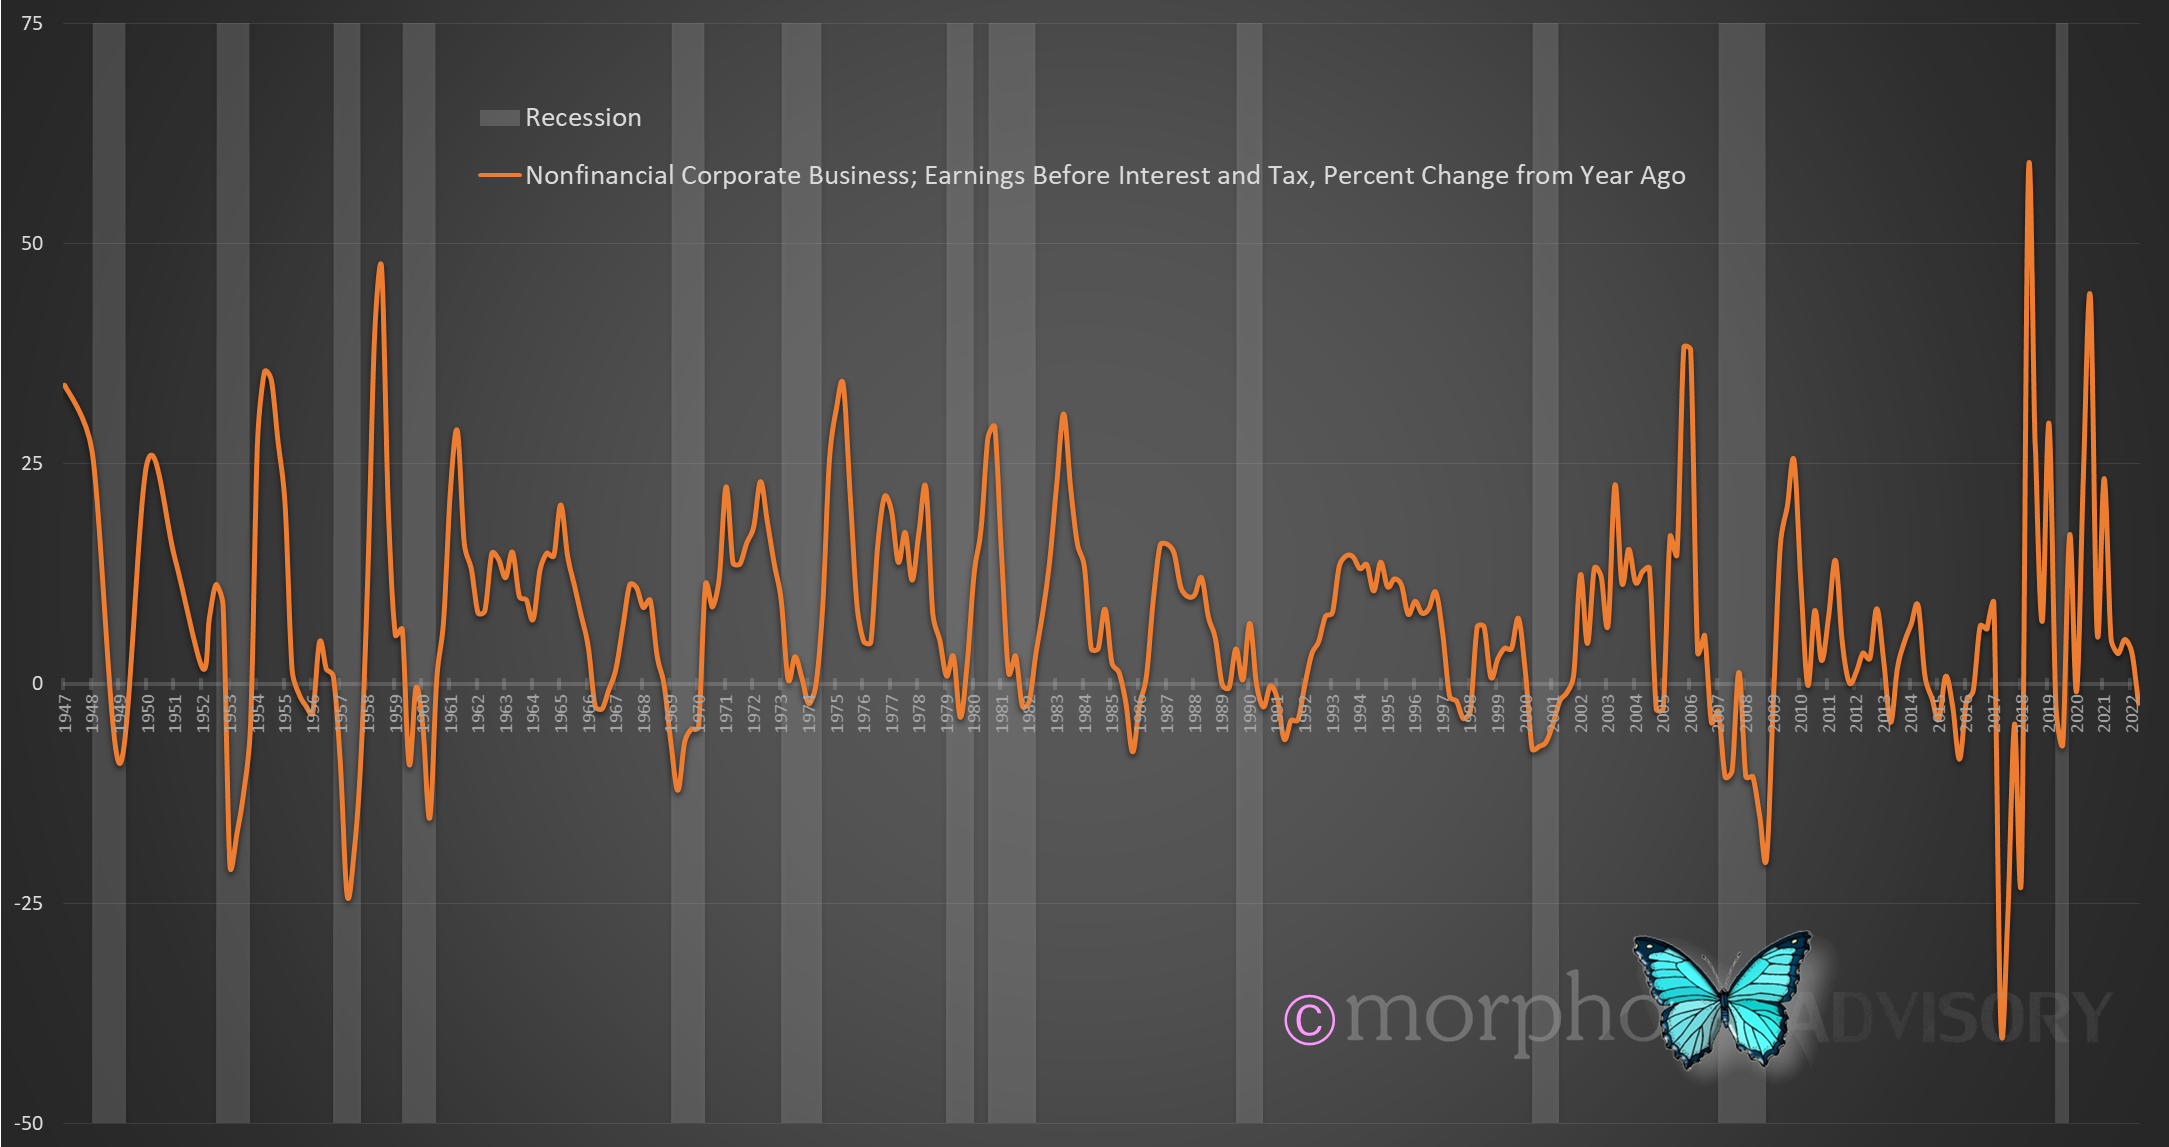
In the previous posts, we saw a whole bunch of data showing that the economy is taking a dive. I found that corporate earnings are showing the same pattern.
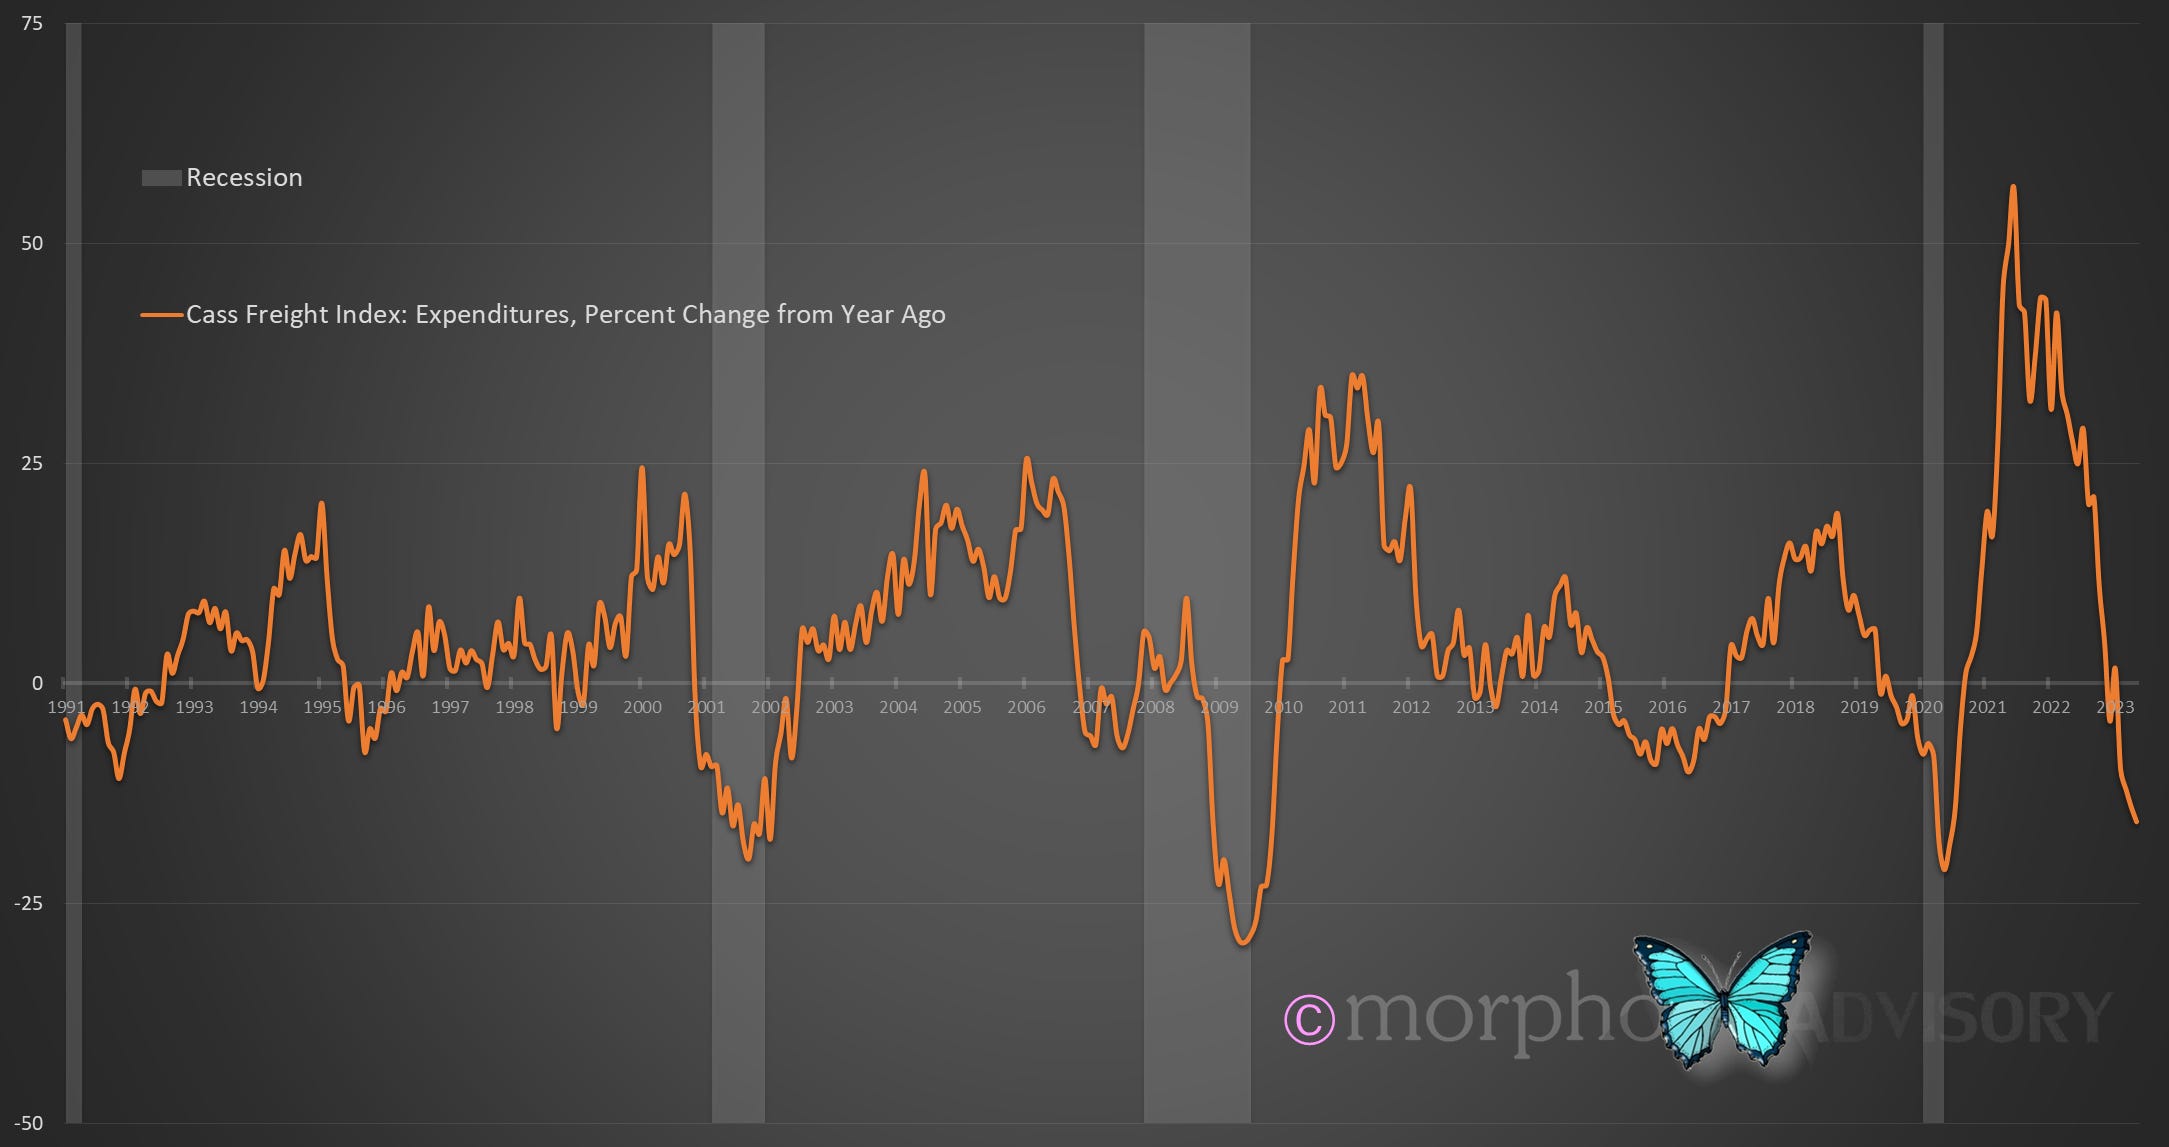
Additionally, freight is seeing the same pattern, both in the number of shipments, but more importantly in the money spent on shipping.
And of course, that got me thinking. “Hey! Seeing as we have multiple series of data that span the full gamut of the economy, what if I do that thing like I did for the manufacturing indices? I could convert all these measures into year-over-year percentages and aggregate them into a single measure of economic cyclicality.”
Here’s the individual data series, which makes for a messy chart:
And here’s the signal in amongst all that noise …
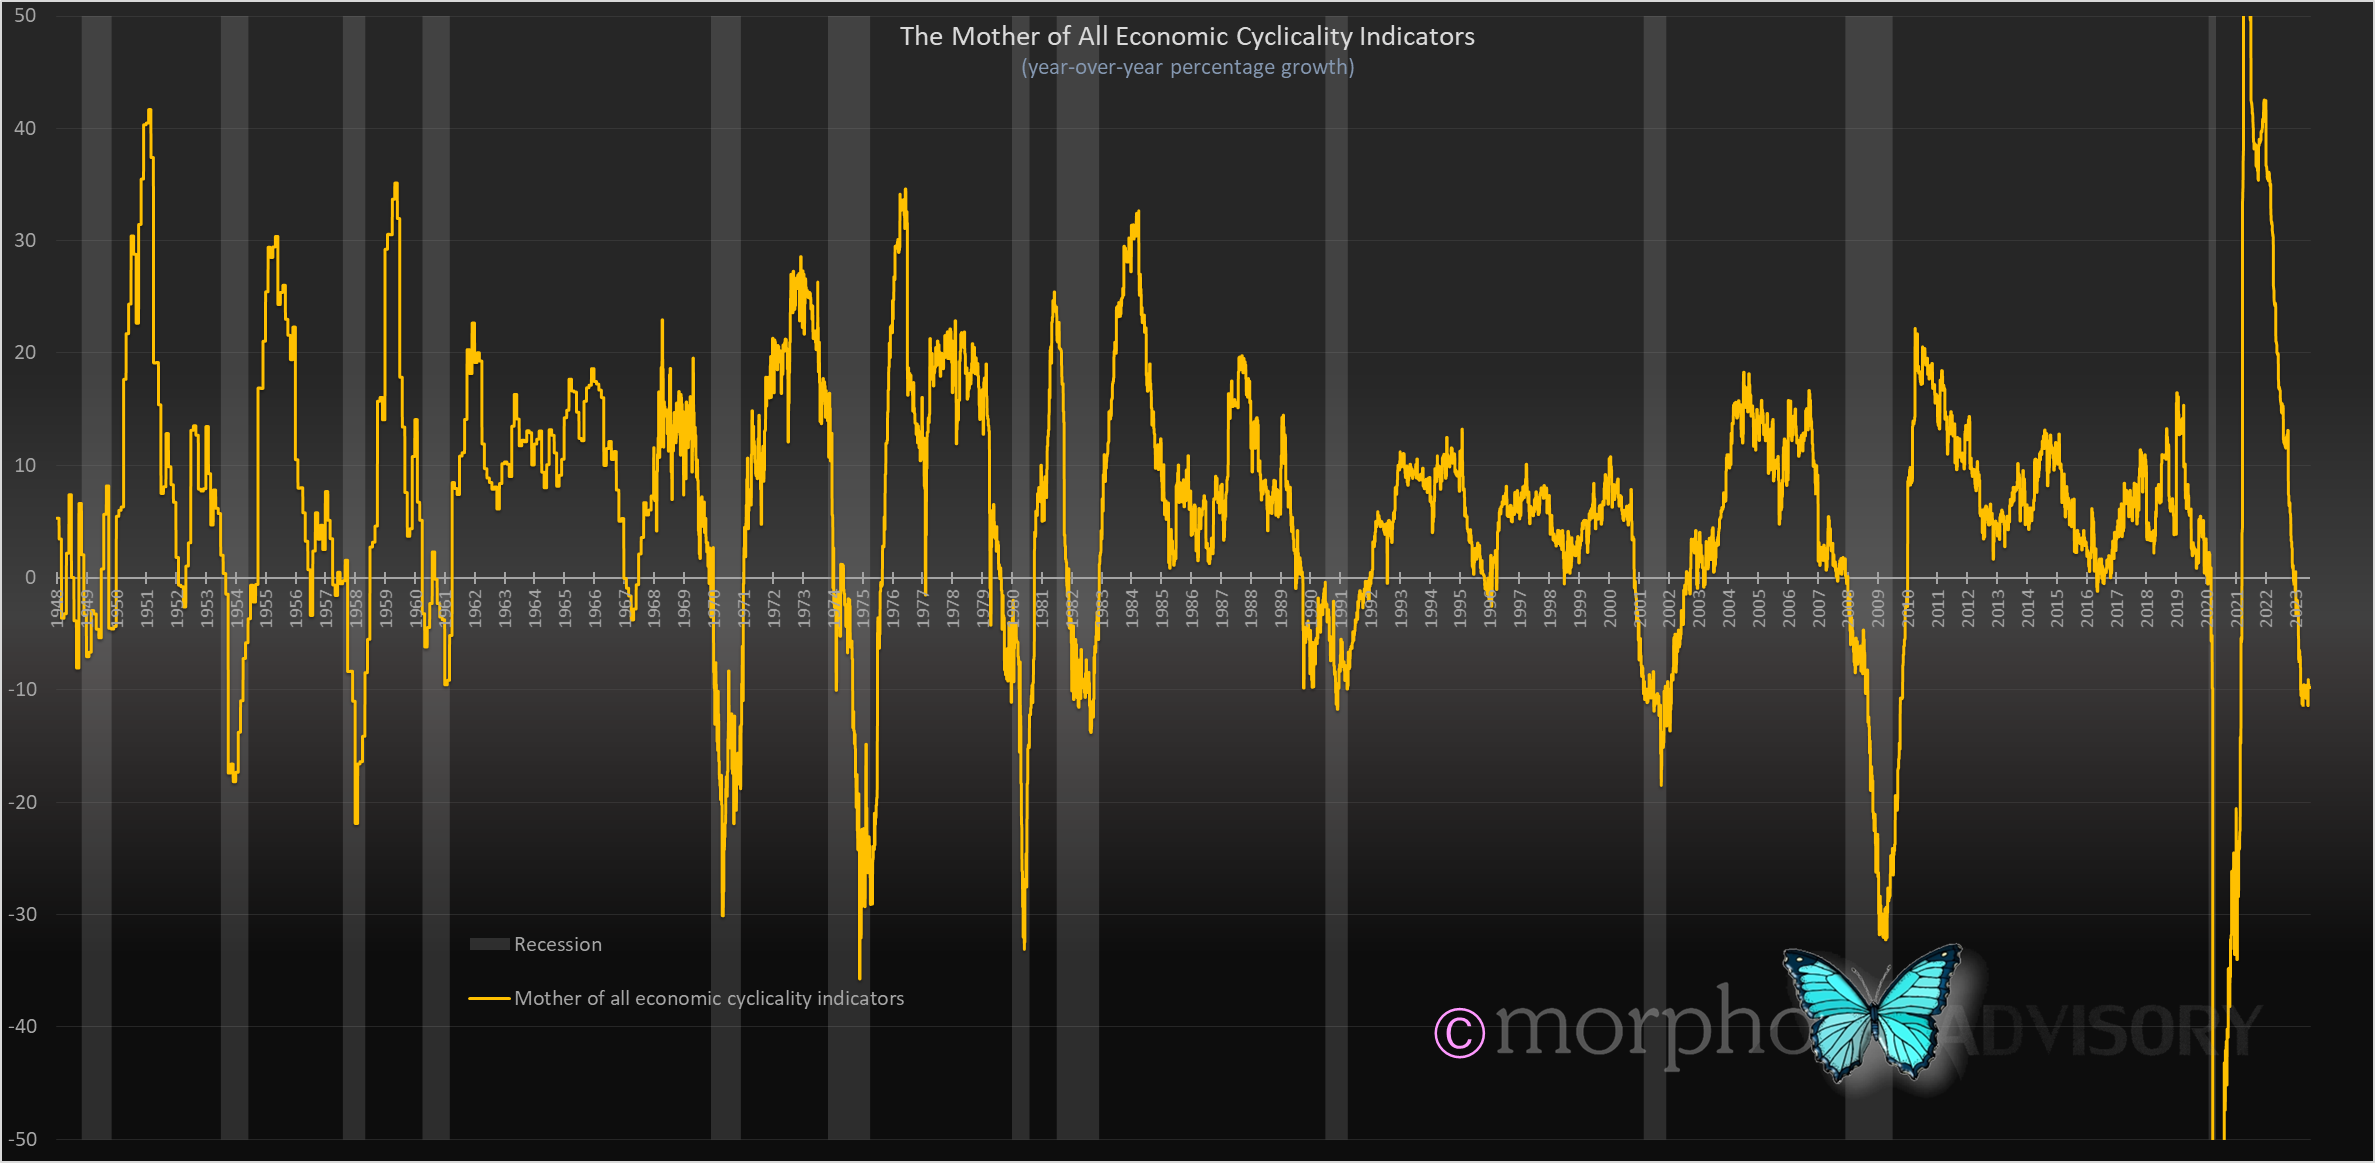
To summarize the various parts of the economy that went into making this measure of economic cyclicality and show you the breadth of the current downturn (with EVERY one of them currently reporting a negative year-over-year value), here’s what’s in the mix:
Real retail sales
Manufacturing indices
Freight expenditures
Job openings
Job postings
Initial claims
Corporate earnings
Government tax receipts
That is extensive. From households to businesses to government; from spending to shipping to earnings to tax … to jobs.
But what does that mean for the market?
That’s the $64,000 question.
A recession doesn’t always mean a large fall in stocks, and we’ve already experienced a larger drawdown in the current cycle than during some recessions.

This is when it requires broader thinking than the sort you’ll find lying around on your typical Wall St. ‘macro’ professional person’s social media feed.
You’re too normal for your own good
I’ve rambled about narrative based market interpretations in the past and how it’s the prevailing asset management industry modus operandi.
Essentially, prevailing interpretation methodology employs linear thinking and is distorted by culturally “normal” people. Normal behavior is shaped by the human propensity for social acceptance and so there is a natural resistance toward making statements that would make one appear like a social oddity, or extreme by conventional standards. As such, “professionals” will make forecasts that are not too far from current market levels and also not too far from peer forecasts. One of the benefits of being ‘on the spectrum’ is that it allows me to think in a manner than is less inhibited by social norms. And because a socially distorted outlook holds less meaning, I tend to look more objectively and use data (information) rather than seek to retain a cultural or social sense of belonging - something I’ve never experienced.
Side note:
Conformity just means you’ll experience the same outcome as everyone else and the people who manage your retirement savings take comfort in that because they can use it as a defense in down markets - “everyone else was doing it”. Because of this natural ‘hedge’, which again is part of that social acceptance thing, there is no incentive for asset managers to change their investment approach and step away from the comfort of the crowd … or maybe look to improve their service offering to deliver better outcomes for their paying clients.
In summary, linear thinking and social acceptance tendencies are gonna get ordinary people in trouble because the industry’s social incentives are at odds with their client’s financial objectives.
Rational linear thinking cannot take current macroeconomic data and the economic behaviors of individuals and corporates and equate that with a call like a 68% fall in the S&P 500. It doesn’t sit well with the rational mind.
Then how come I can come up with such a call as the S&P 500 falling by 68% from its all-time-high (that’s about a 65% fall from current levels)?
The non-linear relationship between economic cycles and a subsequent market reaction reflects underlying structural factors. Our economy is speculative in nature predicated upon asset values and powered by leverage. When asset prices fall, they fall in relationship to the amount of structural leverage employed in support of those asset prices.
I have data to prove it, which I posted with explanations (and behind a paywall) in the following locations:
Here’s an updated chart for my besties …