


Macro Dystopia
Macro Dystopia
What happens when secular economic forces disrupt the natural cyclical flows of the economy - is it enough to create a new standard?

Introduction
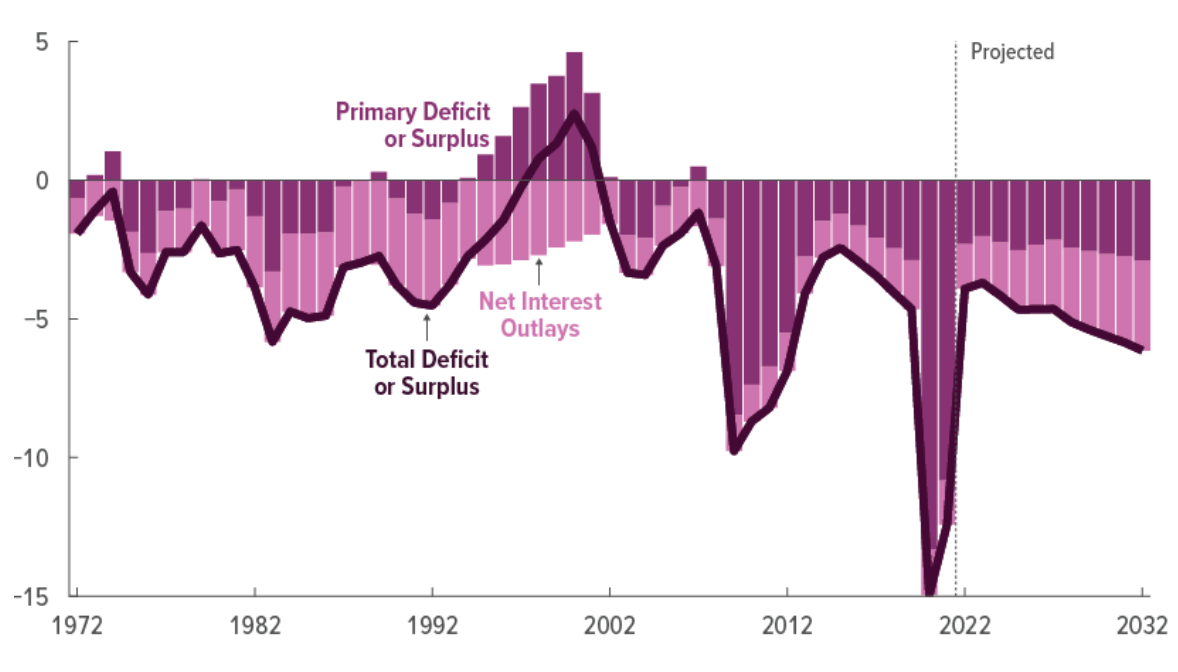
Over time, as governments ignored the inevitable, the organic stream of revenue fell short of their expenses. Now, they are doomed to operate in a perpetual deficit moving forward. We are on route towards paying $1 trillion dollars in interest on outstanding public debt on an annual basis (figure 1.0).
But how exactly did the deficit escape our grasp? What environmental outcomes emerge from the seemingly inescapable debt burden?
These are questions I felt needed answers.

Let’s tackle a frequently asked question - Why not just issue more debt?
A question I also initially pondered upon when examining the details of this debt beast. When debt is not properly allocated and utilized, the burden of debt compounds and outpaces the natural growth of the economy. By nature, debt should have positive effects on the economy, yet we have misallocated the borrowed funds and ignored the fundamentals. It may seem almost too simple, but in reality, the fluid state of business cycles very much depend on how well we are able to facilitate this conversion of fuel (debt) into production output (GDP).

The problem here is that we have already surpassed the debt-GDP threshold. In other words, the ability for debt to have a positive outcome. Salmon (2021) reviewed over 40 studies and found a nonlinear debt threshold - reaching above this threshold would disrupt the natural growth cycles in the economy. According to the study, as little as 60 percent (debt-GDP) could be enough to kickstart the slowdown of productivity (Salmon, 2021). In the US alone, the public debt has amounted to 119% of GDP (figure 2.0).
In addition to the excess debt, we also have weak demographics. These are the longer term signals that EPB research defines as secular - gravitational forces that conduct the trajectory of the short-term business cycle. Today, these metrics are causing progressively longer downturns and shorter upturns.
According to Eric Basmajian of EPB research, the 4 major corners of the business cycle (Income ←→ Consumption ←→ Production ←→ Employment) can be best represented by looking at the growth complex below (figure 3.0). In line with Salmons initial claims, the complex is spending a greater duration of time below the 10y trend line (57% spent below 10y rolling mean).

If we narrow in at the aggregate measure of the business cycle complex (figure 4.0), in addition to spending less time above the 10y trend line (yellow shaded area - 43%), it is also evident that we have been operating consistently further below the average trend since 1949 (red line). This is especially true for the period after the 90’s which saw a significant sweep of productivity.

The stats presented in figure 4.1 compliment the aggregate growth composite. There is a clear decline when comparing each decade (quarterly measured). The decade of the 90’s did manage show some duration, albeit being barely above the mean and still portraying lower than the average when compared historically.

Are we surprised? In the US, the total estimated public- and private-debt in aggregate has peaked twice in the last decade and made historical highs (surpassing 300% debt-GDP). This depicts exactly why the FED is projected to operate in a deficit as they move forward.
The 1940’s were able to use financial repression as a way to monetize the debt problems - can we not do the same today ?
With government debt levels being this high in so many advanced economies and austerity policies being the unpopular choice of action (at the cost of votes), financial repression seems like a viable decision. However, let’s glance at a recent but analogous time in history when financial repression was used to ease the debt burden. This in part should give us more intel into what lies ahead.
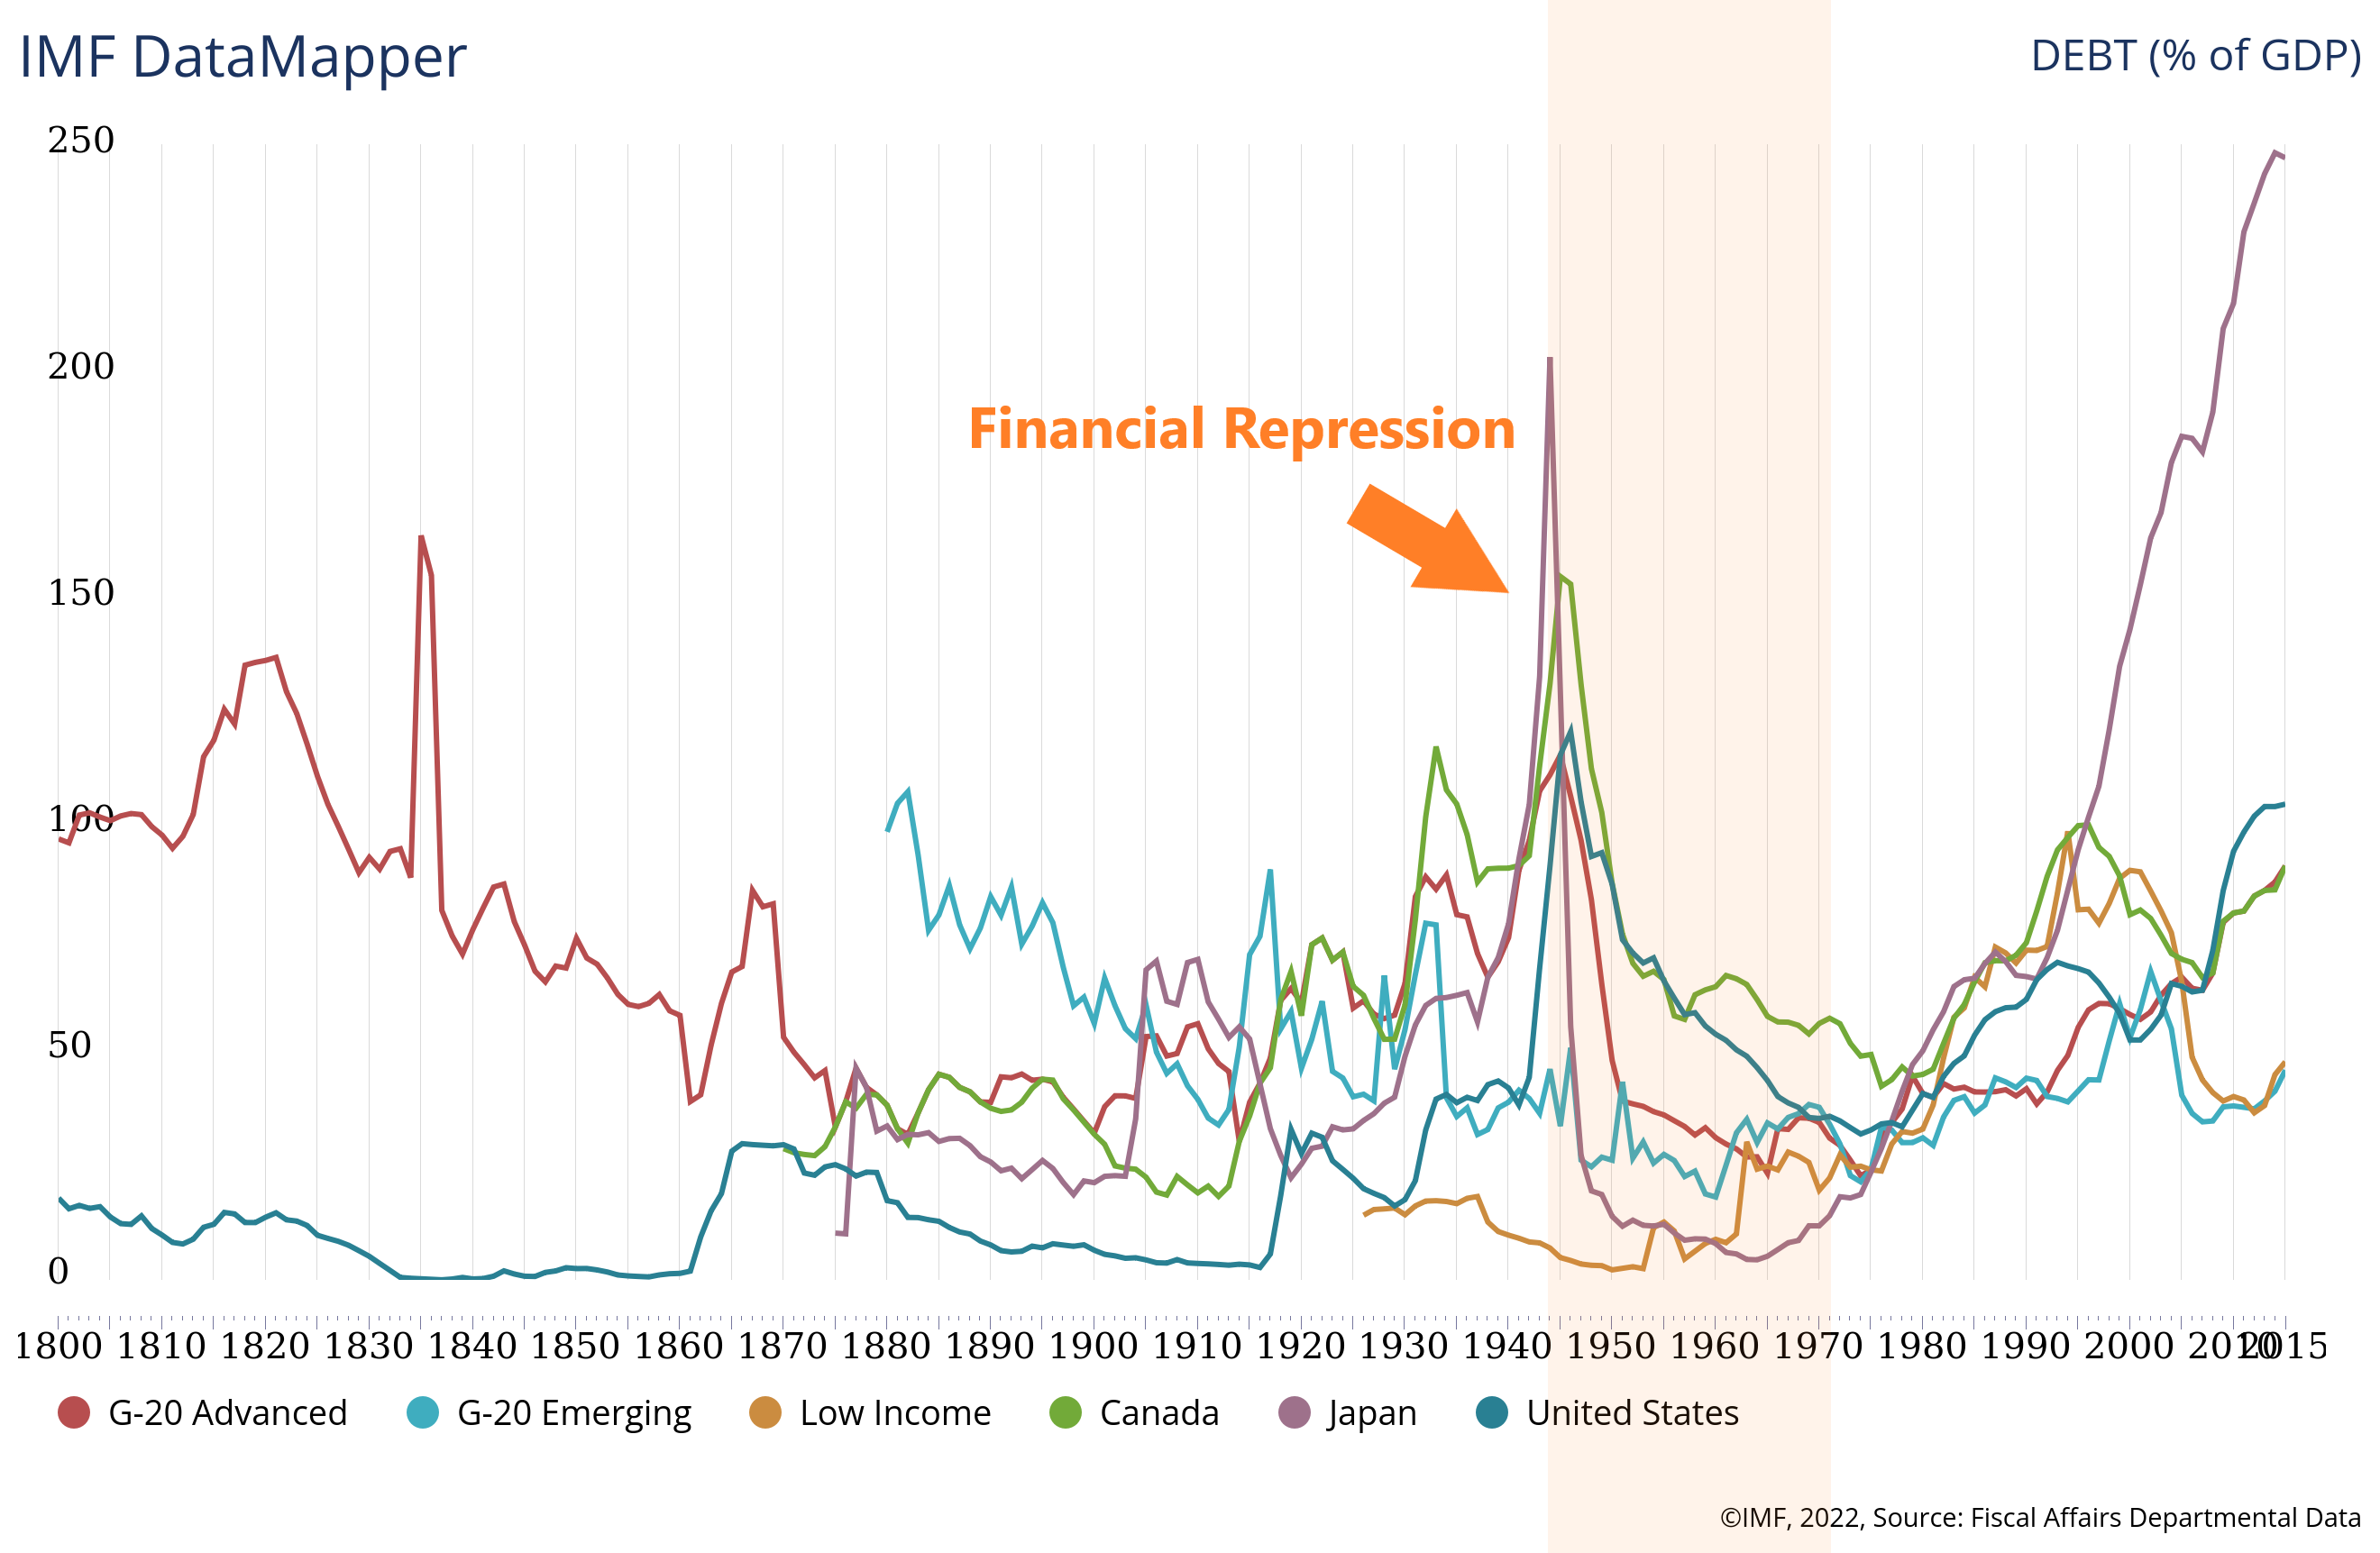
During the 1940’s, the US used financial repression to finance debt. This was done by applying capital conditions that raised the demand for government bonds artificially i.e. capping interest rates. The resulting effects would reduce the cost of borrowing and allow the governments to ease debt.
However, today we have one important variable that threatens the efficacy of financial repression. Hoffmann (2019) suggested that in today’s low growth environment, these preventative actions would not achieve debt relief without creating substantial distortions in government finances, as well as, continue to drag growth further down (2019).
However, suggesting that the exist strategy is the better choice of action does not imply the option is not formidable in the first place. What can aid us through this difficult process?
Checkmate
Let’s first differentiate between the levels of the growth experienced during the 40’s - 70’s in comparison to what we have today. This will help us determine whether this aforementioned approach will be disruptive.
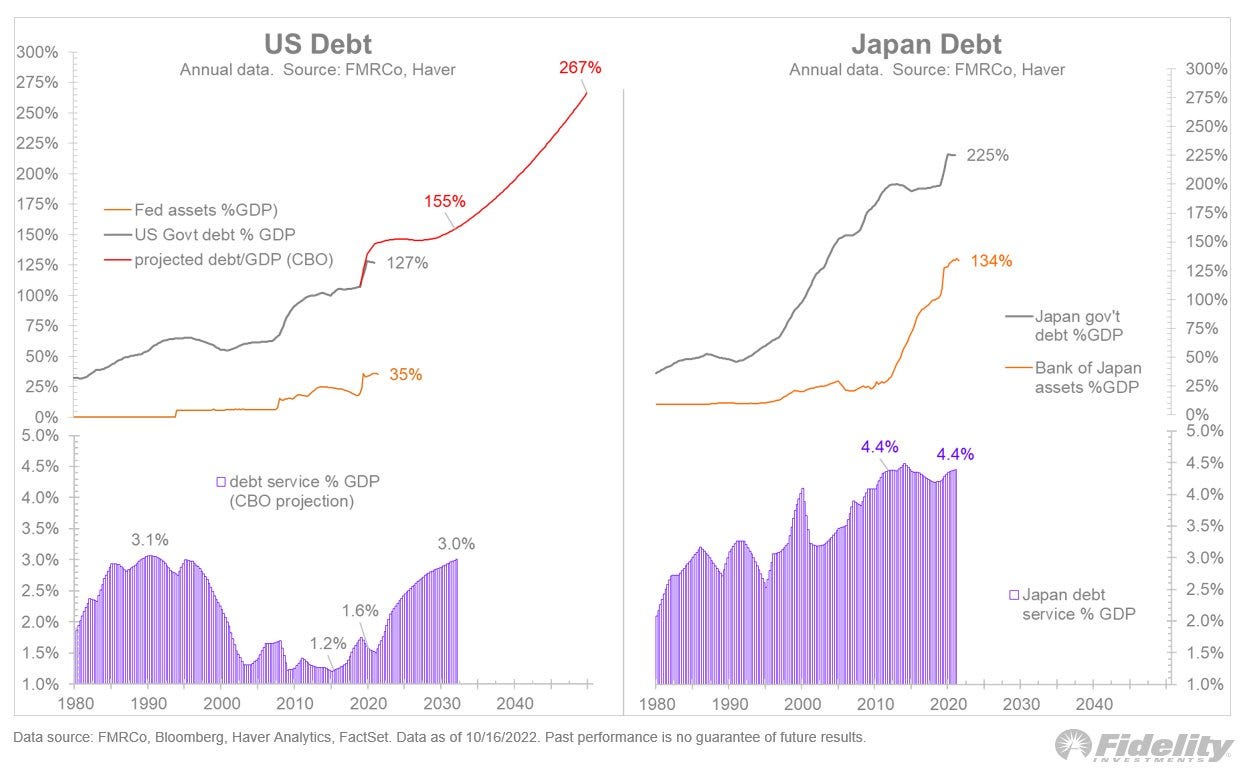
Firstly, keep in mind that the 1940 - 70’s took on repressive measures because it had strong growth to support the decision. Secondly, the FED carries significantly less control over their assets - owning a total of 28% supply of US treasuries which ultimately reduces the effects of these domestic sanctions. Jurrien Timmer highlighted the fate of the US economy and its ability to service debt, with CBO growth estimations en-route towards 3% (Figure 7.0). Even with the growth trend moving from 1.6 - 3 percent in the next decade, the graph demonstrates that debt levels are still projected to incline to 155% total debt (@TimmerFidelity).
Diagnosing weak growth
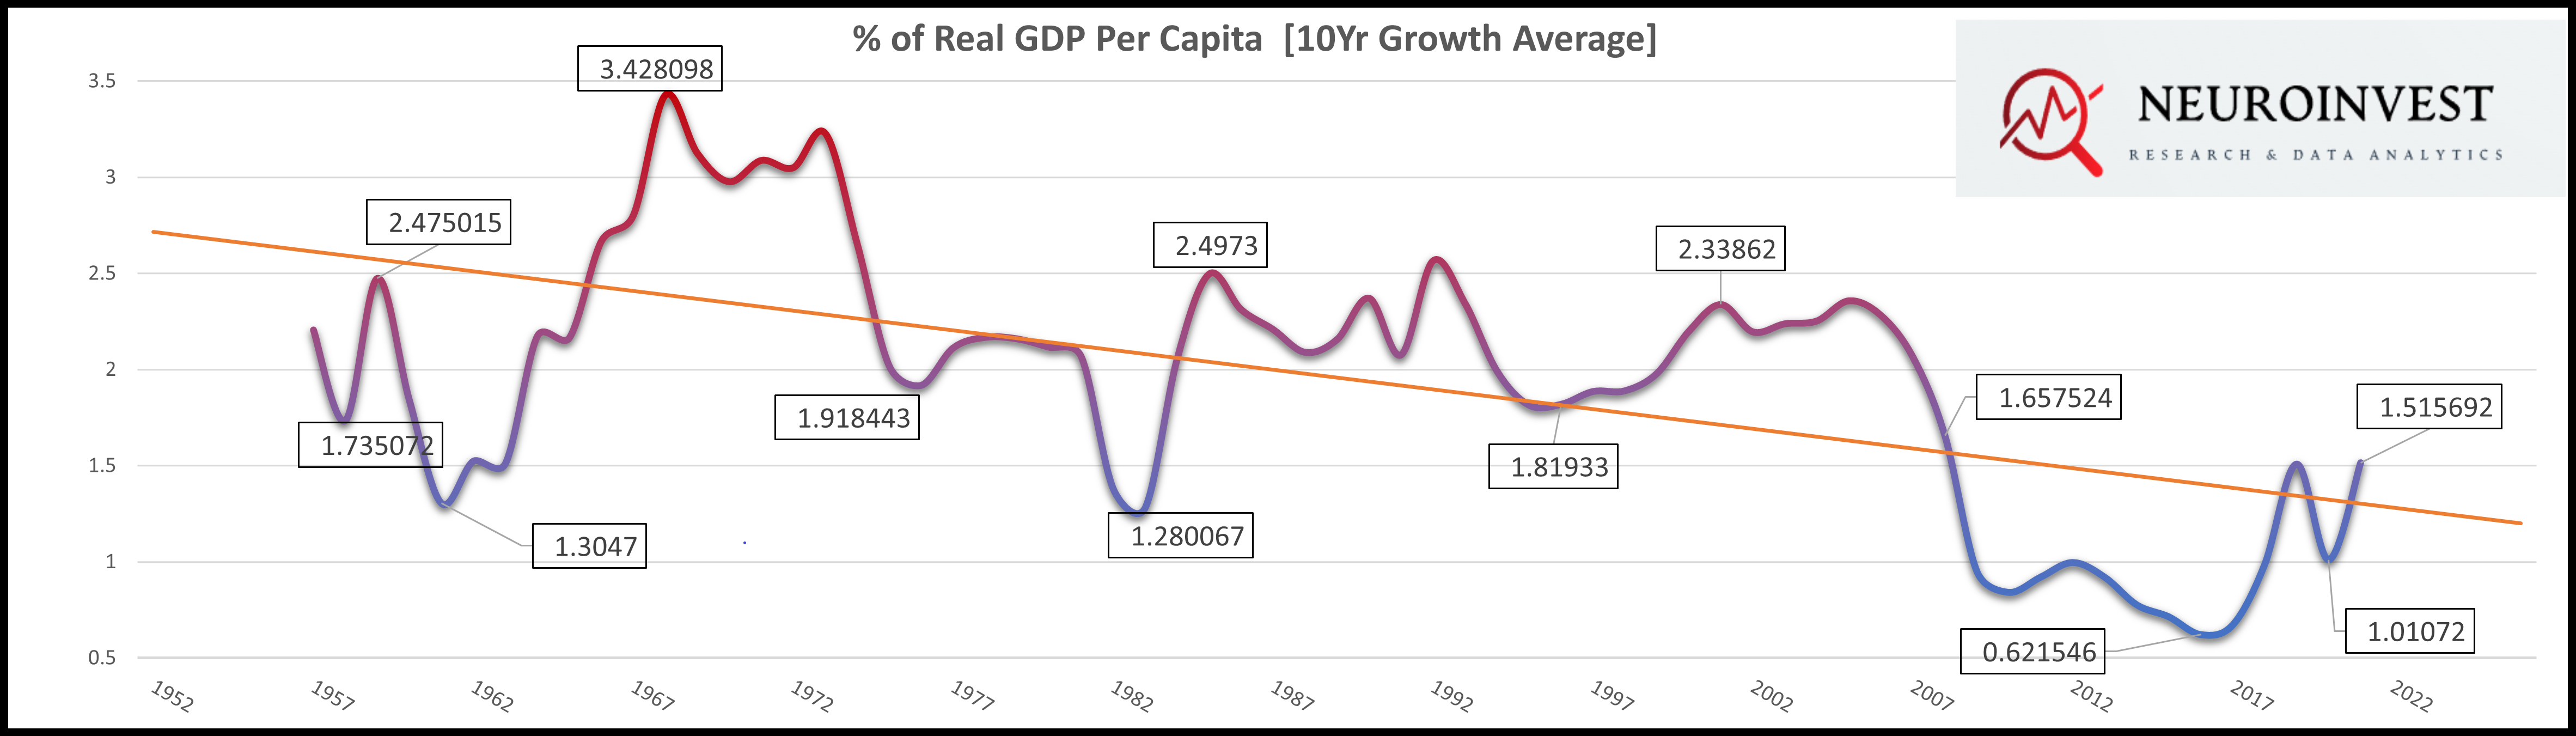
To start, we have seen a rise in government size, so why is that the standard of living is diminishing overtime? Today, the government is estimated to be 13 percent larger than the 50’s, accounting for 35% total government spending to GDP today (St.Louis Fed Data). There is a clear inverse relationship between the growth in government size and the trend of economic development over time. This is measured by the real growth per capita as a percent of GDP (Figure 8.0). There is a clear diminishing standard of living when adjusted for population and inflation since the 50’s.
One of many underlying factors which increased the deficit is the government's lack of productive funding. Bergh and Henrekson (2011) highlighted this inverse relationship in their research.
“If productive government spending expenditures are characterized by decreasing returns, the negative effect of taxes to finance public expenditure may at some point dominate the positive effect of growth promoting government activities” (2011).
In their research they talk about the importance of capital allocations. If that’s the case, then why hasn't the government directed capital flows towards productive measures in the economy? Why is it that the large scale asset programs post GFC influenced a sub portion of economic growth?
The relics that nurtured this paradigm shift will not only impede the natural cycles, but now in hindsight we are likely to see:
“Tax effects rise as the government size increases, they also need more income (revenue). As the government spends, taxes rise, and the disruptive effects of the business feedback loop also rise. One person's spending is another's income.
The larger the government grows the greater the incentive to lobby for transfer payments
The rearrangement of psychological monetary incentive structures. Using credit limits the incentive to maximize the value of each dollar, this leads to significant waste of consumer spending. The productive value of the economy begins to deteriorate, and that doesn’t even include all deadweight loss of salaries and administrative costs with the people who are doing the spending.” (EPB Research).
Higher bouts of inflation and rate hikes to adjust CPI downward, while simultaneously inhibited by real productive growth (Stagflation).
Putting pieces of the puzzle together
The FED is currently using monetary policy to retract liquidity - a measure enacted to suppress inflationary pressures. This is counterintuitive when thinking about the inherent nature of these policies in the first place.
Let me explain.
In the last decade, monetary policy ran at max RPM’s, allowing money to flow into the capital markets, corporations and banks. This was a supply side economic approach that drove globalization, tech innovation, etc. Aspects of monetary theory that kept velocity (money consumption) constant, but production of supply at its highest rate. This never triggered an inflationary reaction because the production of supply outpaced demand, making it deflationary by nature. It's important to note, both inflationary / deflationary reactions very much depend on how the economy reacts to the current fiscal / monetary policy decisions.
Interesting right?
For a long period of time, we have created structural deflation, and now ironically, the FED is doing the opposite of supply side economics to counter inflation. Like mentioned, they are cranking the knob up (raising rates) to suppress demand, but is this working?
It's not to say that quantitative tightening does not suppress demand, it definitely does, but it’s being done at a time when the economy needs the reinforcement rather than retracement. In addition, it causes a lot of unnecessary damages, especially since rates are increasing exceedingly quickly. We need all cycles of the economy to function fluidly together in order to build a strong structural foundation, and recessions are a natural part of this cycle. However, we also don't want dead weight debt moving into pre-existent companies, which is exactly what did happen in the last decade. Base money expansion inflated assets in order to increase base savings, but this does not provide real value and has no representation of organic growth.
Thanks for reading !
Please do provide some commentary if there are any questions or opinions of your own.
References
Government Size and Growth by Bergh & Henrekson, 2011
Impact of Public Debt On economic Growth by Jack Salmon, 2021
Where is the Debt? A Breakdown of U.S. Debt to GDP by Eric Basmajian, 2021
What’s A Debt Spiral, By James Lavish, 2021
Beware of Financial Repression: Lessons from History by Hoffmann, 2019
Budget and Economic Outlook: 2022 to 2032, Congress Budget Office, 2022
This is not financial advice! Do your own due diligence!