

Problem-solving Tools for Product Makers
Problem-solving Tools for Product Makers
Frame, Shape, and Ship Work That Matters

In this article, I will cover practical tools for creative problem-solving that support software product work to help keep stakeholders, reviewers, and launch teams aligned and focused, moving real work forward.
The tools we’ll cover are intended for, but not limited to, product managers, product designers, and software and machine learning developers.
An online whiteboard, doc, and sheet, along with, e.g., an iPad Pro (utilizing an Apple Pencil Pro), and a laptop/desktop computer, encompass all the essential software and hardware you'll require.
We will cover pre-development (Framing and Shaping) and development (Building) concepts and their respective tools.
There’s no navigation system for software product design and development.
There are only phases. We do something, and then we see the next step. It is incremental, not monotonic.
We need to be ready to make decisions at any point in time.
These natural phases between framing and shaping and shaping and building are inescapable if we want to scale quality effectively, especially as an organization grows beyond 10 product team members (we’ll see later how we can handle a portion of that with the Hopper tool). It is wise to gain control over these phases. How we cadence, synchronize (or not), and parallelize these phases to achieve economies of scale is a matter of organizational context.
The diagram below is the activity network that shows the planned work (not reactive work) system in which the tools I will cover sit.
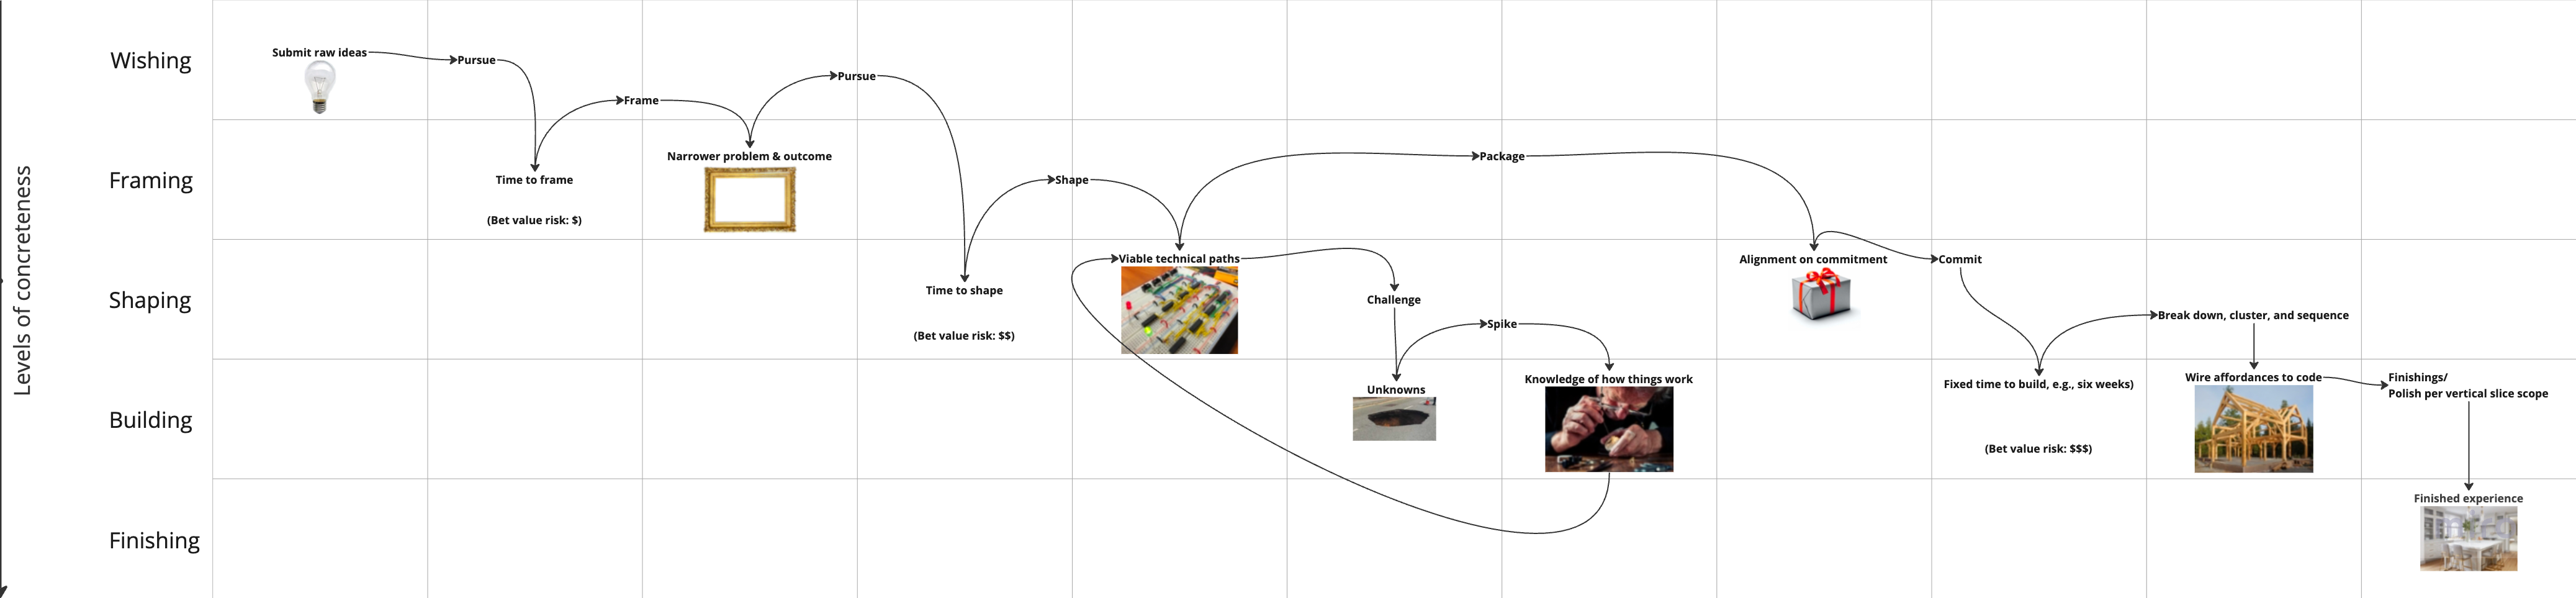
FRAMING
Framing means taking raw ideas and making them empirically sound. We do this before shaping meaningfully large solutions, and certainly before building them.
A frame is an artifact after doing a thorough diagnosis of the cause and effect of something of which we want to have an empirical understanding.
A clear and specific research question should point the team toward the initial situation they want to unpack.
This initial situation is where we start with our diagnosis. We are seeking to gain more context to get to a rationalized point-in-time struggling moment.
For example, it is not enough to know if someone wants to get lunch (we might suggest a sit-down dining experience as the solution). It is not enough to know if someone wants to get lunch and is in a rush (we might suggest a salad as the solution). It is not enough to know if someone wants to get lunch and is in a rush and is starving (we might suggest a burrito bowl). But it might be enough to know if someone wants to get lunch and is in a rush and is starving and needs to eat on the go with one hand and also does not know when the next time they will have time to eat later that day (we might suggest a slice of pizza or two). And then we need to understand how well the form (the pizza) and the context (in a rush, starving, one hand, busy all day) fit (the baseline output meets expectations).
(And a pizza shop owner serving a hungry crowd, say at 4 a.m., might also want to sell Advil, Pepto-Bismol, and maybe Gatorade.)
We look for the inputs, i.e., how people are trying to solve their problems today and how they have tried to do so historically.
We also want to understand how well the current input approach fits into the context. That is, diagnosing if the current output (fit) is meeting expectations around satisfaction, quality, and performance.
Expectations evolve, and situations are context-rich with social, emotional, and functional criteria, which is why it is critical to not fall in love with the technology or with a particular solution. Caesar used horses to send packages, and now we use, e.g., FedEx. The goal (desired outcome) is still the same: Get this thing from here to there. People get bored on long commutes. We used to be face-deep in the daily paper, but now it’s the smartphone. The desired outcome to remove boredom has not changed. The technology has.
Framing helps us develop a core understanding, independent of any technological solution, of what is enduring in a specific situation. A frame functions as the fitness criteria we use to inform new product development or new solutions for existing products.
The Tool
A to B
This tool helps to ensure we get a well-framed artifact (Frame = Context around the struggling moment and Desired outcome) to use as a test case for exploring new paths in the shaping phase where we look to improve upon the current baseline outcome. It is designed to help us find technology-agnostic requirements that are tight and specific, so solution development is more focused and the pace of shipping is smooth. This is an investigation tool that requires causal reasoning and generative research skills.
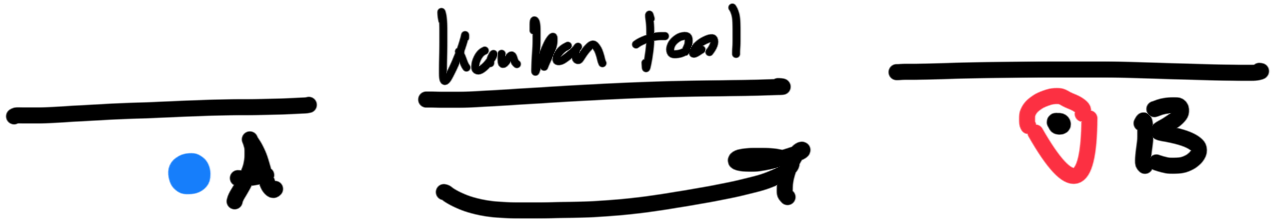
A to B is broken up into three key parts: Point A is the context, the Path is the solution approach (Old way or Path Y and/or Current way or Path X), and Point B is the baseline outcome.
We need to understand the context (Point A), as seen in the diagram below, what is broken about the solution(s) applied to that context, and what the desired outcome (Point B) should be as compared to the current baseline outcome.

First, we need to formulate a clear and specific research question to guide our conversation with internal or external people, or even with ourselves.
When we have uncertainty about what to build and why, we do user research with a pool of people who have recently used or bought a product that is related to our area of interest (Path X), i.e., the current product or solution applied to their current situation to achieve some goal. We can see Path X in the middle passthrough section from the diagram above (the current way).
Point A is before the decision to use or buy a product.
So, start by going back in time and ask the user:
“When did you use/buy Path X?” “When did you have the first thought that you might need something like Path X?”
We are looking to identify the struggle between the time the user thought there was a problem and when the user used/bought Path X.
Continue to investigate by asking the user:
“What were you doing in that period before adopting Path X?”
We might get an answer that describes Path Y (a previous approach/solution, i.e., the old way), but that is not Point A (the situational context where we uncover the struggling moment). We could delve into the person’s substitute path (Path Y), but it might be too open-ended.
We need a different formulation to get Point A data.
We need to ask the user:
“Why did you not just continue with Path Y but instead adopt Path X, considering the time elapsed between the thought of the struggle and the adoption of Path X…?”
Anytime users talk about a scarcity of time, energy, knowledge, or money, we know we are getting close to Point A.
Once we think we found something, we ask the user another question:
“What is bad about that?”
We should now have confidence in what Point A is and the detailed context surrounding that situation.
We now need to ensure we gain an understanding of Point B. We need to understand what part of the problem was Path X supposed to fix, as Path X solutions are specific, not broad. Most solutions are not the sandwich, they are just the mustard.
We have to ask the user:
“Before you used/bought Path X, what were you picturing would be different after you used/bought Path X?”
We should now have Point B data.
Since this is one of the more abstract tools in this list, let’s play it out using a simple example.
A to B example:
Let’s assume we want to answer the question of how dev shops are organizing their work that’s in progress.
Let’s assume the customer is an owner of a dev shop.
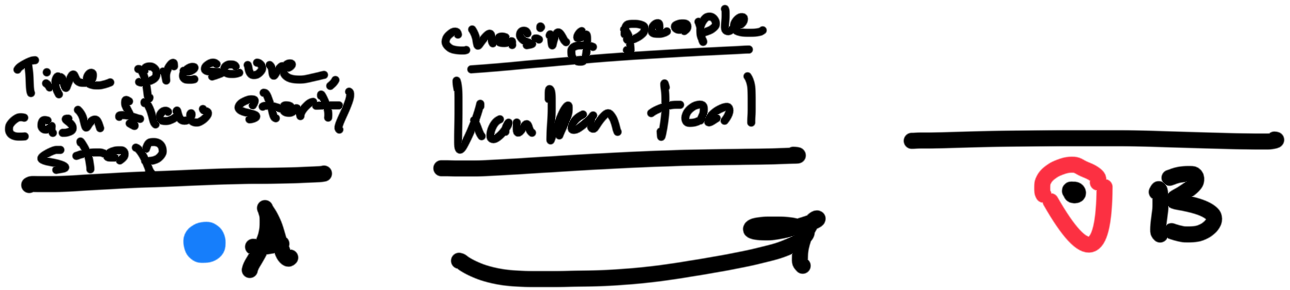
The owner recently bought a Kanban software tool (Path X).

We most likely do not know Point A and we do not Point B.
So, remember, we need to know Point A, which is in the past. So, we go back in time and ask the owner:
“When did you buy the Kanban tool?” “When did you have the first thought that you might need something like this?”Let’s say the owner responds that he needed it ~6 months earlier than he bought it.
If 6 months went by from when he first thought he had a problem until when he bought the tool, there must have been some kind of a struggle…something that was not sufficient in that period of time.
We continue to investigate by asking the owner:
“What were you doing in that period before adopting the Kanban tool?”Let’s assume the owner says: “I was chasing after people trying to get status updates.”
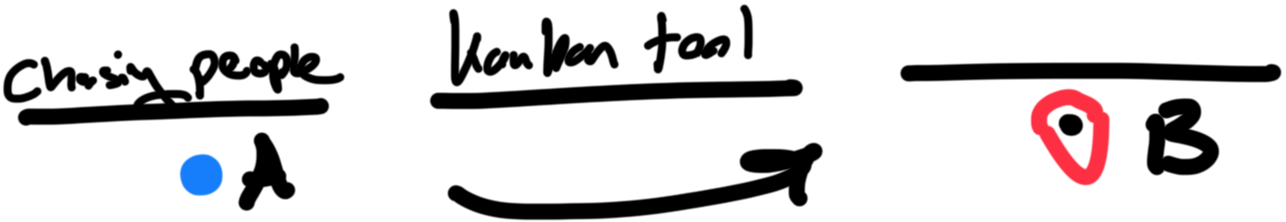
This sounds like the struggle. But actually, it is a substitute for the Kanban tool, and that sounds more like Path Y. It is not Point A yet.
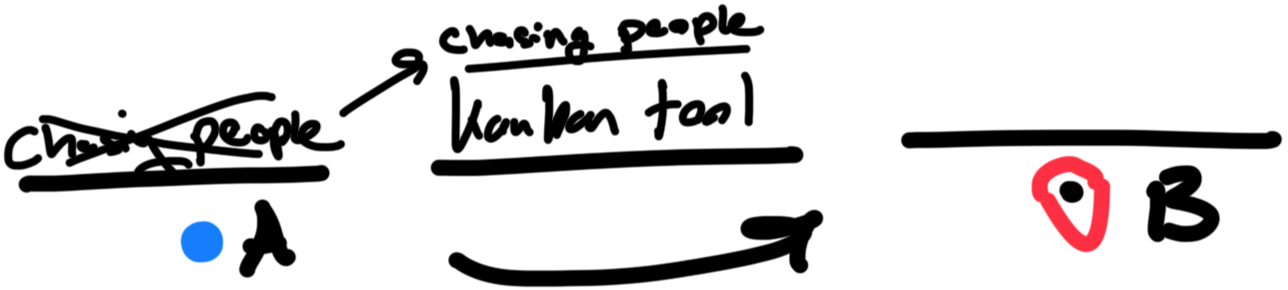
We need to ask the owner:
“Why did you not just continue chasing people? It seemed to “work” for 6 months (between the thought of the problem and the adoption of the Kanban tool).“Let’s assume the owner says: “A day came when I found a piece of work that had been sitting there for 3 days. If I had known sooner, I could have billed the client.”
Once you find what seems to be the Point A situation, ask another question:
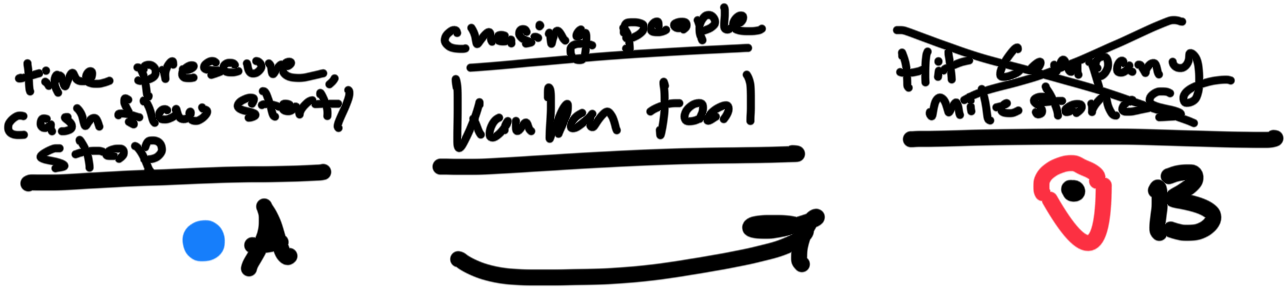
“What is bad about billing the client 3 days later?”Let’s assume the owner says: “If I can only bill at the end of the project, cash is coming in at big starts and stops, but if I could hit incremental milestones along the way, then I can bill steadily in little bits and smooth out my cash flow.”
Now we have Point A data: Time pressure and cash flow start/stop. This is different than what originally presented itself as the struggle, i.e. chasing people.
Now we need Point B data.
We cannot say this Kanban software is responsible for hitting these cash flow company milestones alone. Remember: Most solutions are not the sandwich, they are just the mustard. We need something specific. So, this is not Point B data yet.
We have to ask the owner:
“Before you used/bought the Kanban tool, what were you picturing would be different after you purchased it?”Let’s assume the owner says: “I thought I would have a system in place so I could get notified when work is ready.”
Ah…so Point B, what the Kanban tool would enable, is to get notified when work is ready.

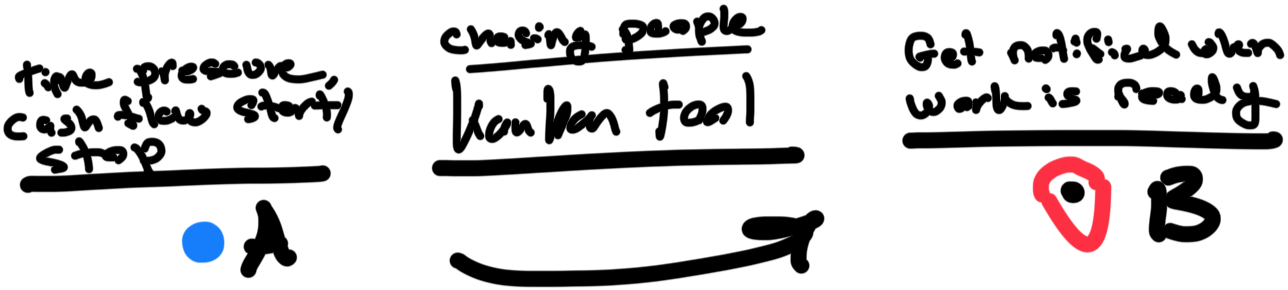
To summarize our discovered frame: When the owner is under time pressure, and the company is not moving fast enough to hit its goals, a system is required to make sure the people on the team get notified whenever a piece of work is ready for them to do the next step.
We can put that into a formal structure as seen below. The context section includes the context surrounding the uncovered point-in-time struggling moment and the current path used in that context. The desired outcome section is our Point B data. This artifact can live in the Possible Paths sheet, which we cover later in the shaping section.

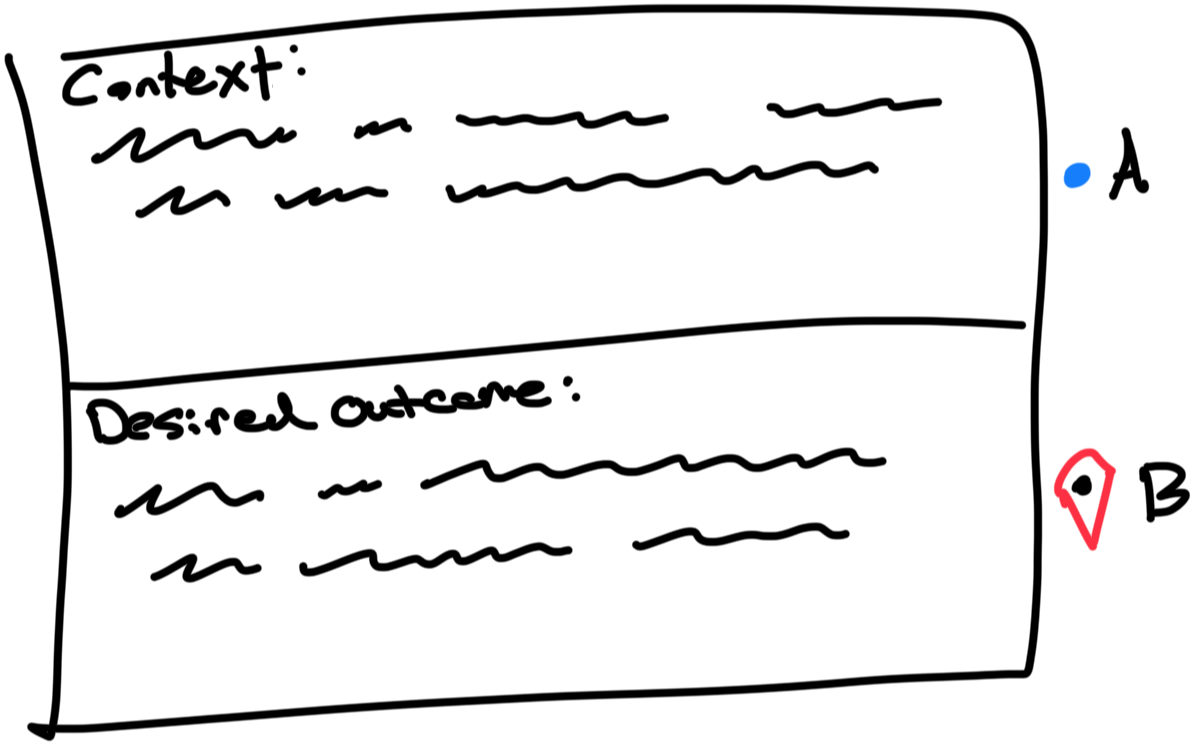
The context and the desired outcome function as the empirical test case for our initial solution paths to judge if the design is going to work/have fitness for the user in that specific situation.
A pattern language model of cause and effect should emerge after 10 to 12 independent 60-90-minute long conversations within a specific focus area of interest.
Over time, our product’s competitive set will emerge in the form of the attributes that define what our product is more and less about and whether the product is in or out of the competitive set when a “hiring” moment arises. For example: Snickers can’t take a feature request to be “more melty” and then win over some new customers. Milky Way can’t “add a little crunch” to hit two birds with one stone.
These are trade-offs. The trade-offs are both what makes them different, what defines their competitive sets, and what makes them suitable for different situations (Snickers is competing with an energy bar, an apple, or Diet Coke and is reached for when we are on the go, when we missed a meal, and Milky Way is competing with a glass of red wine or ice cream and reached for after an emotional event when we need a boost and want to take our time chewing away).
When we know our position, we can say “no.” When we don’t know, we say “yes” out of fear.
We might call that artifact, which is informed by framing, the strategy canvas (the product’s blue ocean strategy). We move beyond the concept of markets or customers/personas and toward the idea of situational market segments. “When” becomes more interesting and valuable than knowing “who”. Understanding the context of the motivation is more important than the persona.
SHAPING
Software has no natural boundaries or edges. There are no obvious laws of physics that tell us something is too big, too heavy, etc. There are no natural pushbacks. Shaping constrains the work so there are clear boundaries around what is in and what is out. Shaping happens after the framing and before the building phases.
This creative problem-solving work is about designing for form-context fit. It is not a list of a bunch of disjointed tickets we give to engineering. It is the conceptual design work at a scale that gives clear direction and latitude for creative flexibility so Small Launch Teams/future self can make trade-offs regarding scope when in the context of development, i.e., when the real work unfolds.
Shapers can judge the configuration of the whole, at the right fidelity, component by component, to move fast and cover possible solution paths without getting dragged down into the wrong level of detail. They shape a solution that is not too vague when concreteness is needed and not too concrete when flexibility or adaptability in the details is needed, i.e., not under or over shaped).
A shaped project is a discrete unit of work that spells out a possible solution path. The proposed solution is always connected to a specific and tightly defined problem to solve (struggling moment from the frame) or motivation to address.
In a discrete project, we factor out as much as we can to get at the irreducible core of interdependent parts that still address the fitness function. Sometimes projects are unavoidably large (like in new product development), making it hard to address a single fitness function in one orthogonal batch of work. The key is to design what needs to be solved together as one whole, and what can be solved separately, and then create multiple independent but related projects. If this does not help, then we need to take another look at the frame, as it might not be tight/specific enough.
When shaping, we design at the altitude of solved and rough key macro interactions and interrelationships. The "How" here should be loose enough that there are multiple ways to solve the path’s patterns from the approach selected, which should be roughly solved and bounded with a clear purpose and direction, i.e., there is some version of the solution path that works while enabling teams use their judgment and make trade-offs in the context of construction.
Intrinsic to the definition of a "pattern" is the notion that something can be done in more than one specific way.
It's one thing to say: "Design a kitchen."
It's another thing to say: "Here are the specific and fixed scope blueprints of the kitchen, go build it."
And it's yet another thing to say: "A good kitchen has windows giving light from two sides. The counters are long and generous along the south side to get the light. Place a big table in the middle and light it from above to create an eating atmosphere."
The latter is a very limited example of what a better working description looks like that can enable Launch Teams to work within constraints while leaving the specifics open according to the realities of the project.
Enough latitude to enable breakthroughs. Firm boundaries to enable agreement. Specifics when hard-earned knowledge informs decisions. Trust when we know that capable people can work it out themselves.
As mentioned, we shape when there is a tightly defined frame in place that has been tagged with an initial time budget and the deciders agree it is worth shaping up a path to address it.
As we shape, we might revise the initial time budget. But we always shape into some initial or revised time budget to ensure we constrain our thinking to ward off bloat and complexity.
A shaping session happens live and runs between 2-3 hours.
These are working sessions, not meetings or brainstorms.
They consist of a small group of both technical and non-technical people working on a specific and narrow problem frame. Sometimes a spike needs to happen and, e.g., the technical shaper requires an additional shaping session, and other times that work happens live in the session itself.
Think of shaping as solution investigation and not solution development. That is not to say that sometimes we need to, e.g., open up a code editor and carry out a spike.
In other words, effective shaping is done collaboratively when there is a well-defined frame and the frame has been selected as something valuable enough to shape.
The Tools
Possible Paths
Sometimes when we don't know how to go forward on something, we can use a counterintuitive technique. It can be easier to come up with three or more ways to do something instead of just one way. That's because when we make room for many options we can allow ourselves a bad option. Articulating what doesn't work can spark new ideas simply by contrast.
We like seeing edges in our ideas next to each other that are different. That helps to improve our thinking.
Also, design is never about one thing, it is about many things.
So, before we shape a specific path (proposed solution approach), we might want to consider alternatives and address feasibility across options, i.e., to see what is most solvable and ideal. The language of paths lets anybody say: "Wait wait...before we keep going deeper on this...is there another way? Who's got a different path for this?”
For example, we want hot water for tea. Everyone discusses their favorite kettle. What's a different path? How about a hot water tap with a tiny sink? Different paths have different parts to integrate, costs, and outcomes.
This is not about shopping for a solution. It is about examining different paths, their parts, and their qualities and hopefully birthing one or more new approaches.
We use this decision matrix design tool when we have half-baked and unclear parts of a solution.
Articulating what doesn't work can spark new ideas simply by contrast. Alternatives might be interesting, and then contrast acts as the input into a matrix by asking: “Can I spell it out in more detail?”
This is the essence of reframing. For two awesome examples, check out: The giant outdoor escalators that transformed Medellin, Colombia into a thriving neighborhood or Malcolm McLean’s observations to optimize for loading time at the docks, which led to containerization, while others were singularly focused on increasing cargo vessel knots.
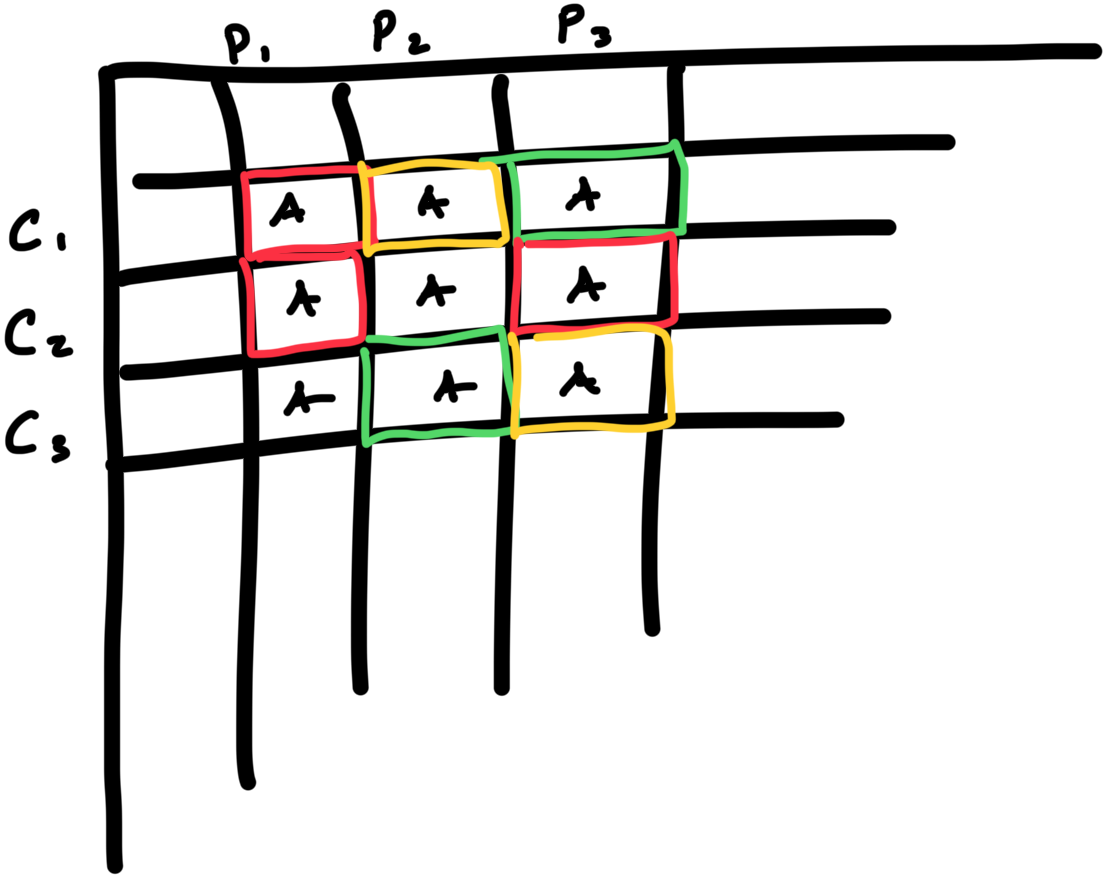
In the Possible Paths tool above, the rows are the criteria (C), the columns are the paths (P), and the cells are the aspects (A). We also want to include a succinct description of the problem/decision being taken.
CRITERIA: Fitness for solving the problem (from use cases in and around the frame), i.e., standards or rules used to judge the quality of a solution, e.g., various '-ilities', costs (time, dev effort, $) risks, compatibility, and complexity, purpose-built for the problem (reflective), etc. These are not characteristics, and they are not meant to be an exhaustive list. The criteria used must be salient and relevant. We can populate these rows (the list of criteria) after either thinking through some paths or pulling out additional facts surrounding the frame.
PATHS: The status quo, what others have done in the same situation, or our initial ideas and the succinct description of the approach for each. Our Lightweight UI State Diagrams and Thick Marker Sketches (seen below) can be appended/referenced to support these columns when fitness-checking. We want to get at the user’s intentions.
ASPECTS: Aspects are determined by looking at the approach from the perspective of the criteria. Give a succinct description of how the approach handles criterion (or doesn't), e.g., mechanisms, assumptions, and parameters of the approach, etc.
Avoid y/n/true/false/numeric-rank criteria in cells.
Avoid subjective judgment in the text. Just write what the facts are. Use colors to indicate subjective fitness for each path: Blocker aspect cells (red color label). Not-so-great aspect cells (yellow color label). Appealing aspect cells (green color label).
Grab a template of the sheet here. View a partial example here.
A collaborative sheet will do just fine in organizing and contrasting the ideas in prose form. A sheet/table is ideal so we can create meaning through contrast.
This format also forces us to say something rather involved in not much space.
The Possible Paths process of “cutting up” and making decisions before jumping into one design helps us create abstractions, e.g., we get to see that we had 5 possible choices but only 2 ways to do x and one way to do y, etc. We are learning the physics of the problem. We find characteristics we want to lift as abstractions (design trade-offs). We also get the benefit of calling out ambiguity and inconsistencies while raising good questions.
With Possible Paths, planning becomes more about removing misconceptions and product development becomes more about staying focused on solving problems.
When we begin to make implementation decisions on a selected path (solution approach), we can shape a design for how users will accomplish their goals given the solution we intend to make and the initial implementation decisions we selected.
Thanks to Rich Hickey for inspiration.
Lightweight UI State Diagram
This tool lets anyone design the structure of relationships at the level of affordances and flows to stay in the right level of detail on a specific design decision.
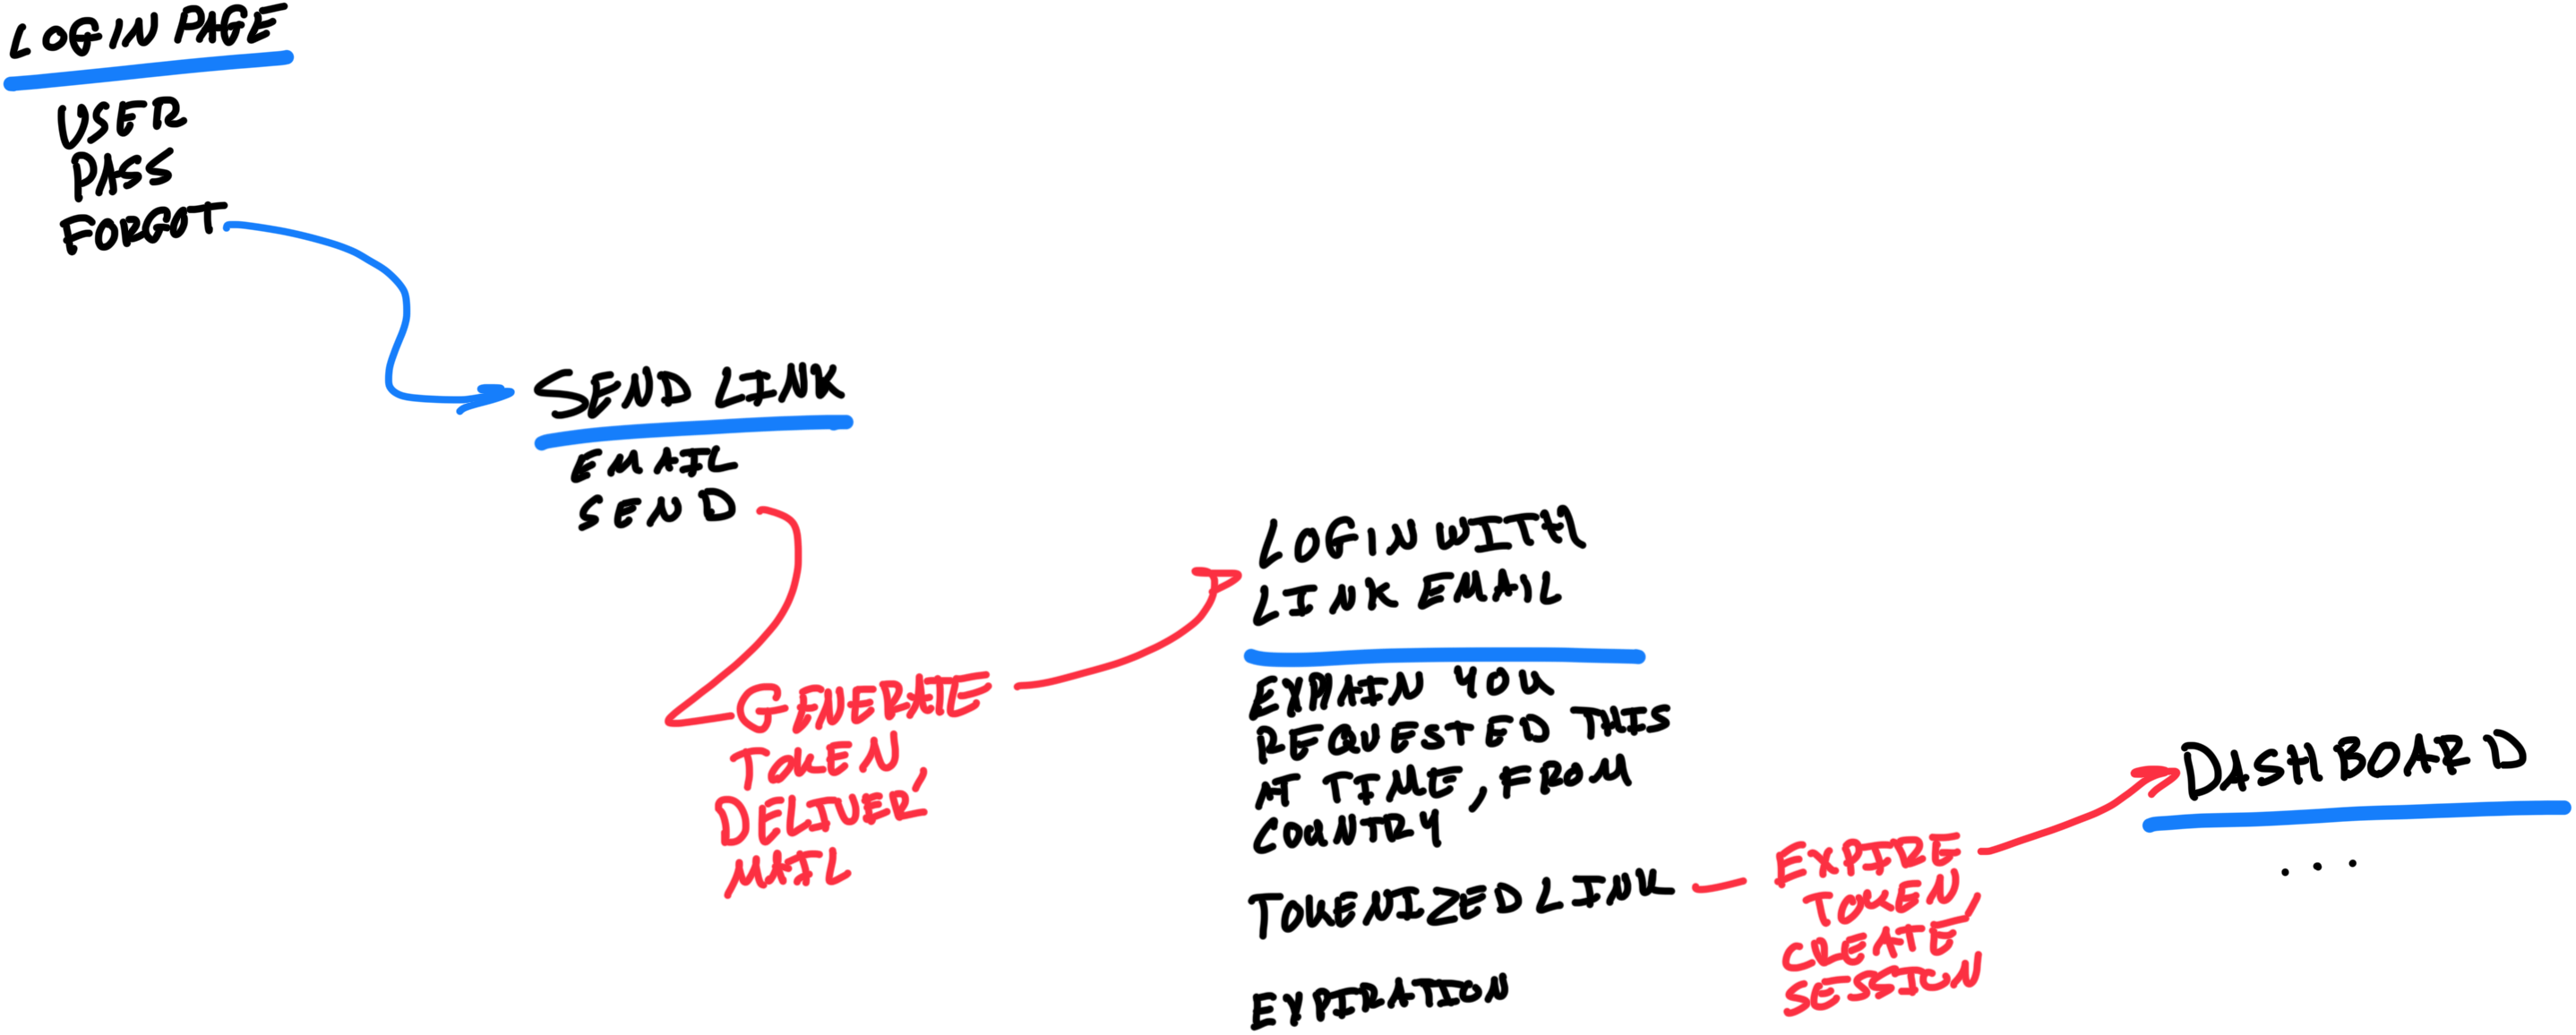
The Lightweight UI State Diagram connects screens/pages/places with listed affordances in each. The UI shorthand allows for a distinction between affordances in the interface and actions in the code (seen in red).
Because the columns show the interface endpoints, the arrow labels are available exclusively to explain what happens between what the users see. Wiring up affordances and places this way communicates critical interaction patterns at the right altitude to function as the top-level structure of a solution concept.
Teams can add finer details in a targeted fashion, like a sketch, technical spike, or polished mocks/clickable screens as needed, into the whole data structure of the model. This pre-development conceptual design tool will help teams shape work at the right level of abstraction, getting into finer levels of concreteness, or spelling things out more broadly where needed.
We typically use an online whiteboard application when relating and connecting places and affordances. I find a trackpad works better for navigating the canvas over using a mouse.
Thick Marker Sketch

A Thick Marker Sketch spells out the arrangements of roughly defined elements in a two-dimensional space when words structured in a UI flow are not enough.
A Thick Marker Sketch is not just a low-fidelity sketch. It is a UI sketching approach that uses a thick marker to constrain the amount of detail we can express on a given page. Why? In doing conceptual design right, we want to generally not be too concrete and not too vague. This gives launch teams and/or our future selves the latitude needed to make trade-offs when in the context of development.
It is also ideal to use a Thick Marker Sketch in a targeted fashion to make unknowns less unknown.
It also helps to keep shapers focused on the key interactions, spelling out only those things that truly matter to meet the fitness function criteria, i.e., to have good form-context fit.
We typically use an online whiteboard application for sketching. It helps to switch from your laptop to an iPad so you can use an Apple Pencil.
BUILDING
This is when development and design happen: Work out a discrete concept that has been shaped and bet on, finish some version of it, and ship within a fixed time budget.
We are not covering reactive work but rather a build cycle for meaningfully large proactive (planned) project work focused on one problem (frame) at a time (solutions budgeted between 2 and 6 weeks).
We want the project to stay "whole" through the entire process so we never lose sight of the bigger picture. With well-shaped, de-risked, projects, teams have the latitude to adjust the scope to "some version" of the initial solution outline. Nobody plays the role of the "taskmaster" or the "architect" who splits the project up into pieces for other people to execute. Splitting the project into tasks up front is like putting the shaped work through a paper shredder. Everybody just gets disconnected pieces.
Why time budget no more than six weeks at a time for discrete projects? Six weeks is long enough to build something meaningful start-to-finish and short enough that everyone can feel the deadline looming from the start so they use the time wisely and trade scope for quality as needed. This approach also unlocks the ability to leverage project optionality.
Sometimes there is deeper work or a solution that has too many moving parts that prevent it from being scoped down to one six-week project, such as in new product development. Even in that case, we scope off the work in such a way that each cycle is expected to be done so when the next build cycle starts it is just the other parts of the work that were scoped off separately (orthogonal) to the parts of the previous cycle(s).
Because we have a hard time budget (an answer to the question: How much time is it worth spending on x?) to avoid sunk costs, and cycles are not long, prioritizing "the wrong thing(s)" is not a big deal.
How do we decide when to extend a project and when to let the time-wall do its thing?: No unsolved problems (unknowns); no open questions, and very few must-haves are left. When a project will likely overrun the time budget and spill into the post-launch period, but meets those conditions, it may be advisable to allow it.
The Tool
Dumplink
Dumplink is a systems thinking work editor tool that acts as a communication bridge between business and technical teams to keep everyone focused on the real work. Think of Dumplink as an alternative to a kanban board. Those are well-suited for pulling in reactive unit work items that take less than a week to clear. Dumplink’s design is intended for Small Launch Teams to work scope-by-scope (task groups), one vertical slice of shippable work at a time, i.e., functions and then finishings, to address a singular fitness function.
The pieces that make up this tool are:
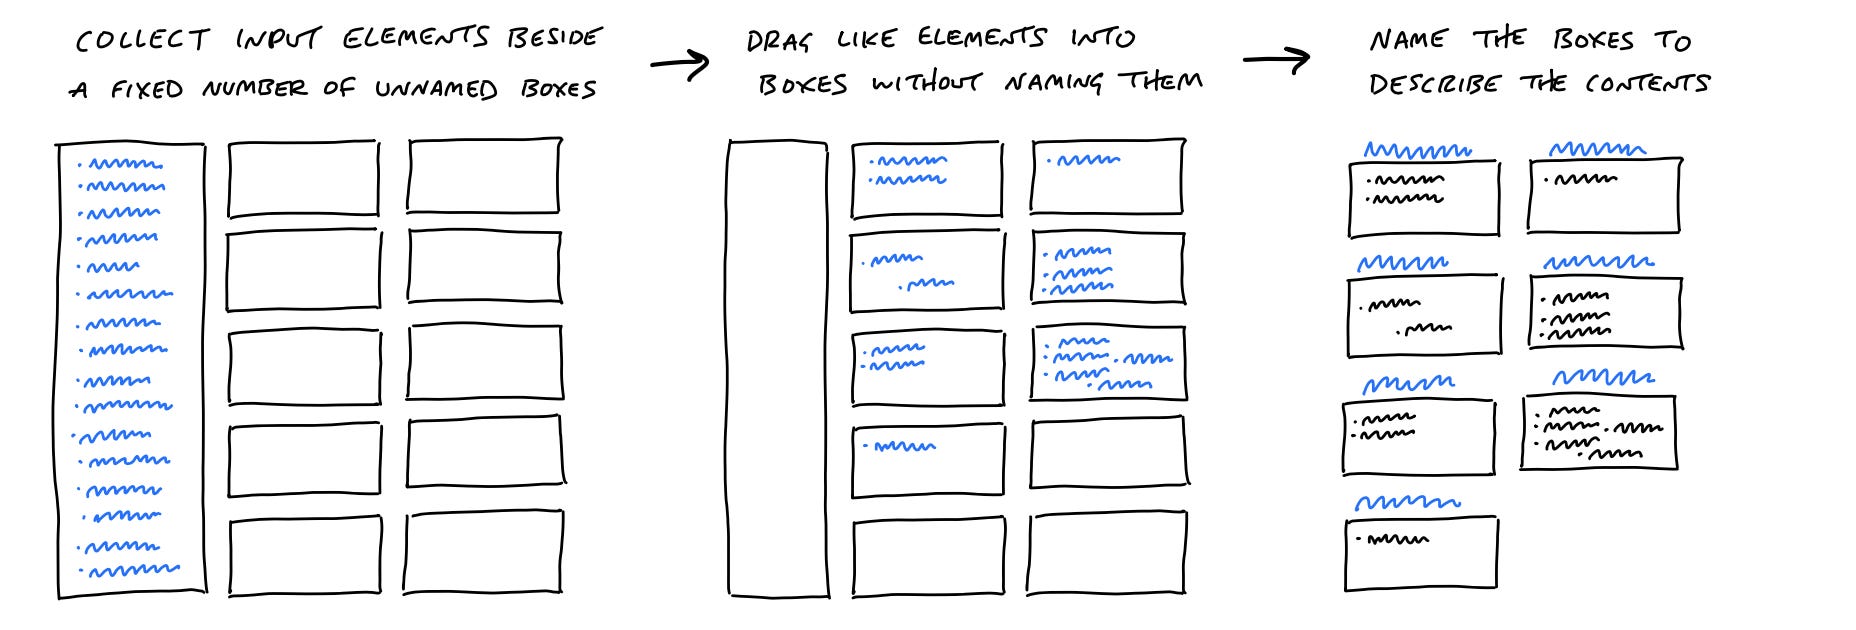
DUMP: Break down the shaped project into an unstructured list of tasks.
CLUSTER: Cluster that list of tasks into shippable verticle slices of work we call task groups.
SEQUENCE: Sequence and arrange the task groups.
The programmer(s) and designer (“Small Launch Team”) kick off the project cycle, read the shaped project outline document together, and chat with the shaper(s) who packaged the work to be developed.
The Small Launch Team dumps everything they think they will have to do into the dump. This helps the team consider the package of shaped work as a whole by turning the whole thing into rough implementation tasks without concerning themselves with structure and order before starting on any one area.
The Small Launch Team drags these initial tasks into unnamed groups by asking themselves: "What can be completed together and in isolation from the rest?". Task group boxes are named after the Small Launch Team clusters the tasks and looks at the actual work to ensure the task groups show real relationships in the work and not arbitrary categories. The Small Launch Team considers which task groups have risky unknowns and flags them. Seeing all the groups together helps to do this because the question of "what is unknown" is relative.
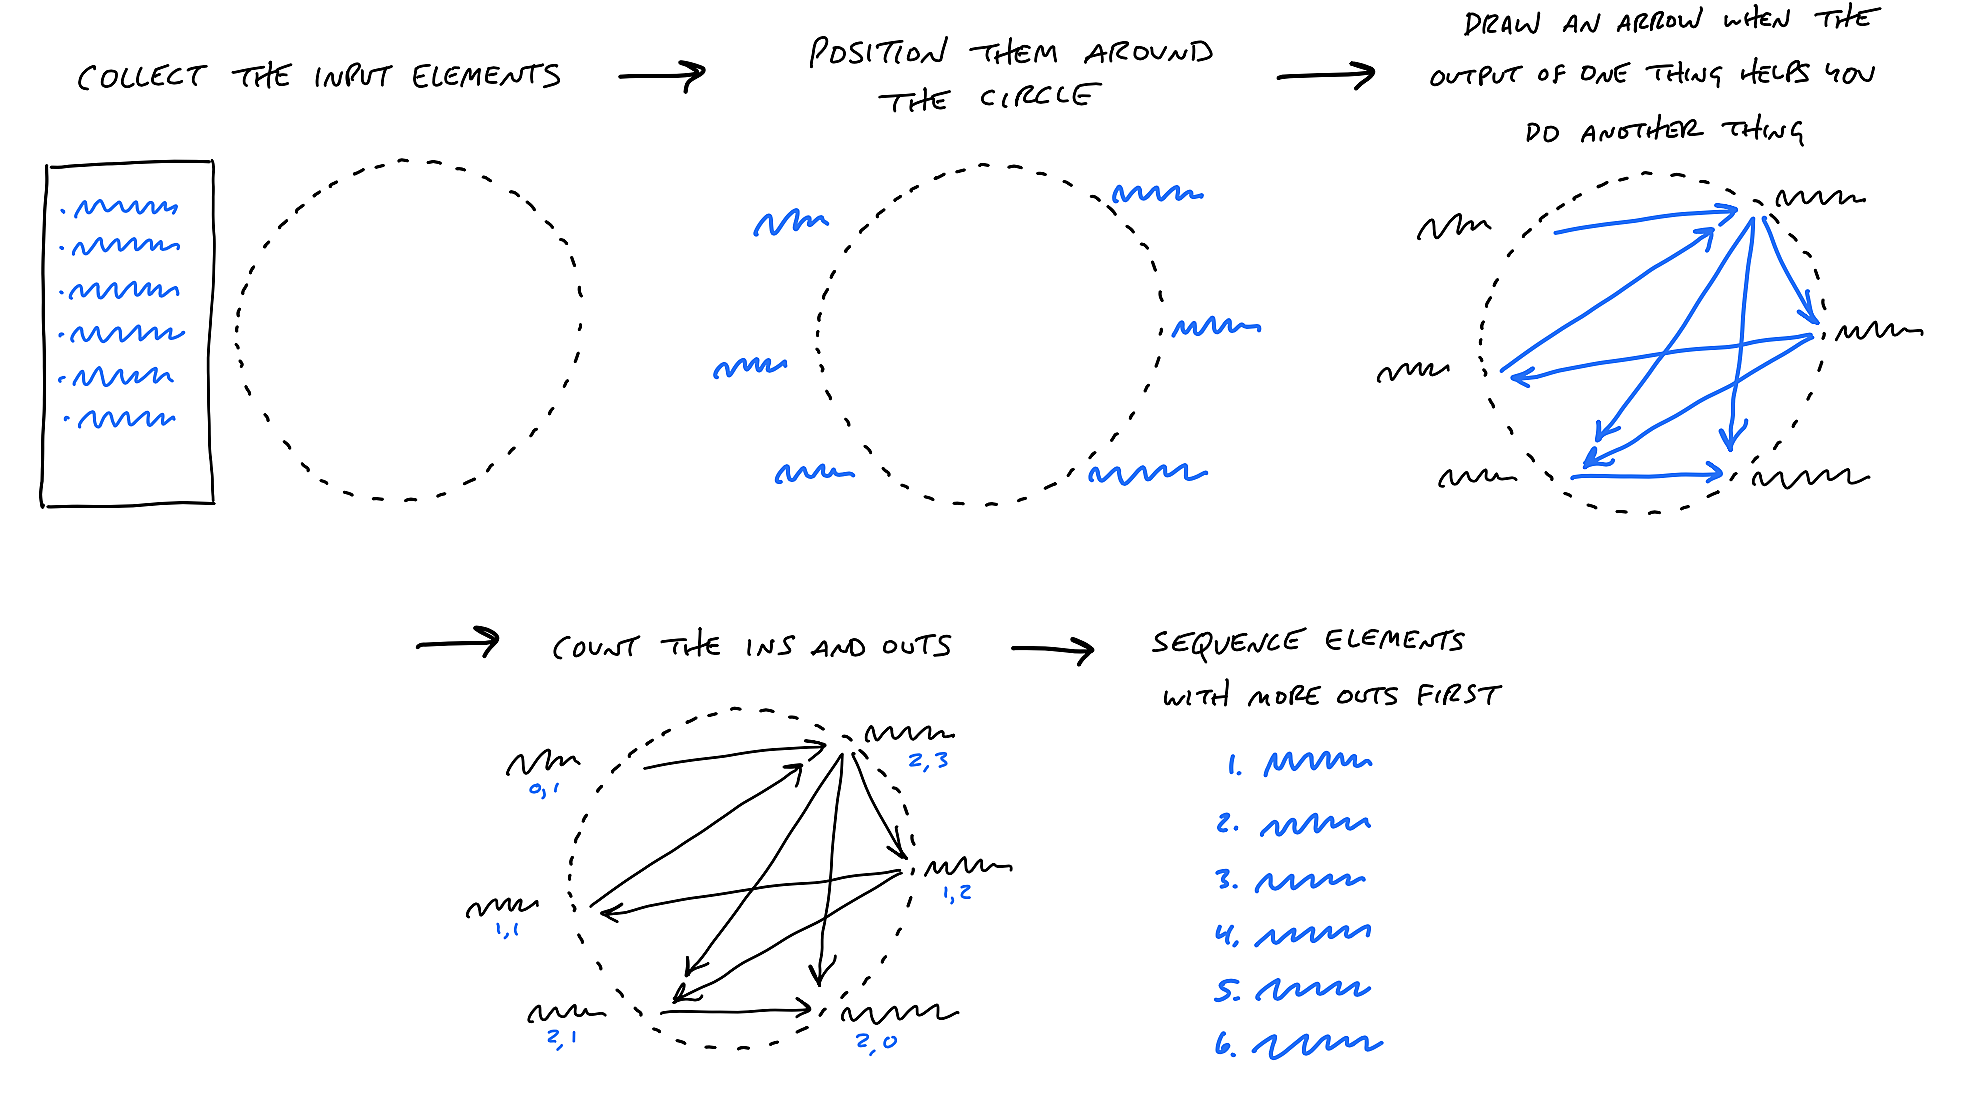
A Small Launch Team draws an arrow from one task group to another illustrating the causal structure of how things are connected. This lets teams know when they have the required inputs completed that the next task group needs—to work on task groups with more outgoing than incoming connections so teams know where to start building. This lets everyone understand what "completed" means in a path-dependent chain of unknowns and dependencies to ensure we do not hit a problem too late or in the wrong order and expand the scope unnecessarily.
We can either do this in a separate space like in the connected circles technique above or simply draw arrows from one task group to another in the 10-box Dumplink work editor tool.
To determine development progress, consider the analogy that work is like a hill. Up the hill is the “figuring it out” phase of execution, and down the hill is the executing on “no unknowns left” phase. When going up the hill we can use heuristics like: Have we looked at the problem yet/did we just crack it open? If not, then our task group is totally on the left side of the hill. Do we have a concept about how we think we are going to approach it? Then maybe we are 20% up on the left side. Have we validated our concept for how it is going to work? Then maybe we are 40% or 50% up (percentages are not important here). If we validate the concept and we poke around and there is nothing else that is gnawing at us—we have no more questions about how we are going to handle something and it is clearer how to estimate, if needed, the work effort (even still, we want to add 50% to our time estimate to avoid planning fallacy pitfalls)— then we are at the top of the hill (“Executing down” (known or solved) phase).
It helps to label each task group using four different colors to represent movement. For example: Use grey for “Not started”. Orange for “Figuring it out” (unsolved WIP, i.e., unknowns). Yellow for “Executing down” (solved WIP, i.e., no unknowns). And green for “Done”.
Tracking what is unknown and what is known is more important than tracking what is not done and what is done when you are looking to see the status of a project. This can be done without counting tasks and without numerical estimates by shifting the focus from what's done or not done to what's being figured out and what is figured out.
It's more satisfying to have the conversation at the level of task groups and point to vertically finished pieces of software we can feel and click around in instead of going down into the weeds and defending the purposes and status of individual outstanding implementation details (tasks).
This is all about trying to communicate risk, i.e., task groups depend on every task being completed for the vertical slice to function. If any task is unknown, the task group is at risk. The state of a task group may simply be the state of the most risky task within it.
With dumplink, teams can:
See exactly what is moving, what isn’t, and what is at risk.
See what’s unsolved, solved, and done.
Avoid rework and delays.
Because it helps teams:
Know which things need to be solved now and what can be sequenced later.
Make progress on the right tasks first.
Know if a variable scope project is going to be finished on time; and, if the time budget is all used up, and the project is not finished (in post-launch), how many unknowns and/or knowns convert into overrun items, which informs teams if they should extend the project or move on to other options.
We typically use an online whiteboard application to do dumplinking.
BONUS TOOLS
The Tools
Hopper
Roadmaps (and backlogs) create a feeling of debt. They can become order-dependent making it hard to drop things if things get stuck, and they are often inflexible once they are shared. They treat strategy as a problem in deduction, which assumes anything worth knowing is already known. The hope is to create some kind of a prime radiant.
Roadmaps, even described at higher altitudes, build up accumulated variance, which rises proportional to the square root of the time period. This means slippage rises exponentially with duration, e.g., a roadmap of twice the duration can experience 16 times as much slippage from the original plan.
In ever-changing environments, prioritize adaptability over rigid planning, refraining from commitments extending beyond a 50-day timeframe. We figure things out as we go. It’s as simple as that. Continuous adjustment. We’ll do that regardless, with or without a plan or goal. Instead of suitably detailed long-horizon plans, specify the end state, its purpose, and the minimal possible constraints. Be sure to address the following two constraints to stay focused on a distinct path when developing new products:
State the transient trends and the enduring truths.
State what the product will be more and less about and why.
But, we need a practical tool to tie together the artifacts that the aforementioned tools produce to facilitate decision-making: The raw ideas, the frames, and the shaped packages of work.
The Hopper is essentially a “Project Scheduler” to functionally decompose ideas into actionable projects. It is based on the principle that small changes in the present make large changes in the future. The Hopper is an option pool that stores an array of raw ideas and a funnel of options that get dispatched into either reactive or planned workstreams. We generally use a Hopper when we have a core product in place and a growing team (~9+ product team members).

We can start with an array of raw ideas that live in an option pool.
We can put raw ideas here without any order or sequence and without any commitment to doing any of them.
This pool also functions as a fulcrum that feeds into either a proactive project pipeline of work or a reactive pipeline of work.
These items live in a spatial, not a temporal, space. We can bring some organization to this option pool by clustering the raw idea items into themes/focus areas and/or organizing by product line, but never by time.
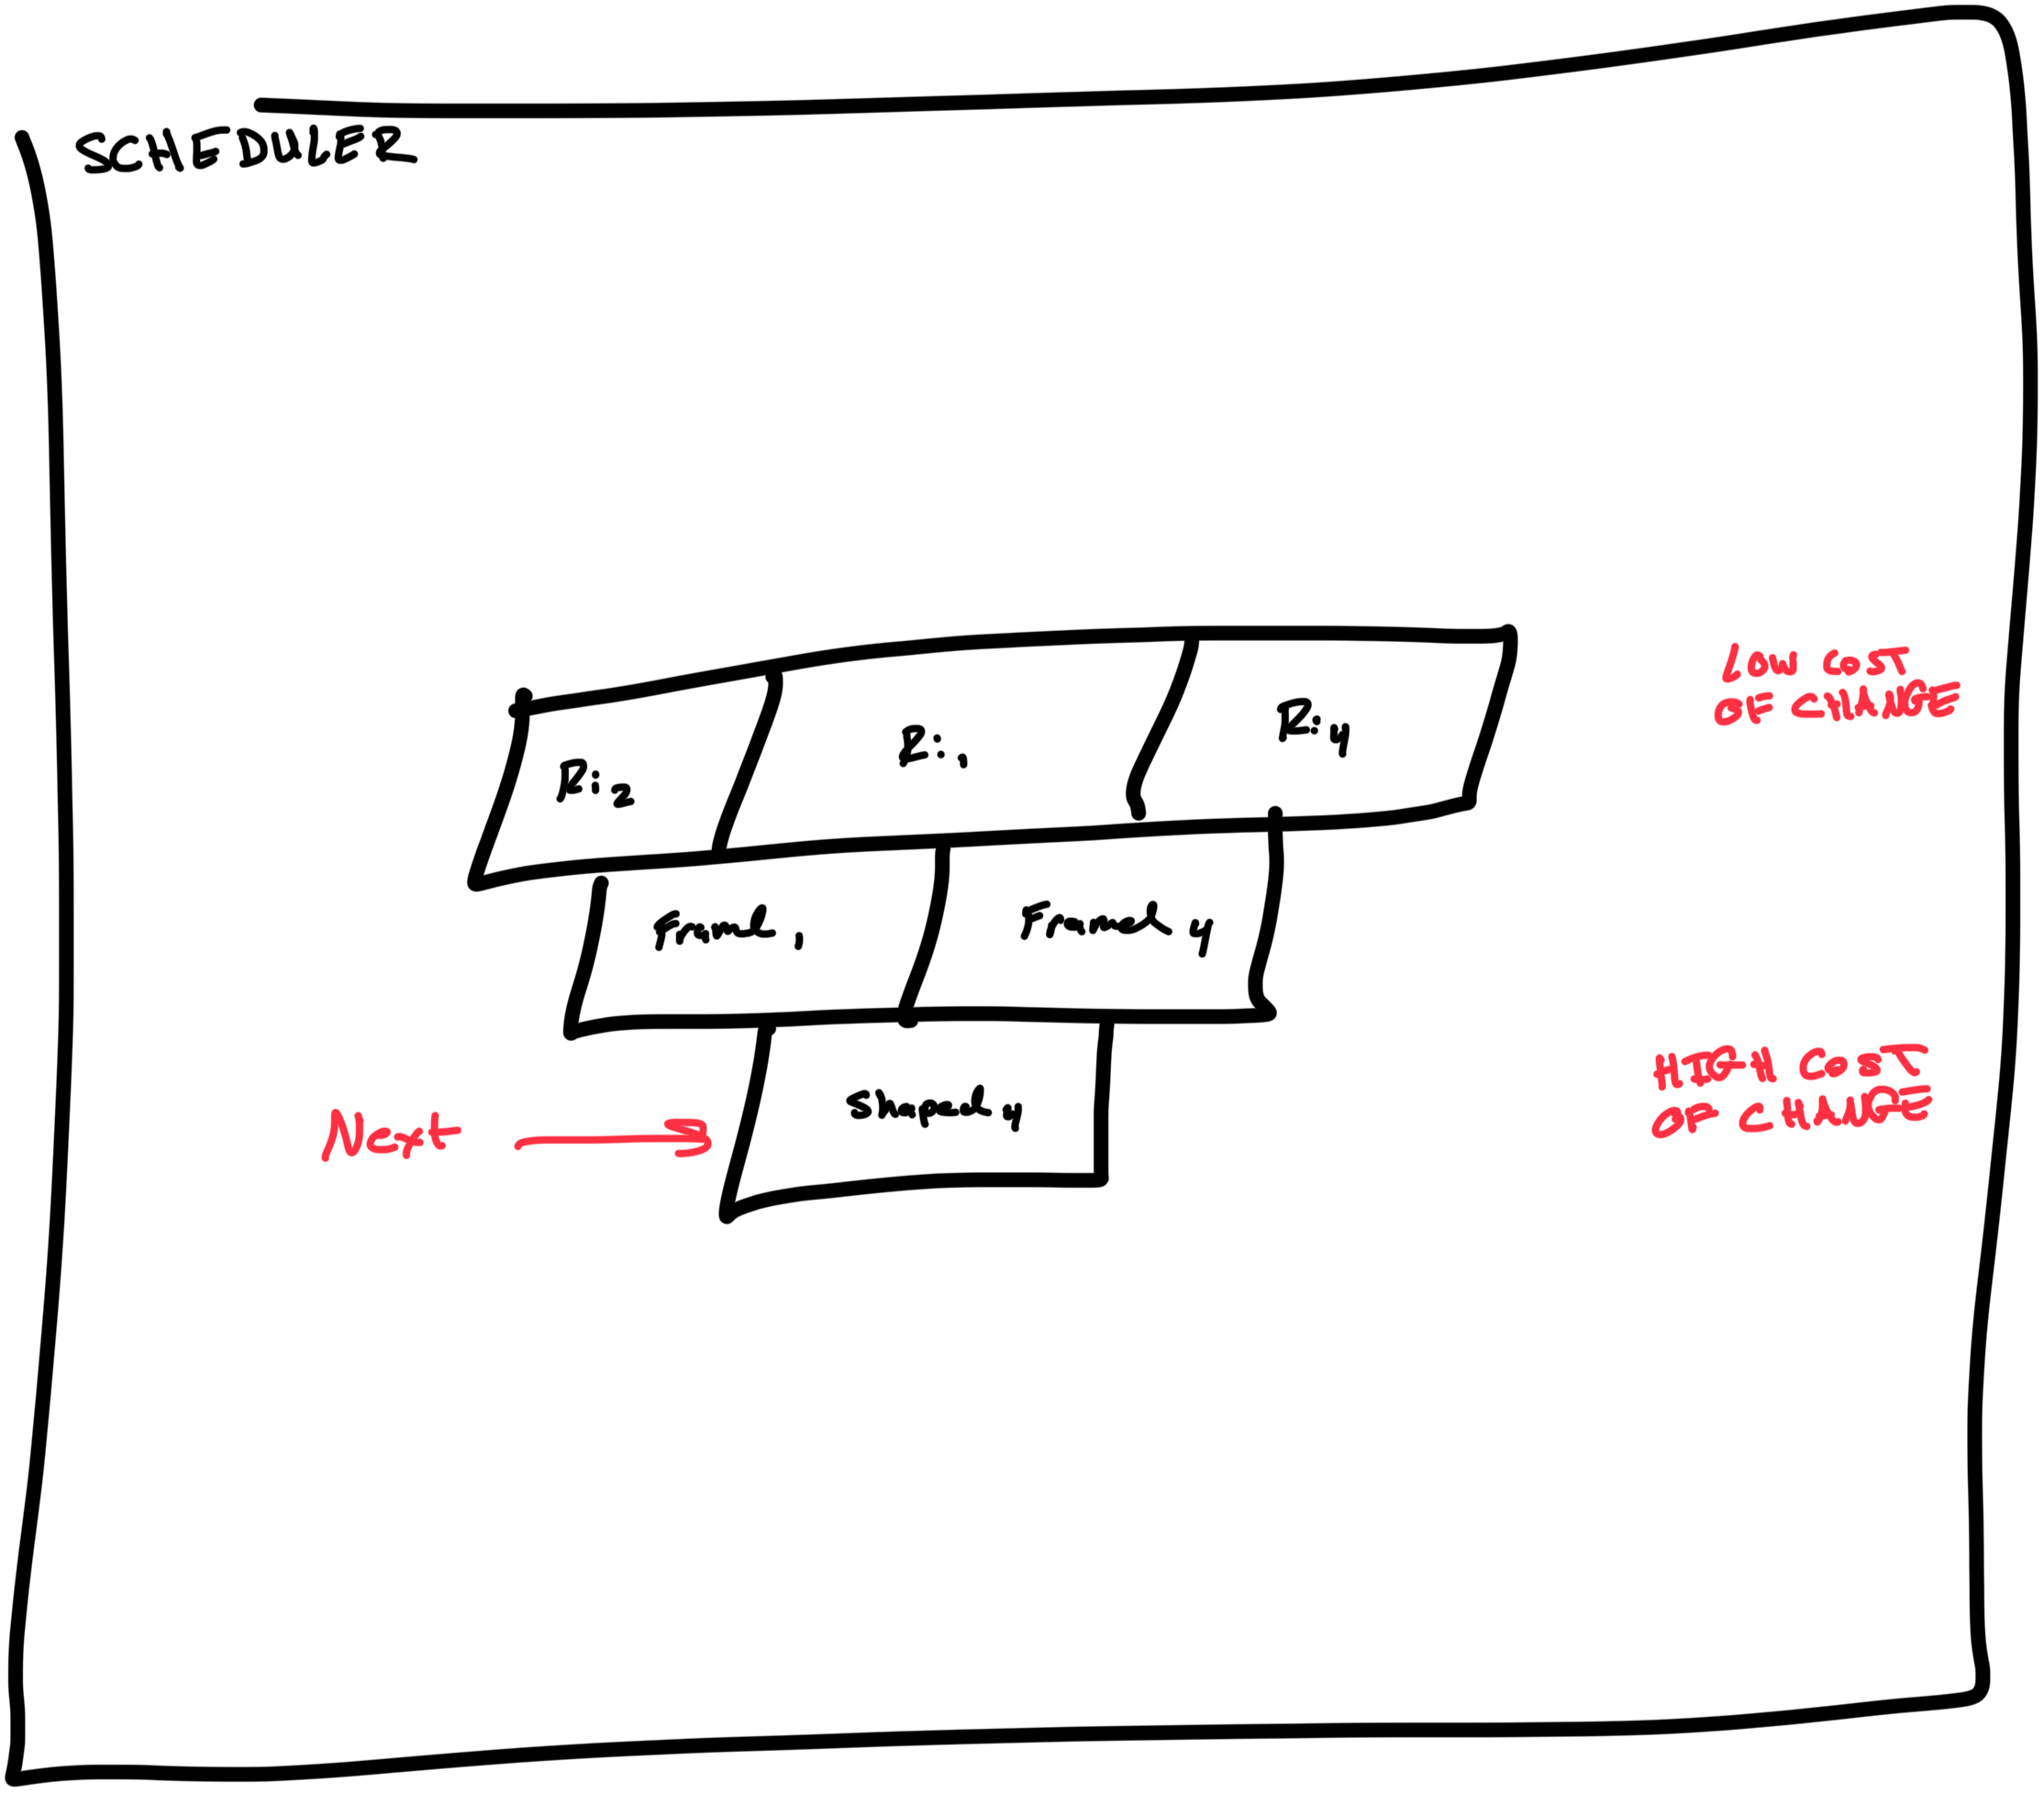
Think of the Hopper like a funnel of options, not commitments. Items at the top are looser. These raw ideas are either selected from the option pool, a private list, or directly placed at the top of the Hopper in the raw ideas row. They can be changed freely and are waiting to be processed into frames (context and desired outcome blocks). Items in the middle are framed and ready to be shaped or in the process of getting framed. Items at the mouth of the funnel are clearly defined concepts ready to be dispatched to development or not or are in the process of getting shaped.
The size of our funnel’s mouth can be structured based on how many people/teams we have to process the work within a product line. I would recommend not having more than three endpoints at the mouth of the funnel per launch team.
Each stage in the funnel is like a bet. We load raw ideas into the Hopper, process some raw ideas into frames, and then shape some framed ideas. Betting on shaped ideas is the most expensive bet since they are commitments for launch teams to develop.
The idea with the Hopper decision-making tool is that we still get a feeling of security about the next few blocks of work coming up. We start to introduce the idea that the items can be changed and that the next items are clearly defined so that we are confident they will get completed during the cycle.
The Hopper helps teams structure where and when to make decisions and to make them and schedule work as close to the moment of execution as possible to ensure the current business context is considered as we move across each of the three betting stages. This also helps to ensure talent can be confidently allocated based on up-to-date availability.
We typically use an online whiteboard application to input, arrange, and track items in the Hopper.
Alternatively, use a workflow visualization board. We can set up those columns as follows:
Raw ideas (ideas or questions we might frame)→Framing (raw ideas we are getting into a tighter problem definition from the context and desired outcome)→Shaping table (framed opportunities to potentially bet on shaping)→Shaping in progress (getting to fewer unknowns and paths around how an approach could work)→Development table (a de-risked path to potentially bet on building out)→Dispatch build cycle (selected packages of shaped paths that are to be dispatched and kicked off next build cycle).
We can do the same with the option pool, which feeds into either the Hopper (Project Scheduler) or reactive boards (not discussed here):
Raw ideas (Discussed, but not prioritized)→Add to reactive board or Add to Project Scheduler [the Hopper] and a column for Not yet items (ideas that are worth sharing but feel off into the future).
If you use the option pool feeder tool then you do not need the Raw ideas column in the Hopper (Project Scheduler).
Scenario Sequencer

This tool is intended to be used in new product development situations—before we have a core product in place. You can also think of it as something that lives one level up in abstraction from the Hopper.
The key here is to understand the interrelationship between all the moving pieces.
The elements in the Scenario Sequencer are written at an altitude (a level of detail) only the creators of its design can determine. In new product development, like improving upon existing products, we figure things out as we go. How far out we anticipate down the layers is dependent on our current progress, our knowledge of the world, how modular or interdependent we need things now versus later, and/or our intuition of the particular space in general.
Zoom in and out, from meta to matter. Use each scale to refine the other. Up or down between the abstract and concrete, in or out between multiple designs, and back and forth between a sequenced design and checking the fit. This tool is as fluid as you need it. Ideally, though, it is not overly focused on implementation details.
Assuming we have a clear direction set for the product, we begin with the “parts”. Parts is a section in which we dump all the things we think we need to do first to address our zero-to-one fitness function.
When developing a new product (not improving an existing product), we want to cover as much surface area as possible—go broad—and focus on novelties first. From there, we will know where it makes sense to dive deeper.
We can then pull elements into the first scenario. We try to complete one scenario sequence before considering an alternative, much like we saw in the Possible Paths tool in the shaping section.
The Scenario Sequencer is a directed acyclic graph. But it also uses foliation so there are distinct layers to unfold the sequence network. This helps to keep the sequence of elements arranged and ordered.
Also, with the Scenario Sequencer, when there are many possible starting points in an interrelated sequence, we can compare elements that have, for example, a similar amount of unknowns, all working in parallel in a given layer, and move each up or down in the sequence to reduce WIP or adjust for things that might have more impact if focused on first.
Putting another element next, below, or to the right, of another element in a sequence gives us something to feed the element into. The scope of work that precedes another element must do whatever the next one requires, and not more. We can define the criteria between each connection point so we know what “relative done” means— to understand each element’s goal—and what each must do so that what comes next can begin.
A lot of people prioritize outcomes rather than how the work connects and builds on itself. Innovation is way more about unknowns and the sequences to solve them. If we sequence based on customer outcomes at this point in the design phase we can end up derailing and losing focus. We must avoid going against the natural sequence.
We typically use an online whiteboard application when reaching for the Scenario Sequencer tool.
GET STARTED
This was a list of practical tools to help take us beyond roadmaps and get deeper into the real work. I have tried to avoid frameworks. I have also avoided the need to discuss backlogs for project work. What we need are tools to help us shape discrete ideas, bet on those whole concepts, and empower launch teams to own the whole project, create tasks they discover for themselves, and cut scope as they see fit while meeting the fitness function criteria.