

Product Analytics
Product Analytics
How to find the analytics needle in the haystack

This publication is broken up into three sections:
TL;DR - For those wanting a quick take
Summary - For those wanting a bit more context and high level points
Article - Main body of work containing fully detailed article and explanations that you might want to consume over several readings
TL;DR
Product analytics is the practice of gathering, analyzing, and interpreting data about the usage of digital products (e.g., smartphone applications and web applications).
Most product analytics provide the tools that examine the behaviour of users within your product.
Organisations of varying maturity will have differing needs for product analytics. The needs for a start-up are qualitatively different from a large enterprise organisation.
Product analytics has its roots in the early 2000s when the first web analytics tools became available.
The most famous model leveraging product analytics is the AARRR model aka pirate model. Pirate metrics, or “AARRR”, is a term coined by entrepreneur and investor Dave McClure.
Other approaches like the HEART framework designed by Kerry Rodden, Hilary Hutchinson and Xin Fu, from Google’s research team can be used within a product analytics set-up.
For your data to be maximally valuable, it needs to be clean, organized, and consistent i.e. data quality needs to be a first class citizen.
With high quality data it is possible to leverage product analytics and influence how you make decisions.
The value of product analytics is becoming hypothesis driven.
Summary
Many businesses today are still stuck in a web analytics ‘page view’ paradigm. They are not taking a user-centric view of their data. A user-centric view is not enough, though.
The main reason to use product analytics tooling is to have a user-centric view. Having a user-centric view from your product analytics tools provides the understanding needed to build a customer journey that makes sense, and to tackle things like optimizing conversion rates across key touchpoints.
Product analytics is the practice of gathering, analyzing, and interpreting data about the usage of digital products (e.g., smartphone applications and web applications).
Most product analytics provide the tools that examine the behaviour of users within your product. This provides critical information to optimize performance, diagnose problems, and correlate customer activity with long-term value.
Organisations of varying maturity will have differing needs for product analytics. The needs for a start-up are qualitatively different from a large enterprise organisation.
Product analytics has its roots in the early 2000s when the first web analytics tools became available. Over the years, product analytics has evolved, becoming more sophisticated and powerful as technology has advanced.
By the early 2010s, the term “product analytics” was being used to refer to the data collected and analyzed to inform product decisions.
With product analytics, teams can measure a broad range of product usage data such as: user engagement, feature adoption and usage, user flows, funnel analysis, and A/B testing.
The most famous model leveraging product analytics is the AARRR model aka pirate model. Pirate metrics, or “AARRR”, is a term coined by entrepreneur and investor Dave McClure.
Other approaches like the HEART framework designed by Kerry Rodden, Hilary Hutchinson and Xin Fu, from Google’s research team can also be used within a product analytics set-up.
The idea is a simple one; to deliver a series of user-centred metrics that allow you to measure the user experience on a large scale.
The value of product analytics is becoming hypothesis driven. Product analytics’ most valuable application is in discovery. It allows your Product Managers to sift through data to uncover new insights.
All the data in the world is no good if it’s impossible to use. For your data to be maximally valuable, it needs to be clean, organized, and consistent i.e. data quality needs to be a first rate issue.
With high quality data it is possible to leverage product analytics and influence how you make decisions.
Article
Many businesses today are still stuck in a web analytics ‘page view’ paradigm. They are not taking a user-centric view of their data. These businesses are making decisions based on aggregate, high-level metrics like pageviews and bounce rate that come from legacy analytics tools.
Despite feeling like you are data-driven, basing decision-making on these types of metrics is fundamentally flawed. These businesses have little or no visibility into the behavior of individual users, including repeat users and buyers. They have no idea how their customers interact across different platforms or touchpoints (website, mobile, in-product, etc.).
The main reason to use product analytics tooling is to have a user-centric view. Having a user-centric view from your product analytics tools provides the understanding needed to build a customer journey that makes sense, and to tackle things like optimizing conversion rates across key touchpoints.
A user-centric view is not enough, though. Businesses need to ensure they are not bogged down by manually tagging events, fixing broken tracking, and managing massive tracking plans and expensive implementation processes. These are all things that can now be accomplished by technology, leaving humans to focus on the most impactful things: driving better experiences through improving the customer journey and optimizing conversion or task completion rates.
Organisational maturity and product analytic needs
Product analytics is gaining increasing traction i.e., Mixpanel, Pendo, Heap, GlassBox compared say to traditional web analytics. However web analytics is still seen as the main tool of analytics for businesses when looking at their digital assets.

Product analytics is the practice of gathering, analyzing, and interpreting data about the usage of digital products (e.g., smartphone applications and web applications). It helps product teams make data-informed decisions to improve user experience and to enhance product features.
Most product analytics provide the tools that examine the behaviour of users within your product. This provides critical information to optimize performance, diagnose problems, and correlate customer activity with long-term value.
Organisations of varying maturity will have differing needs for product analytics. If we consider a basic organizational taxonomy they all have different needs:
Small businesses and start-ups
Scale-ups
Large organisations
Start-ups and small businesses - Start-ups need product analytics to get towards building a quality product or service. Addressing product-market fit through product analytics gives you the quickest and most actionable feedback about your offerings. It also offers quantitative direction towards greater effectiveness as you iterate on your product or service.
Scale-ups - Post-startup companies need product analytics to scale properly. Product analytics is key to effective growth at this stage. It gives you the ability to develop your data value chain, increase user retention, and maximize conversion rates while reducing customer churn.
Large organisations - Enterprise companies need product analytics to stay nimble. Large organisations need to keep improving to adapt to evolving customer demands, and to stay ahead of emerging competitors looking to disrupt the market. Product analytics not only helps enterprise companies iterate and incrementally improve their product; it also gives them data they can blend with other sources—finance, HR, supply chain, retail, sales, marketing, etc.—to gain holistic insights of their entire business.
What is the history of product analytics?
Product analytics has its roots in the early 2000s when the first web analytics tools became available. See this article on web analytics for discussion on web analytics and how modern product analytics evolved out of web analytics.
Over the years, product analytics has evolved, becoming more sophisticated and powerful as technology has advanced. By the early 2010s, the term “product analytics” was being used to refer to the data collected and analyzed to inform product decisions. Today, it is a well-established practice used by many product teams to build and optimize digital products.
What can we measure with product analytics?
With product analytics, teams can measure a broad range of product usage data such as:
user engagement,
feature adoption and usage,
user flows and task completion success,
funnel analysis, and
A/B testing.
The most famous model capturing the above is the AARRR model aka pirate model. Pirate metrics, or “AARRR”, is a term coined by entrepreneur and investor Dave McClure. Despite being popularized in 2007, pirate metrics still hold a lot of relevance, especially in the start-up space.
Google’s HEART + GSM framework, the HEART framework was designed by Kerry Rodden, Hilary Hutchinson and Xin Fu, from Google’s research team.
The idea is a simple one; to deliver a series of user-centred metrics that allow you to measure the user experience on a large scale. These metrics can then be used for decision making in the product development process.
This data can be used to inform product decisions, such as which features to include or remove, how to design the user experience, identifying potential friction points within your app, and how to optimize the product.

What are the benefits of product analytics?
Advanced segmentation capabilities. Behavioral Segmentation allows you to isolate groups of users and evaluate differing responses to identical situations. It shows you who your best customers are and what they like to do, so you can entice high-value users with more of what they like, and less of what they don’t.
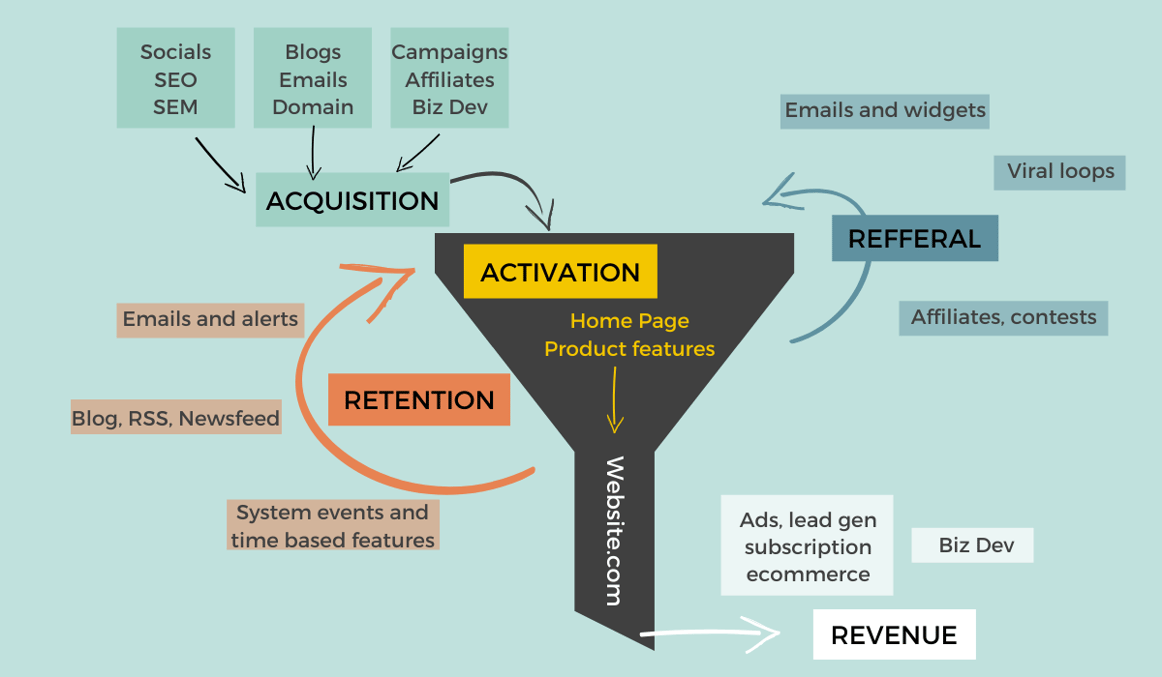
Take a look at how this can play out with the pirate model i.e., ‘AARRR’.
Aligned toward business outcomes like increasing conversion and retention:
Acquisition: Where do your customers come from? Which users are the best prospects, which channels do they favour, and what are your optimal costs for acquiring each user?
Activation: What steps does a user take in your product? Each step on their journey to becoming a paying customer is known as a micro-conversion. Can we optimize the effectiveness of each step?
Retention: Are your customers staying or leaving? Product analytics helps you make happy users happier and steer you towards ways to win dissatisfied users back.
Referral: Are purchasers talking up your product or disappearing? Product analytics helps you measure customer loyalty through their actions, social posts, etc.
Revenue: How do you make money with your product? Streamlining your sales funnel with product analytics will help you reduce acquisition costs and increase the value of the customers you retain.
Give you X-ray vision. An adequate tool will let you measure metrics that you already know are important. A great tool will help you discover the “unknown unknowns” in your product. “Unknown Unknowns”? are the situations, circumstances, pitfalls, uses, and possiblities of your product that you haven’t noticed yet. A great product analytics tool will help you locate these, keeping you several steps ahead of the market and your competitors. This is analytics for exploration, not just reporting.
Save time and resources, and not make life more complicated. Is implementation seamless, or will it give your developers extra work to do? Manual tagging and tracking not only eats up scarce and valuable engineering time, it can also make you less likely to deploy your expensive new tool into production. That’s a no-win situation.
Become hypothesis driven. Product analytics’ most valuable application is in discovery. It allows your Product Managers to sift through data to uncover new insights. A good tool makes it easy to formulate, test, and discard hypotheses rapidly until you get the answers to your most important and valuable business questions.
Some of the questions a product analytics tool enables:
Where are users spending their time and on which tasks?
What behaviors most predict long-term retention?
How do power users navigate your site, and how can you nudge other users to take those actions?
Which channel brings in the people who purchase your large- ticket items?
At which part of the funnel do prospects or customers drop off? Which groups of people drop off more?
Which activities do customers do on web vs mobile? Do they access your site via desktop or laptop during working hours and mobile or tablet after work?
Some basic prerequisites for product analytics
Keep your data clean, dependable and high quality. All the data in the world is no good if it’s impossible to use. For your data to be maximally valuable, it needs to be clean, organized, and consistent. When the dataset is trustworthy to everyone in the organization, teams can work collaboratively across departments, and you can scale. Because speed is critical to iteration, you can quickly answer questions and raise new ones. You can’t do this if your data is a pile of turd.
Contain all the data you need. The only way to be scientific about your approach is to have key customer data. A complete, meticulously governed set of customer data lets you test any hypothesis you want, at any point in the development process. Answers to questions you haven’t even thought of yet...are already there. No manual tracking, advance planning, or engineer time required. Now your data becomes a place to go exploring.
Connect to your data warehouse. The larger your organization, the more important it is to centralize governance of datasets and blend product information with other Business Intelligence data, while using minimal engineering resources. A system that automatically pushes behavioural data to your data warehouse while keeping it organized means your data teams can spend less time munging data, and more time generating insights.
Data management principles to enhance product analytics
Quality at Source: You want data quality at source for your data. This means those developing operational systems must have responsibility for quality of data they generate.
Automated Data Tracking: Manual tracking requires advance planning and uses valuable engineering time. Without automatic data capture, you will always be playing catch-up with your data and the dataset will never be fully complete. Automatic data capture is a must for getting the most use out of any product analytics tool. The ‘cameras’ are always running, and you can look at any footage, from any angle, any time you want.
Data Exchange: APIs are critical for adding context to the events you track, so you can gain a complete view of user behavior on your site. Being able to enrich user data with data on things like in-store purchases, call center interactions, or conversations with sales reps gives you more and deeper answers to the questions you have.
Data Integration: Integrations enrich your dataset by pulling in data from multiple sources and blending it with behavioral data from your product analytics. Can you connect to Stripe, Shopify, Salesforce, Marketo, and Optimizely? The more integrations your product analytics solution can accommodate, the better.
Factors to consider when selecting a product analytics tool?
Product analytics is based on data that is collected and available. If the data is limited or incomplete, it can be difficult to draw meaningful conclusions from it.
Complexity: Product analytics tools can be complex to set up and use, requiring significant technical expertise.
Cost: Product analytics solutions can be expensive and require a significant investment in order to get access to all the features and to get the tool embedded into your organisations way of work.
Data Accuracy: Product analytics tools may not be able to guarantee data accuracy, can be error-prone and may not accurately reflect user behavior. Businesses may need to use other tools to monitor and validate the data. Data quality is only as good as the source system applications that generate the data.
Data Analysis: Product analytics tools may not have the capability to provide detailed analysis of customer data, so businesses may need to use other tools to supplement their analysis.
Data Integration: Product analytics tools may require significant effort to integrate with other systems. Some product analytics solutions may not integrate well with other third-party tools or services so businesses may need to use other tools to supplement their analysis.
Data Privacy: Product analytics solutions often collect and store a lot of customer data, which can be a privacy concern. Product analytics tools might need a bit of configuration to be compliant with data privacy regulations.
Data Scalability: Product analytics tools may not be able to scale to larger datasets, so businesses may need to use other tools to manage larger datasets. Product analytics solutions may not be able to handle large amounts of data or may not scale well as the number of users increases.
Data Security: Data stored in product analytics solutions may not be secure and could be vulnerable to malicious attacks. Some work could be required to ensure enterprise grade security standards are met.
Data Sharing: Product analytics tools may not have the capability to easily share data between users, so businesses may need to use other tools to do so.
Data Source Limitations: Product analytics technologies are generally limited to data from web and mobile sources. Integrating data from the contact center may involve further integration work.
Data Visualization: Product analytics tools may have limited data visualization capabilities, making it difficult to interpret the data, so businesses may need to use other tools to supplement their analysis.
Customization: Product analytics tools may not offer sufficient customization options. Product analytics tools often lack the ability to customize data or create custom reports or flexibility in terms of data collection, visualizations, or reporting.
Standardization: Product analytics technologies lack standardization, making it difficult for teams to compare and analyze data across different platforms.
Support: Some product analytics solutions may not offer adequate customer support or documentation to help users understand how to use the tool.
A/B testing: Product analytics solutions often lack features to enable A/B testing, which can be useful for testing different versions of a product or feature in production.
Non-exhaustive Overview of Some Product Analytics Tools
Mixpanel
Mixpanel is a powerful analytics platform for tracking user activity on websites and mobile apps.
It allows businesses to measure, understand, and optimize user engagement with their product.
Mixpanel’s platform is built on real-time data streaming and event-based analytics.
It offers segmentation capabilities to help businesses understand how their users are engaging with their product.
Mixpanel provides a wide range of tools to help businesses make informed decisions.
It includes a funnel analysis feature to help businesses identify user engagement drop offs and optimize user experience.
Mixpanel also provides a cohort analysis feature to understand user retention and engagement over time.
It offers dashboards to help teams visualize and analyze data quickly.
Mixpanel has an API that allows businesses to integrate their app data with other services.
It allows businesses to automate user engagement campaigns with its A/B testing feature.
Heap.io
Heap.io is an automated analytics platform that helps measure user engagement and user behavior.
It helps businesses understand their users, drive user engagement, and make data-driven decisions.
It provides insights on user behavior, usage trends, and user engagement metrics.
It provides real-time analytics, event tracking, and customer segmentation.
Heap.io provides an intuitive and user-friendly dashboard for easy analytics tracking and monitoring.
It supports multiple platforms including web, mobile, and server-side applications.
Heap.io supports custom events, event tracking, and custom user properties.
It is integrated with popular third-party services such as Zapier, Segment, and Mixpanel.
Heap.io offers a free plan and a variety of subscription plans to suit different businesses.
Heap.io provides customer support via email and chat.
Ideas to get started on product analytics
Understand what product analytics is and how it can help you make decisions?
Ask what sort of user data do you need to know (e.g., track user activity, key events, and KPIs)?
Figure out the key criteria your organization has before selecting or short-listing a product analytics tool for your business.
Identify some quick wins where you can implement product analytics in a way that won’t disrupt user experience or your way of work.
How can you use behavioural segmentation to gain insights into user behavior.
Leverage A/B testing to optimize user experience if your organization has already got a good data foundation and organizational maturity.
Use product analytics to monitor user feedback and act on it quickly.
Utilize user engagement metrics to understand the link between user engagement and retention for your organisation.
Integrate product analytics with other tools to get a holistic view of user activity and see if there are additional value adding opportunities like using predictive analytics to anticipate user behavior and optimize outcomes (e.g., churn).
Postscript
Before you go, please could you do the following?
Subscribe
Share
Survey
Star
If you got value from reading the article a star liking would be highly appreciated!
Resources
AppCues on HEART framework
CleverTap on HEART framework