

Screed Time

At the end of 2019 and beginning of 2020, I worked up some resolutions that I wanted to maintain over the course of the year. Overall, I failed pretty damn hard. COVID-19, isolation, etcetera etcetera don’t make for the best year for self-improvement. However, I will say that on a few things I was able to continually be more conscious of them and did maintain a consistent scoreboard on. One of those things was how much my face is staring at my goddamn phone.
Before I share with you the data and my insights drawn from them, I want to say first that, yes, I am aware these numbers are like, “Oh my god, Rob. What are you doing all day on your phone?!” Second, I am not a data scientist. All of these charts were built in Google Sheets (eat your heart out, accountants) with a few simple formulas here and there. Third, take my totals on a day-to-day basis with a grain of salt due to the following: I am an unabashed consumer of ASMR videos on YouTube when the need to fall asleep comes. @ me, betches.
First, let’s look at the past year’s worth of data day by day in a very large and pretty chart of madness:
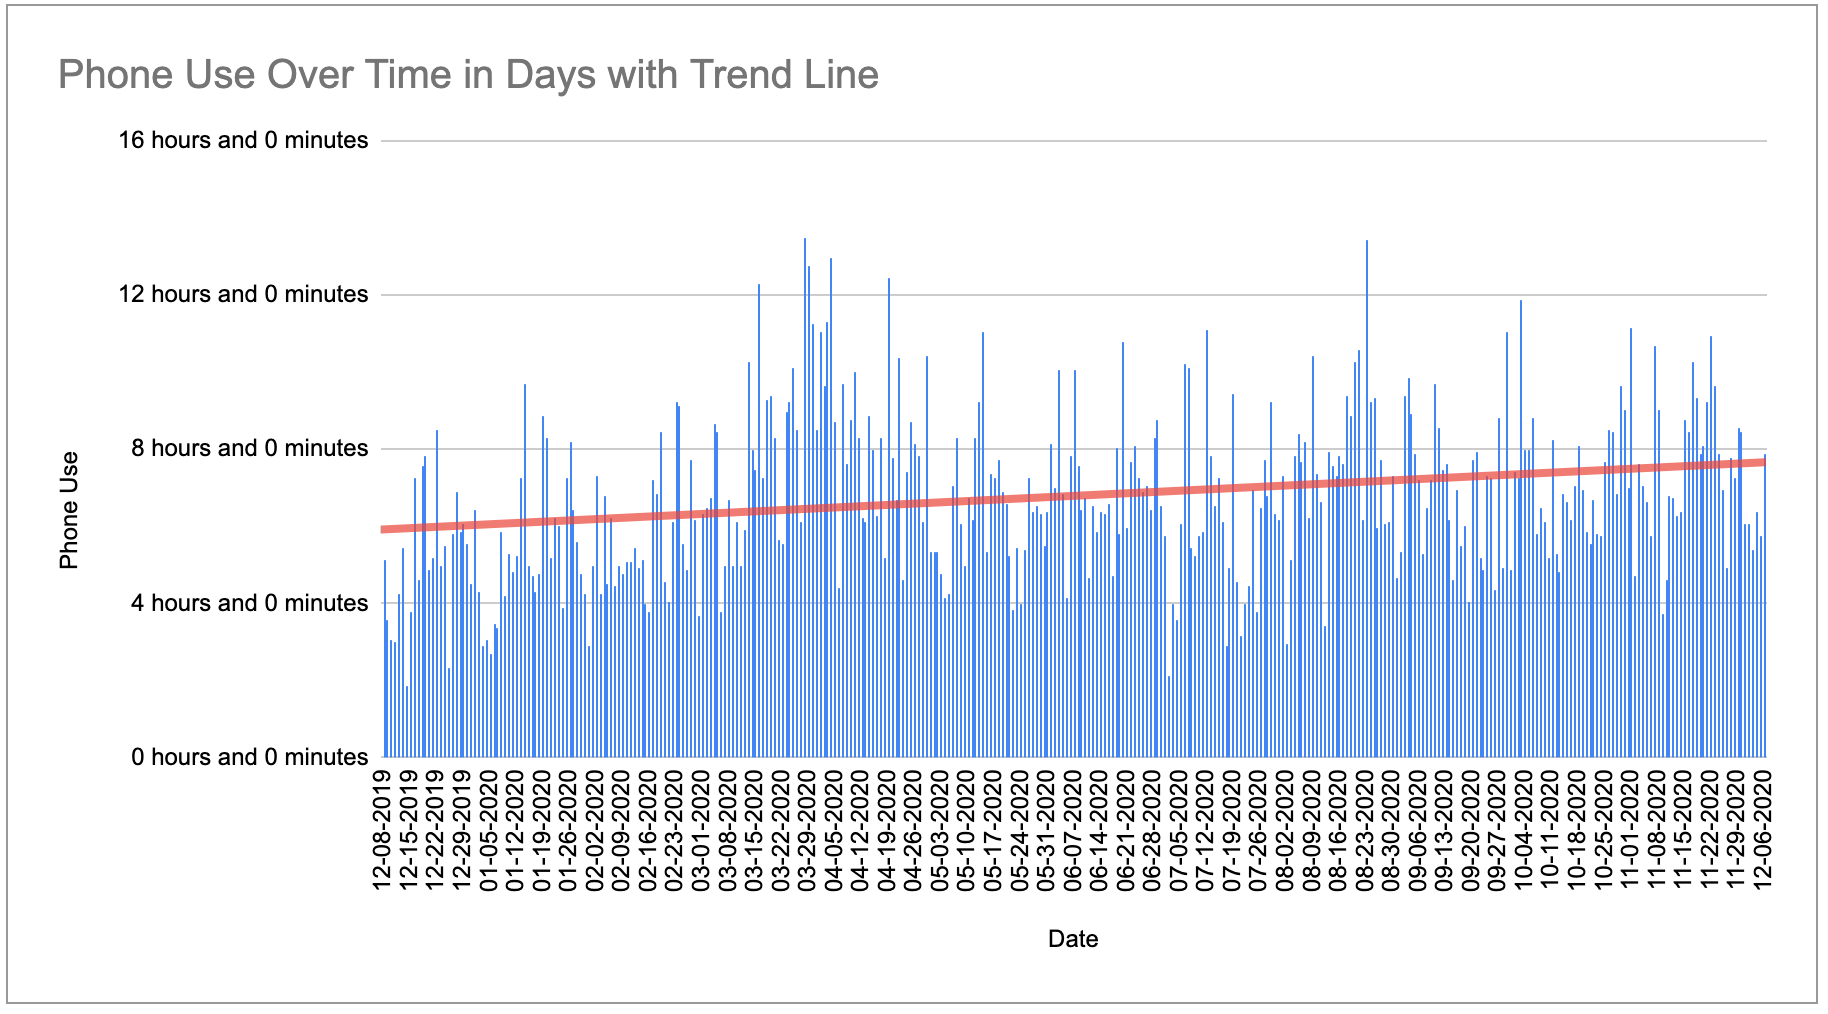
I don’t think there’s too much to gain from this aside from the red trend line going up and to the right. Ungood! I am not a data visualization expert but breaking this data down in different ways leads to some interesting insights. Let’s take a look at month over month daily average:
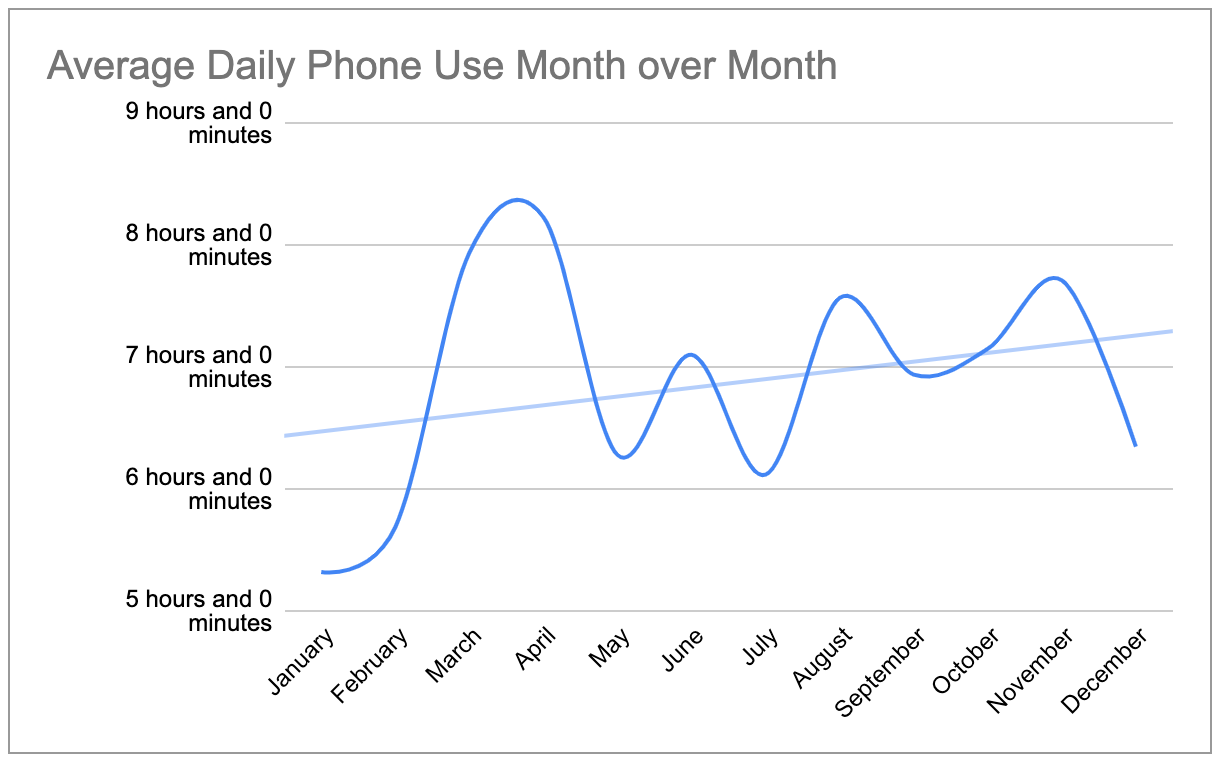
It’s not the sexiest chart ever. That’s the Venn Diagram. However, there are a few things I glean from this. I started out the year on point and determined to use the phone less day by day. Then in March and April, COVID-19 hit the midwest hard and, well, what the fuck else was I gonna do with my time aside from work and stare at my phone all day texting most of you fools. By May, I realized this was starting to be a daily problem and promptly cut back as much as I could, which was somewhat successful until August and early fall. The winter has since brought about the issue of isolation once again and thus more time looking downward at my iPhone. We can look at this week over week and see the exact time COVID-19 hit:
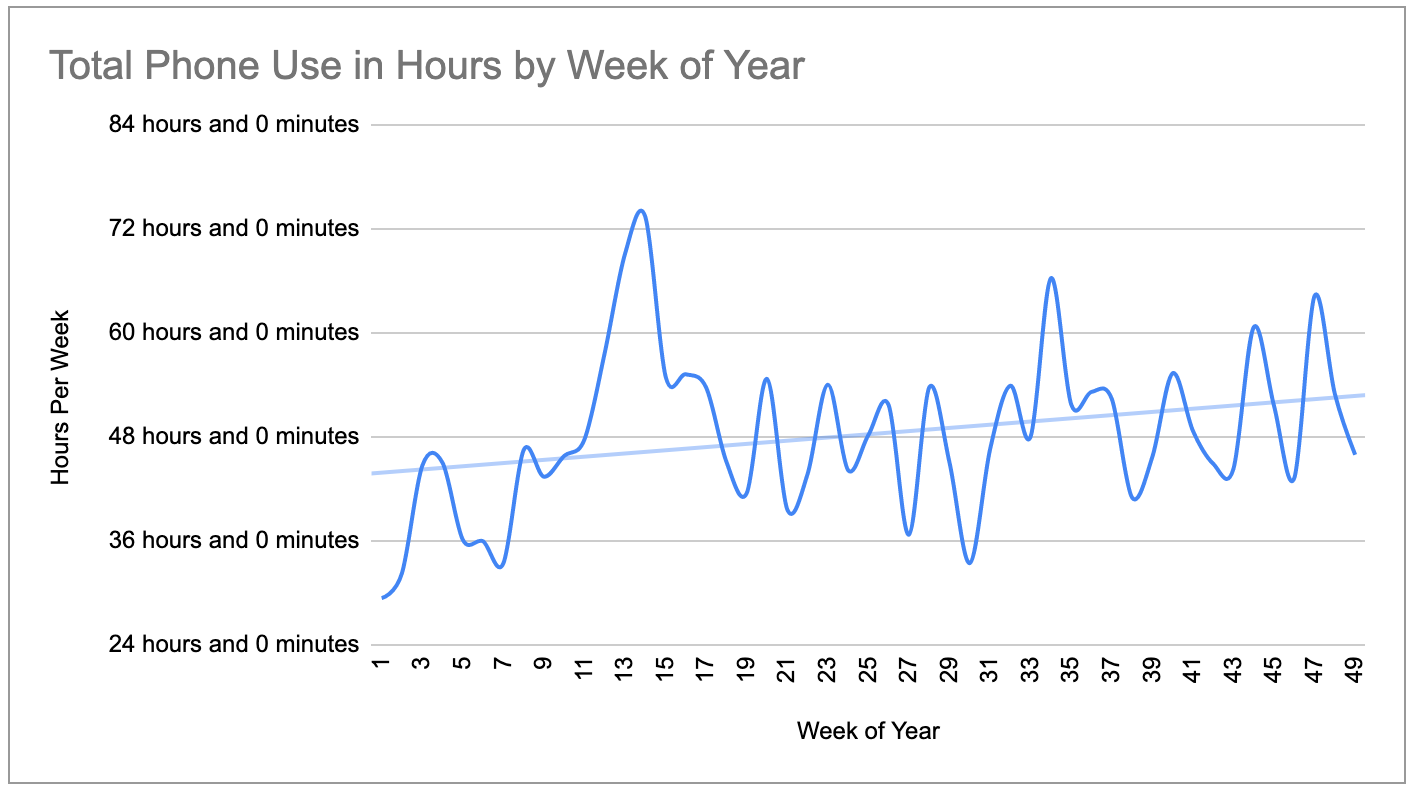
Hoooo boy, March was a bad one. One thing I think is interesting here is that the spikes and dips seem to ebb and flow on a week to two week basis. I do not have any idea what could cause that aside from my own mental health ebbs and flows.
One final chart that I’d like to share tells an interesting story at a daily level by day of the week:
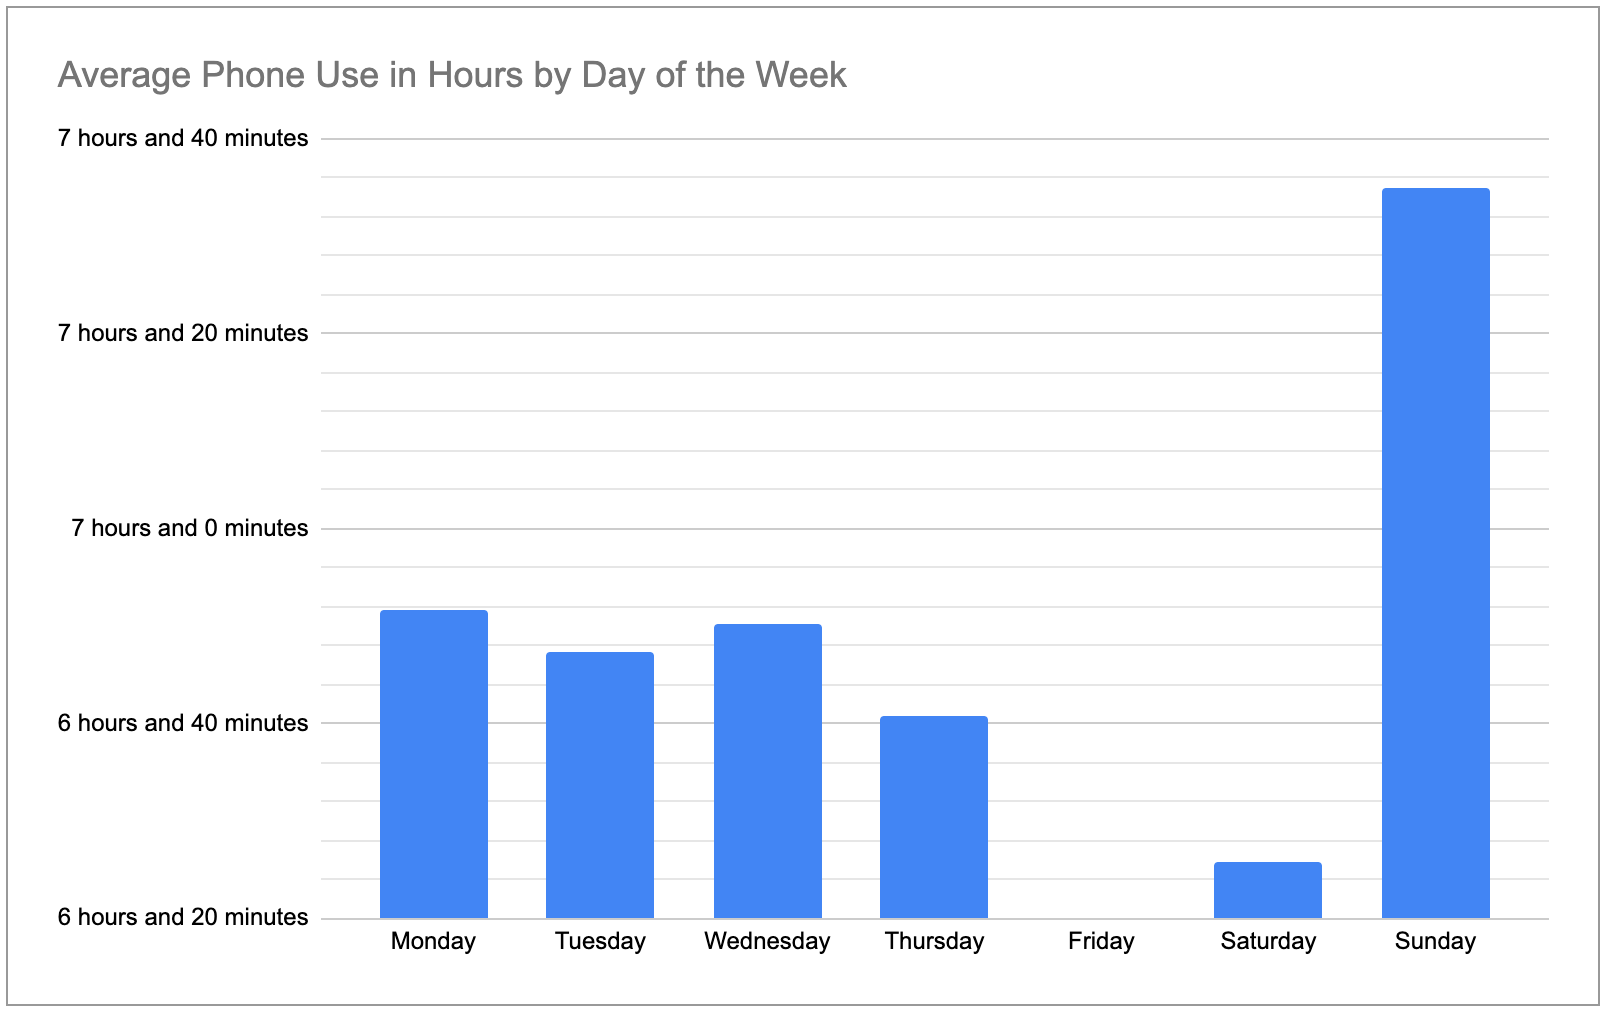
First, Google Sheets blows and won’t let me adjust the vertical axis here so that Friday doesn’t look like 0. Shut up, accountants. Second, the trend going through the week is actually downward until Sunday’s immense outlying average. Over the course of the week, you become more focused on work, you - normally - start to see people later in the week socially and therefore aren’t looking at the phone. You spend Saturday itself socializing in person. Sunday is the day of the week when you’re mostly by yourself or with your partner at home and, to me, is the real day to focus on this coming year when trying to minimize phone use. The Sunday Scaries are still gonna be there, even if you look at your phone the whole day or not.
Thank you for reading this unedited, assumption-filled post. Let me know your thoughts and share this with anyone you may think finds it cool!
Best,
Rob
P.S. Here’s a cool poem I read in The Atlantic the other day:
There’s Earth. Amethyst. Cherries in heat. Trees drooling sugar. Midnight’s blue song. So what heaven? That kingdom wholed by a coy god’s touch? Where green and the river began? If all-father tells it: first you slave and shiver and shuck and die and die for heaven’s around-back gate to budge loose at the bent speck of you. Lies. No doors, no lines. Look right: me and mine kissed alive—greening. Curl up and chime against us—the river’s born here.
“Against Heaven” by Kemi Alabi
P.P.S. Hit up the latest from The Nude Party. Always a good time with them boys.