

Creating a Knack Query in Power BI
Creating a Knack Query in Power BI

Introduction
Knack is a remarkable platform that empowers users to create customised web applications, automate workflows, and efficiently collect data. However, one aspect where it falls short is its data visualisation and summarisation capabilities.
This is where Microsoft Power BI compliments it well, allowing you to seamlessly extract data from Knack's API and present insightful analytics.
Before you begin, you’ll want to decide if you want to query a Knack table directly (object-based query), or a view on one of your pages, such as a grid or list view (view-based query)
By using an object-based query, you will return all of the available fields within the specified table.
By using a view-based query, you will return only the fields visible within that view.
It is advisable to use the latter method, as a lot of the data transforming can be done in Knack before it reaches Power BI, such as determining what fields you want to return (including connected record fields), filtering to particular criteria (e.g. within a date period), and limiting how many records to return.
This can help significantly speed up your query when your data is refreshed by limiting the number of fields and records that are returned, and will ensure you don’t exceed your daily API call limit.
Get API details from Knack
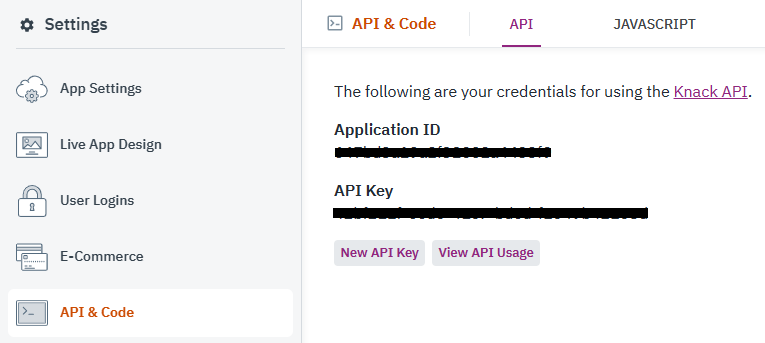
To start off, find the Application ID and API Key values from your Knack app. These are located in the Settings > API & Code section of the Knack Builder.
Add a web query
In Power BI, add a new Web query via the Get data menu.

Enter query parameters
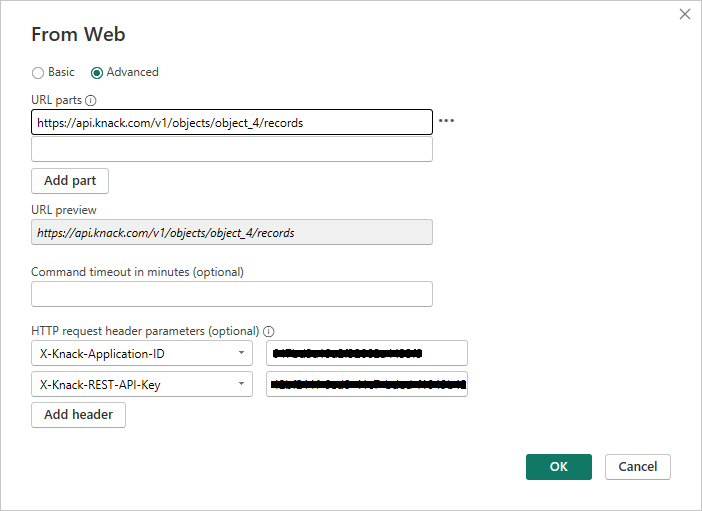
Switch the toggle from Basic to Advanced to expand the parameters, and input the following:
URL parts
For object-based queries:
(Replace object_xx with the object key you want to query)
https://api.knack.com/v1/objects/object_xx/records For view-based queries:
(Replace scene_xx and view_xx with the scene key and view key you want to query)
https://api.knack.com/v1/scenes/scene_xx/views/view_xx/recordsHTTP request header parameters
X-Knack-Application-ID : [Insert your Knack application ID]
X-Knack-REST-API-Key : [Insert your Knack API key]
Note: In a later tutorial, I will demonstrate how to query using a user token to prevent exposing your app’s API key.
Once this is done, click OK.
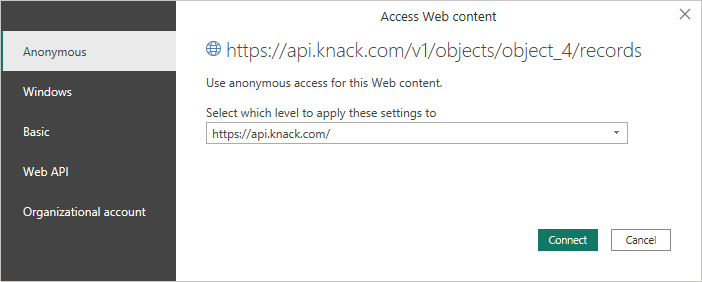
With your first query, you will be prompted to specify how to connect. For Knack data, you can always choose the Anonymous connection, and click Connect.
If you receive any ‘bad request’ errors at this stage, it is likely that the URL or header parameters have been entered incorrectly.
Remove assumed steps
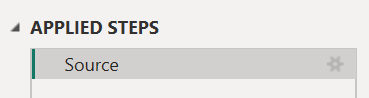
In the Query Editor window, Power BI may automatically assume some steps. For the purpose of this tutorial, right-click the step directly below the Source step and click Delete until end to remove all additional steps. You should now be left with just the Source step.
Query summary
In the middle section, you should see a table with the following fields:
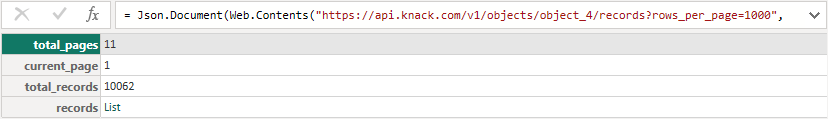
total_pages: Indicates the number of pages returned; by default, there are 25 records returned per page, and you can only return one page at a time
current_page: Indicates the current page that has been returned, which is default to 1; this field will be useful later when we want to return records across all available pages
total_records: Indicates the total number of records across all pages
records: Contains all the field data in your records in a list format

Increasing returned records per page
You are very likely to want to return more than 25 records at a time, so the easiest way to do this is to add in an additional part of our URL to specify how many records to return per page.
Right-click on the Source step in the right-hand panel and click Edit Settings, to open a window similar to the one we entered our Web query parameters into.
In the URL parts field, add the following string to the end of the existing URL: ?rows_per_page=1000.
Your URL should now look something like this:
https://api.knack.com/v1/objects/object_xx/records?rows_per_page=1000Once this is done, click OK.
You will now see that the number in the total_pages has reduced. If the total_records is 1,000 or less, there should only be 1 total page.
Note that the maximum number of records that can be returned per page is 1,000, and you will need to fetch any subsequent pages with pagination. There will be more on this in a later tutorial.
Expand columns
Now we will expand the data fields. Clicking on the List link in the records value will return all the records in a list format, however we’ll still need to convert this into a table to display all the field values.
In the top menu, click on Transform > To Table, and press OK on the next window without changing the settings. You will still see one single column of records titled Column1, but you will see a new icon to the top-right of the column heading to expand the records.

Click on the Expand column icon at the top of the Column1 column to open a list of available columns.

Uncheck the Use original column name as prefix, and click OK.
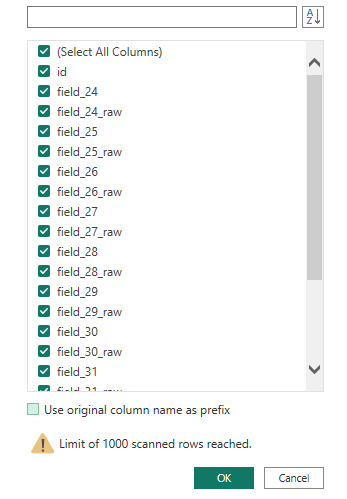
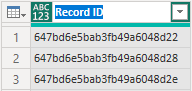
This will now display all the columns in the table of records with field keys correlating to those in your Knack table you have queried, as well as the record’s ID.
Note that if you add in any new fields in your Knack table, you will need to manually re-expand all columns. There is a more efficient method of expanding all columns dynamically in a later tutorial.
Choose column formatting
Note that it may appear as though some of the records have duplicate values, although one has column name field_1 and the other as field_1_raw. This is because by default the query return both HTML and raw data format, as documented here.
You can update the URL once again to return one or the other by adding &format=html or &format=raw and then re-expand the columns again.
Your URL should now look something like this:
https://api.knack.com/v1/objects/object_xx/records?rows_per_page=1000&format=htmlI recommend using the HTML format to prevent the need to expand the columns out further, but it means you will need to do some text transformation on any Connection field types (more on this in a later tutorial)
Change column names
Field names will be returned in the field key format (e.g. field_1). You will need to rename each column one-by-one by double-clicking the column heading and editing the name.
There is a better method of renaming all columns dynamically based on the field names in your Knack app in a later tutorial.
Change field types
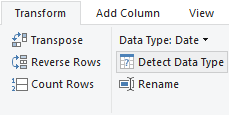
Now we will change the field types to match the type of data they are, such as number and date columns.
By default, all fields will be formatted as alphanumeric (any) type.
You can change one or more by highlighting the relevant columns and using the Transform > Detect Data Type function.
Change the query name
Lastly, we should change the name of the query, as the default name will likely not make much sense.
You can do this by double-clicking the query in the Queries list on the left and editing the name.
Conclusion
If you followed all of the steps above successfully, you should see a query that resembles something like below, with some steps to expand, rename and change column types.
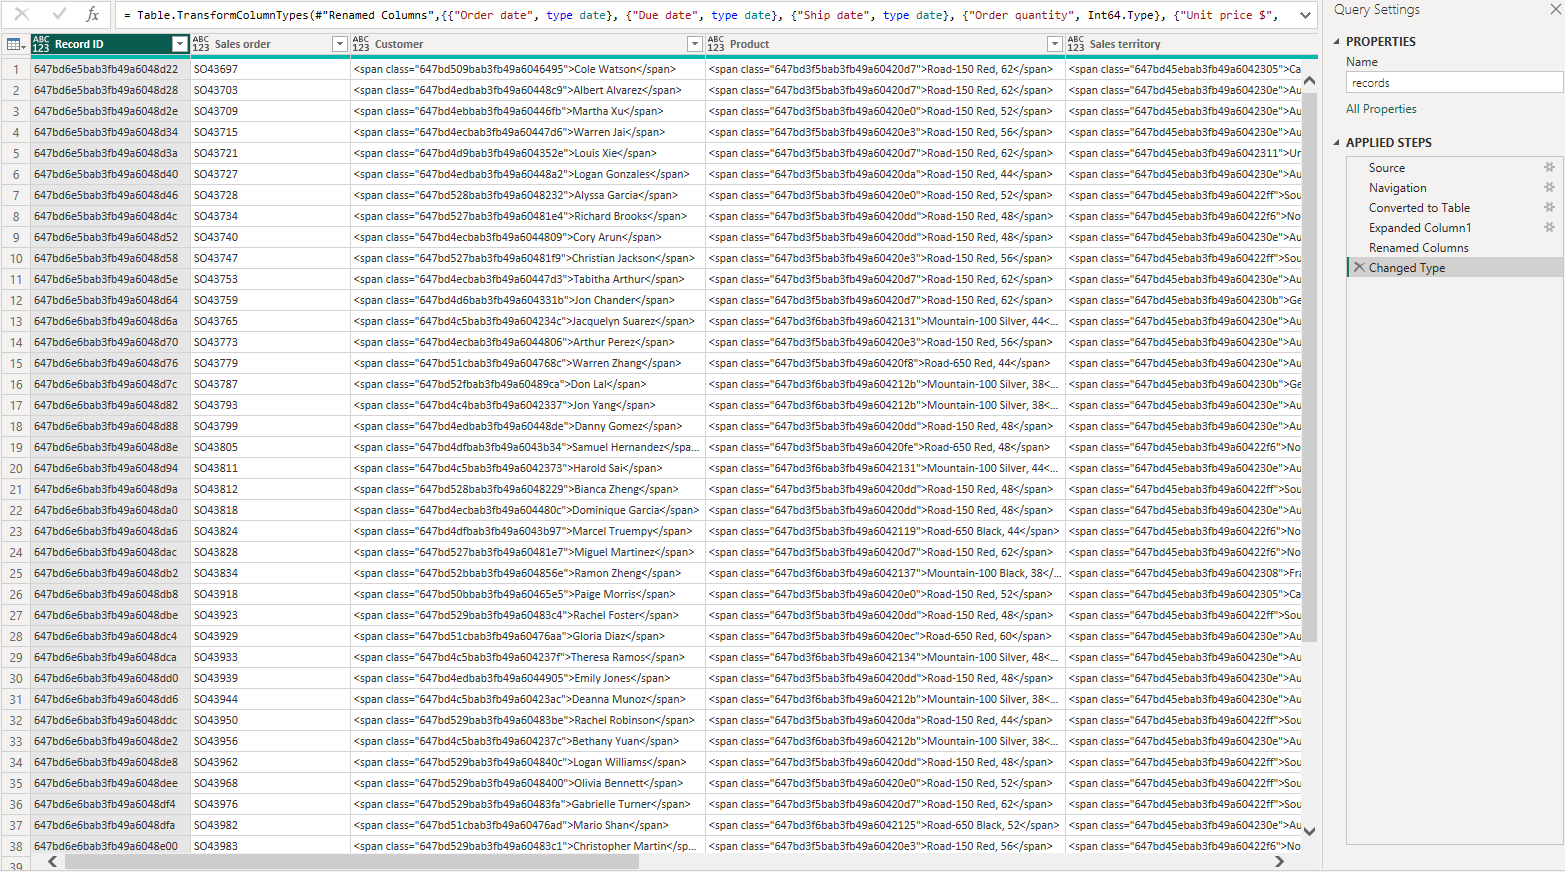
Once you are happy with this, you can Close and Apply the Query Editor window to apply the changes in the report editor.
You can now begin graphing your data as you please in the report editor, and with a simple click of the Refresh button, your data will be up to date as it appears in Knack.