Week 13 Roundup: Wake Me Up Before You Kyogo
Week 13 Roundup: Wake Me Up Before You Kyogo
By virtue of overcoming Dundee United's late equaliser and St. Johnstone holding out for a victory over Rangers, Celtic extend their lead at the top of the table to seven points.

Please Note: This post may be too long for Gmail users. If the post is cut short due to your email provider, the rest can be viewed at stephenrussell.substack.com. Alternatively, use the Substack app here:

Contents
Celtic 4-2 Dundee United
St. Johnstone 2-1 Rangers
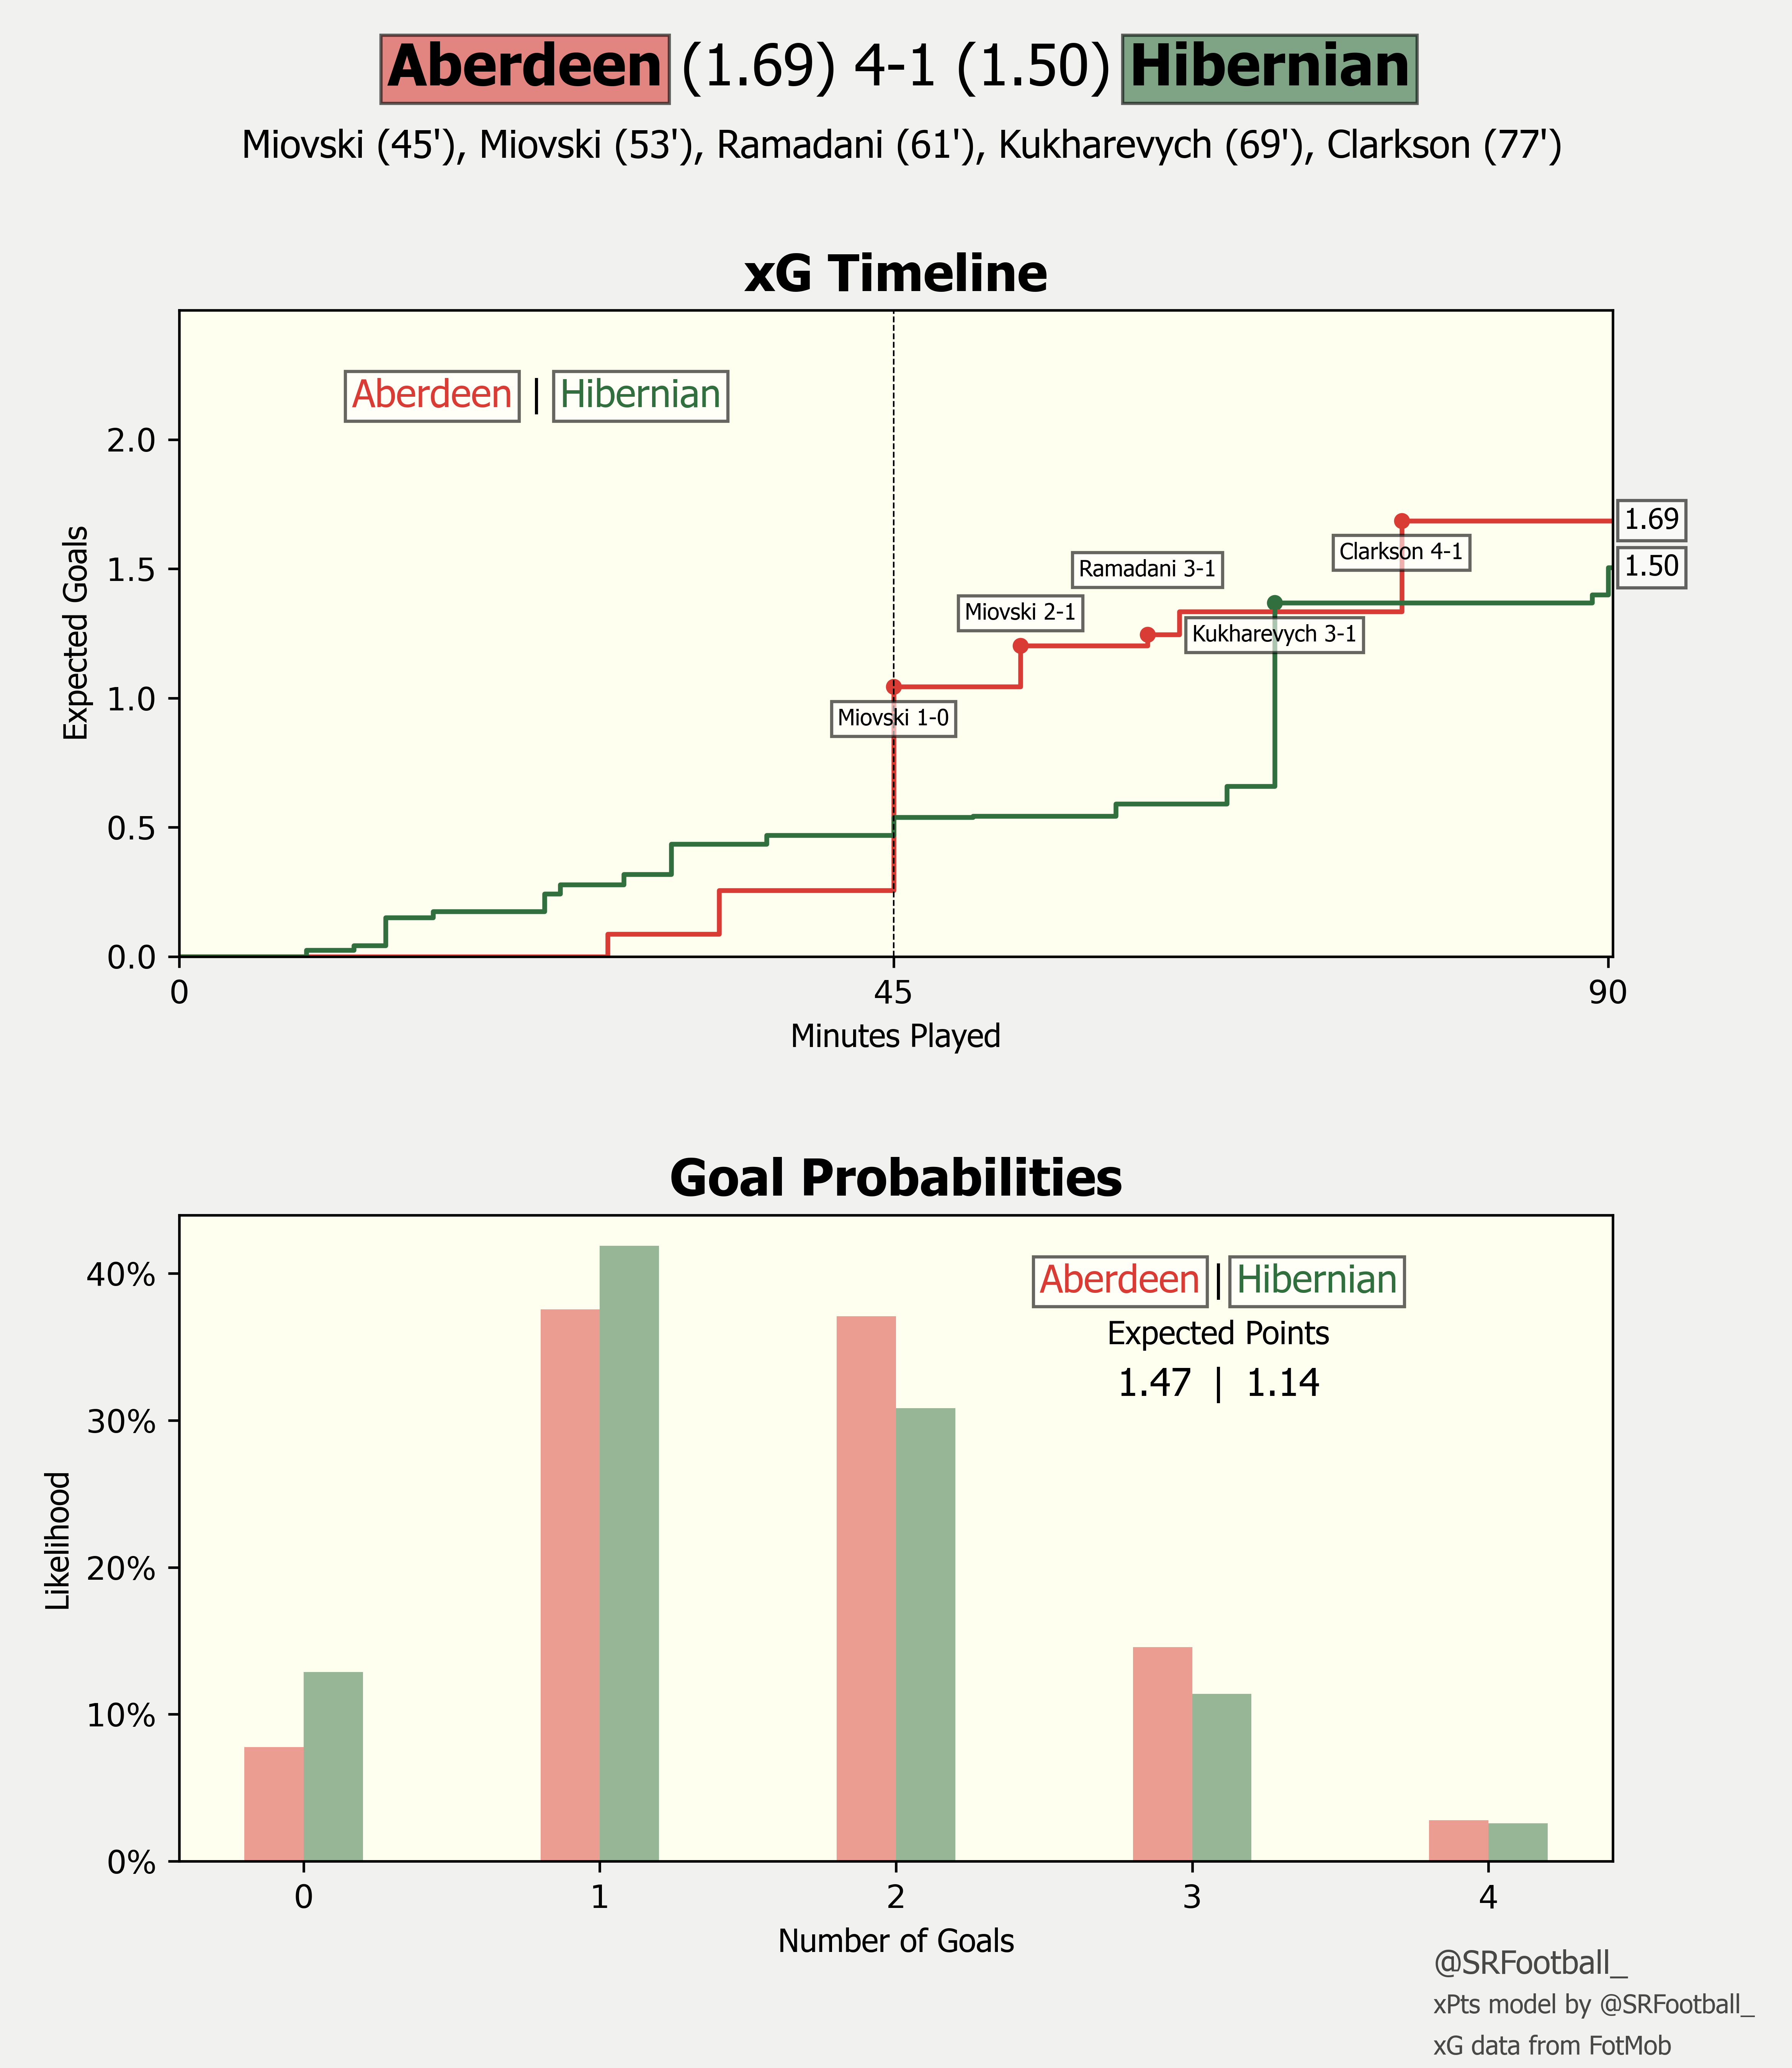
Aberdeen 4-1 Hibernian
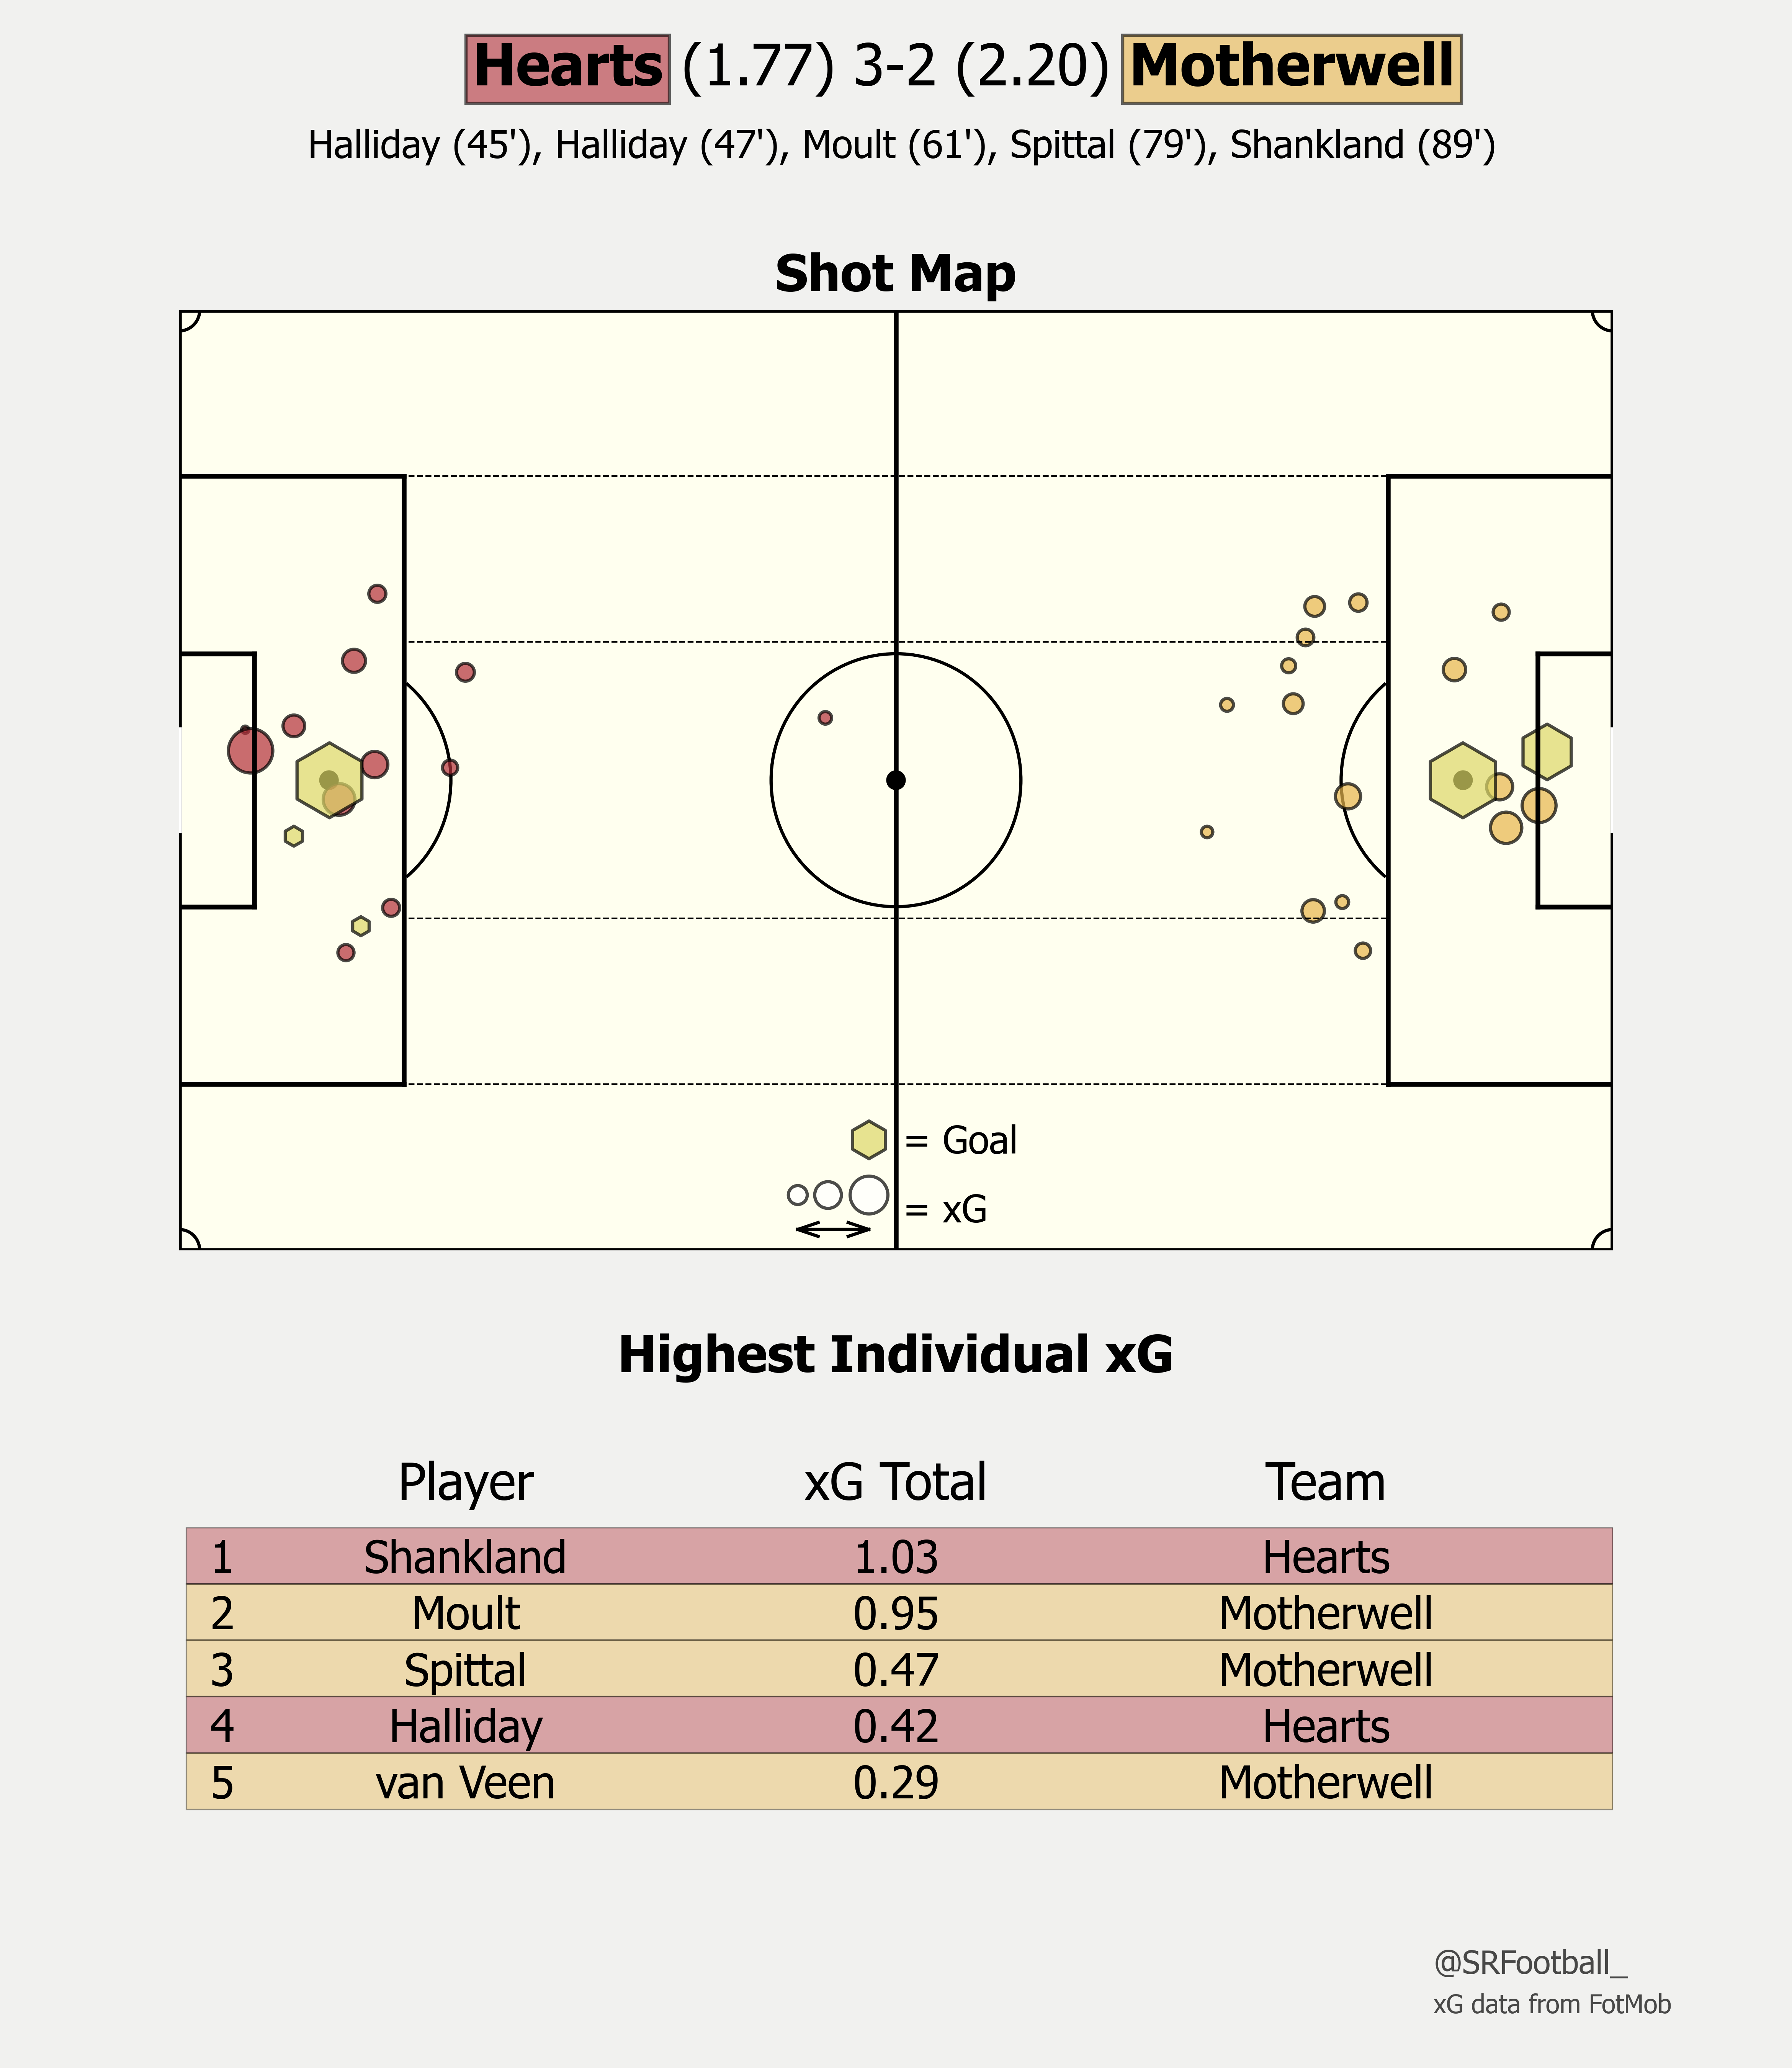
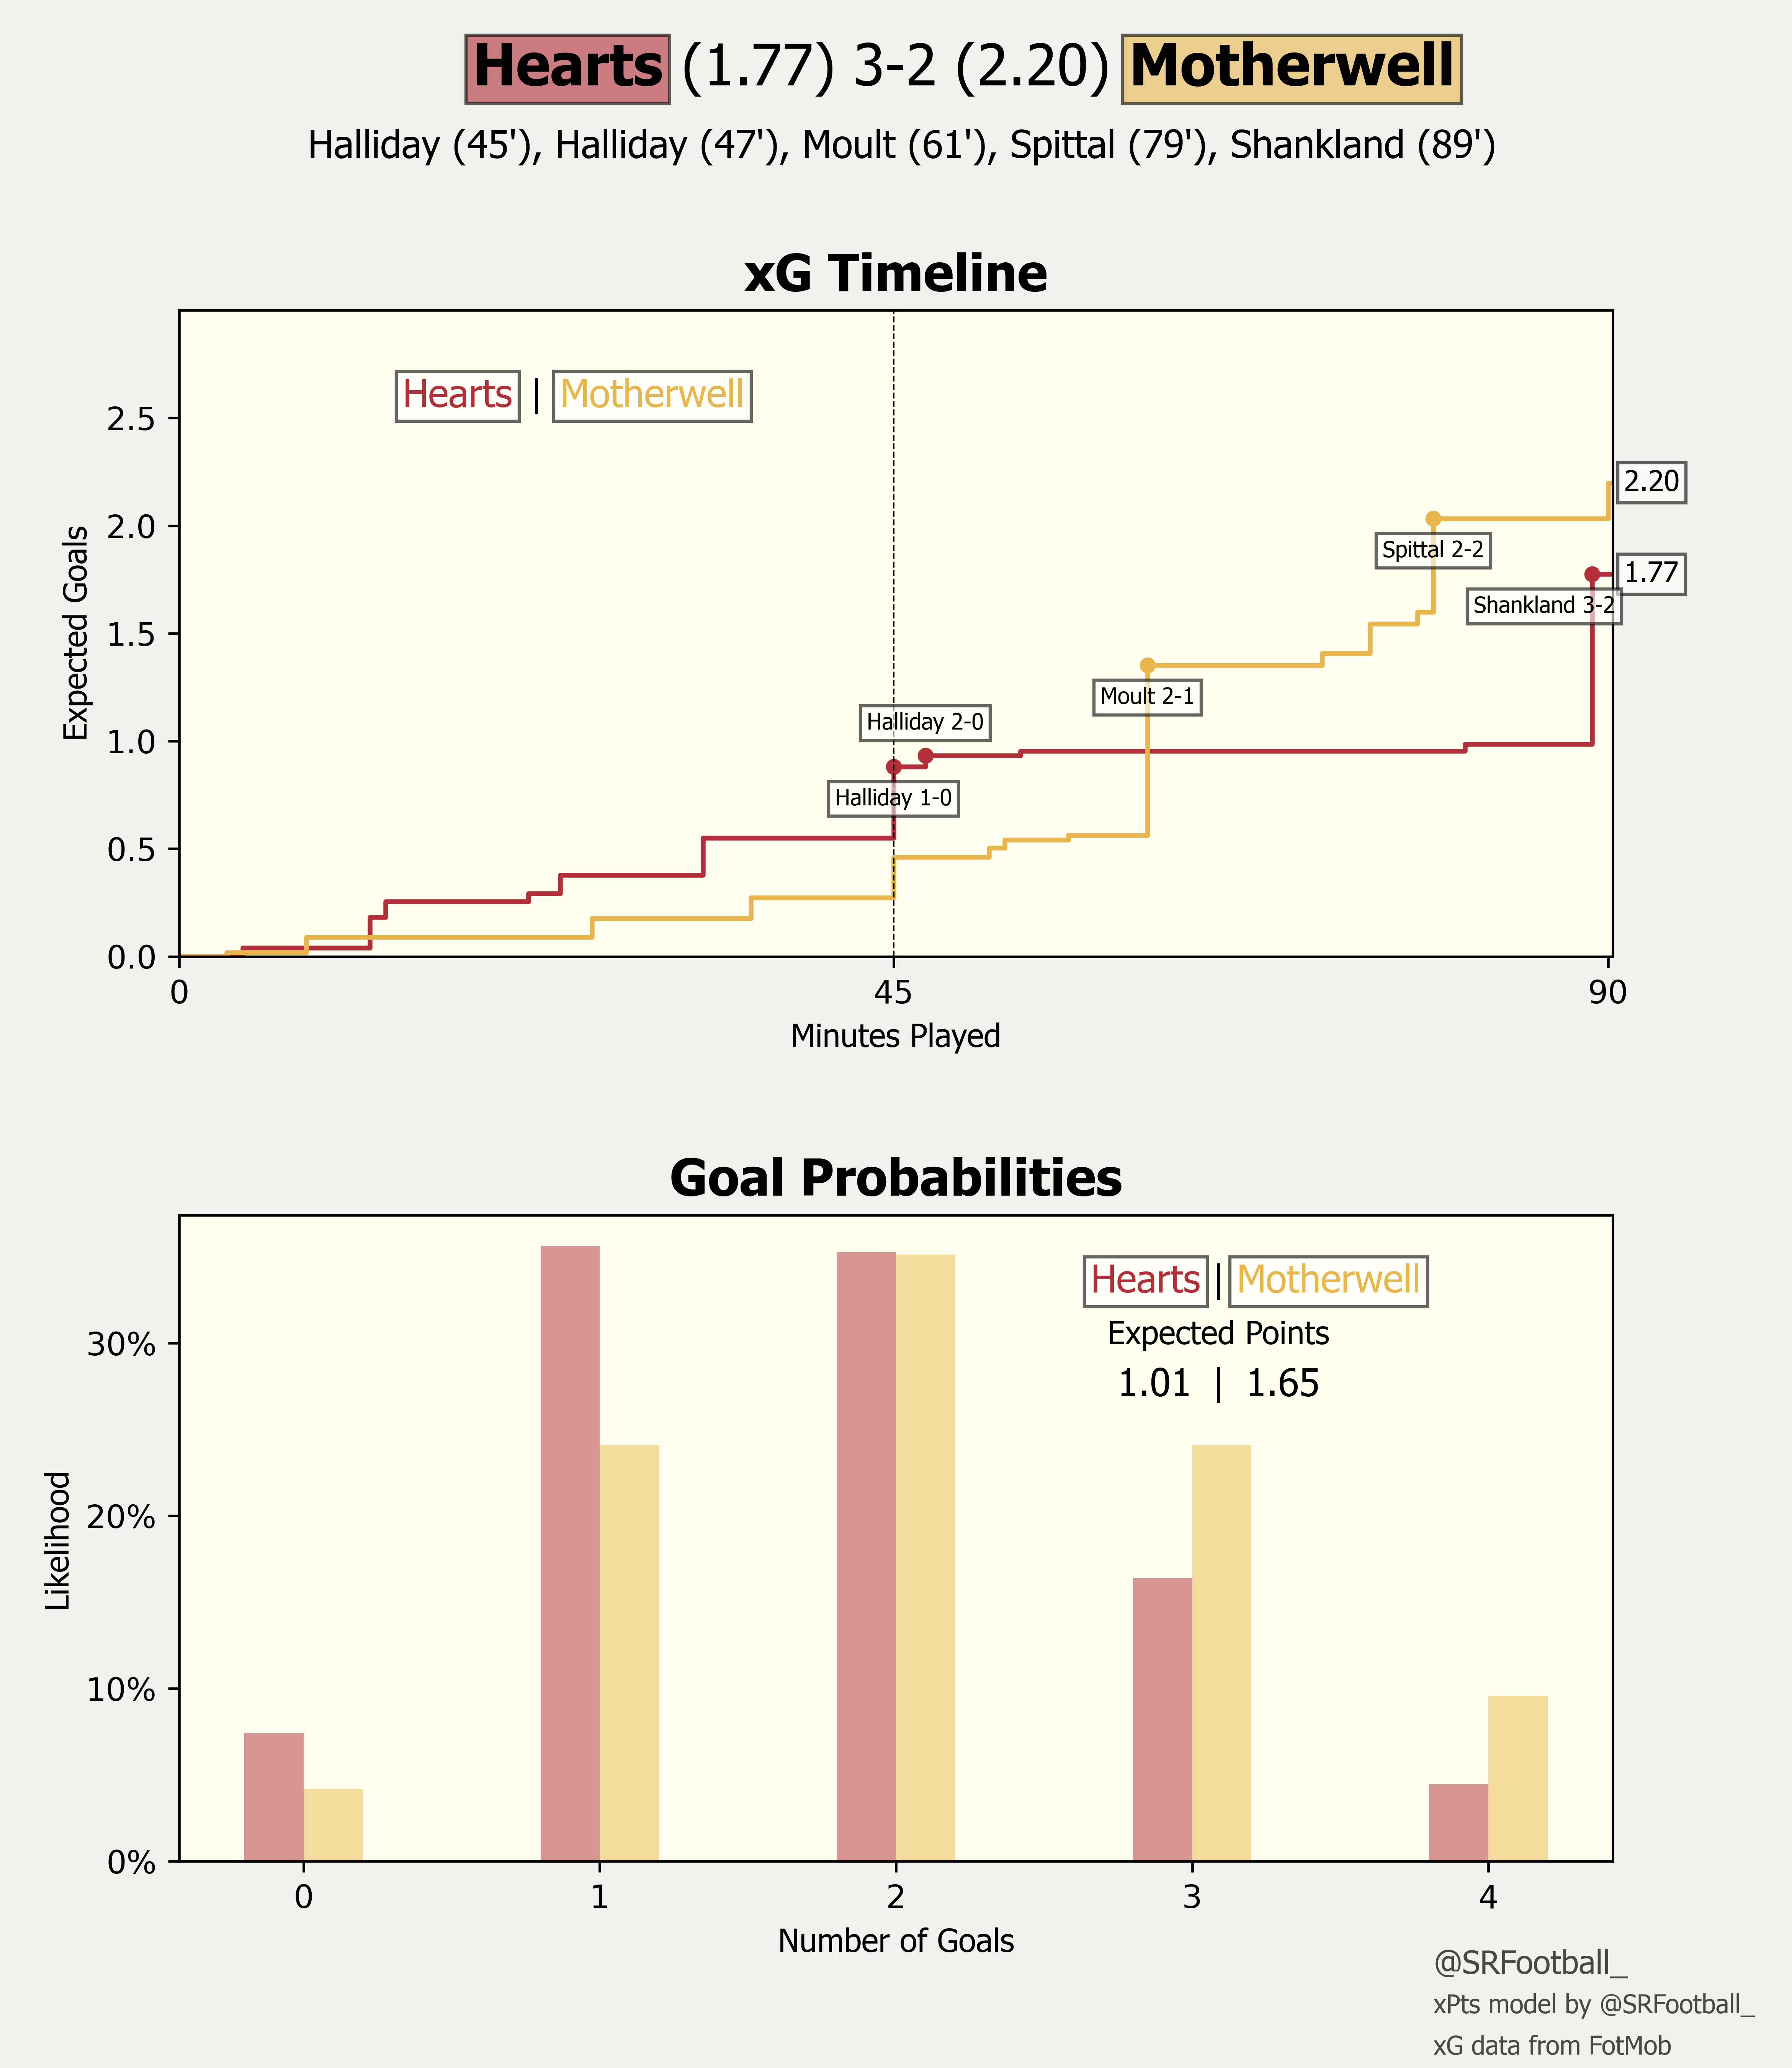
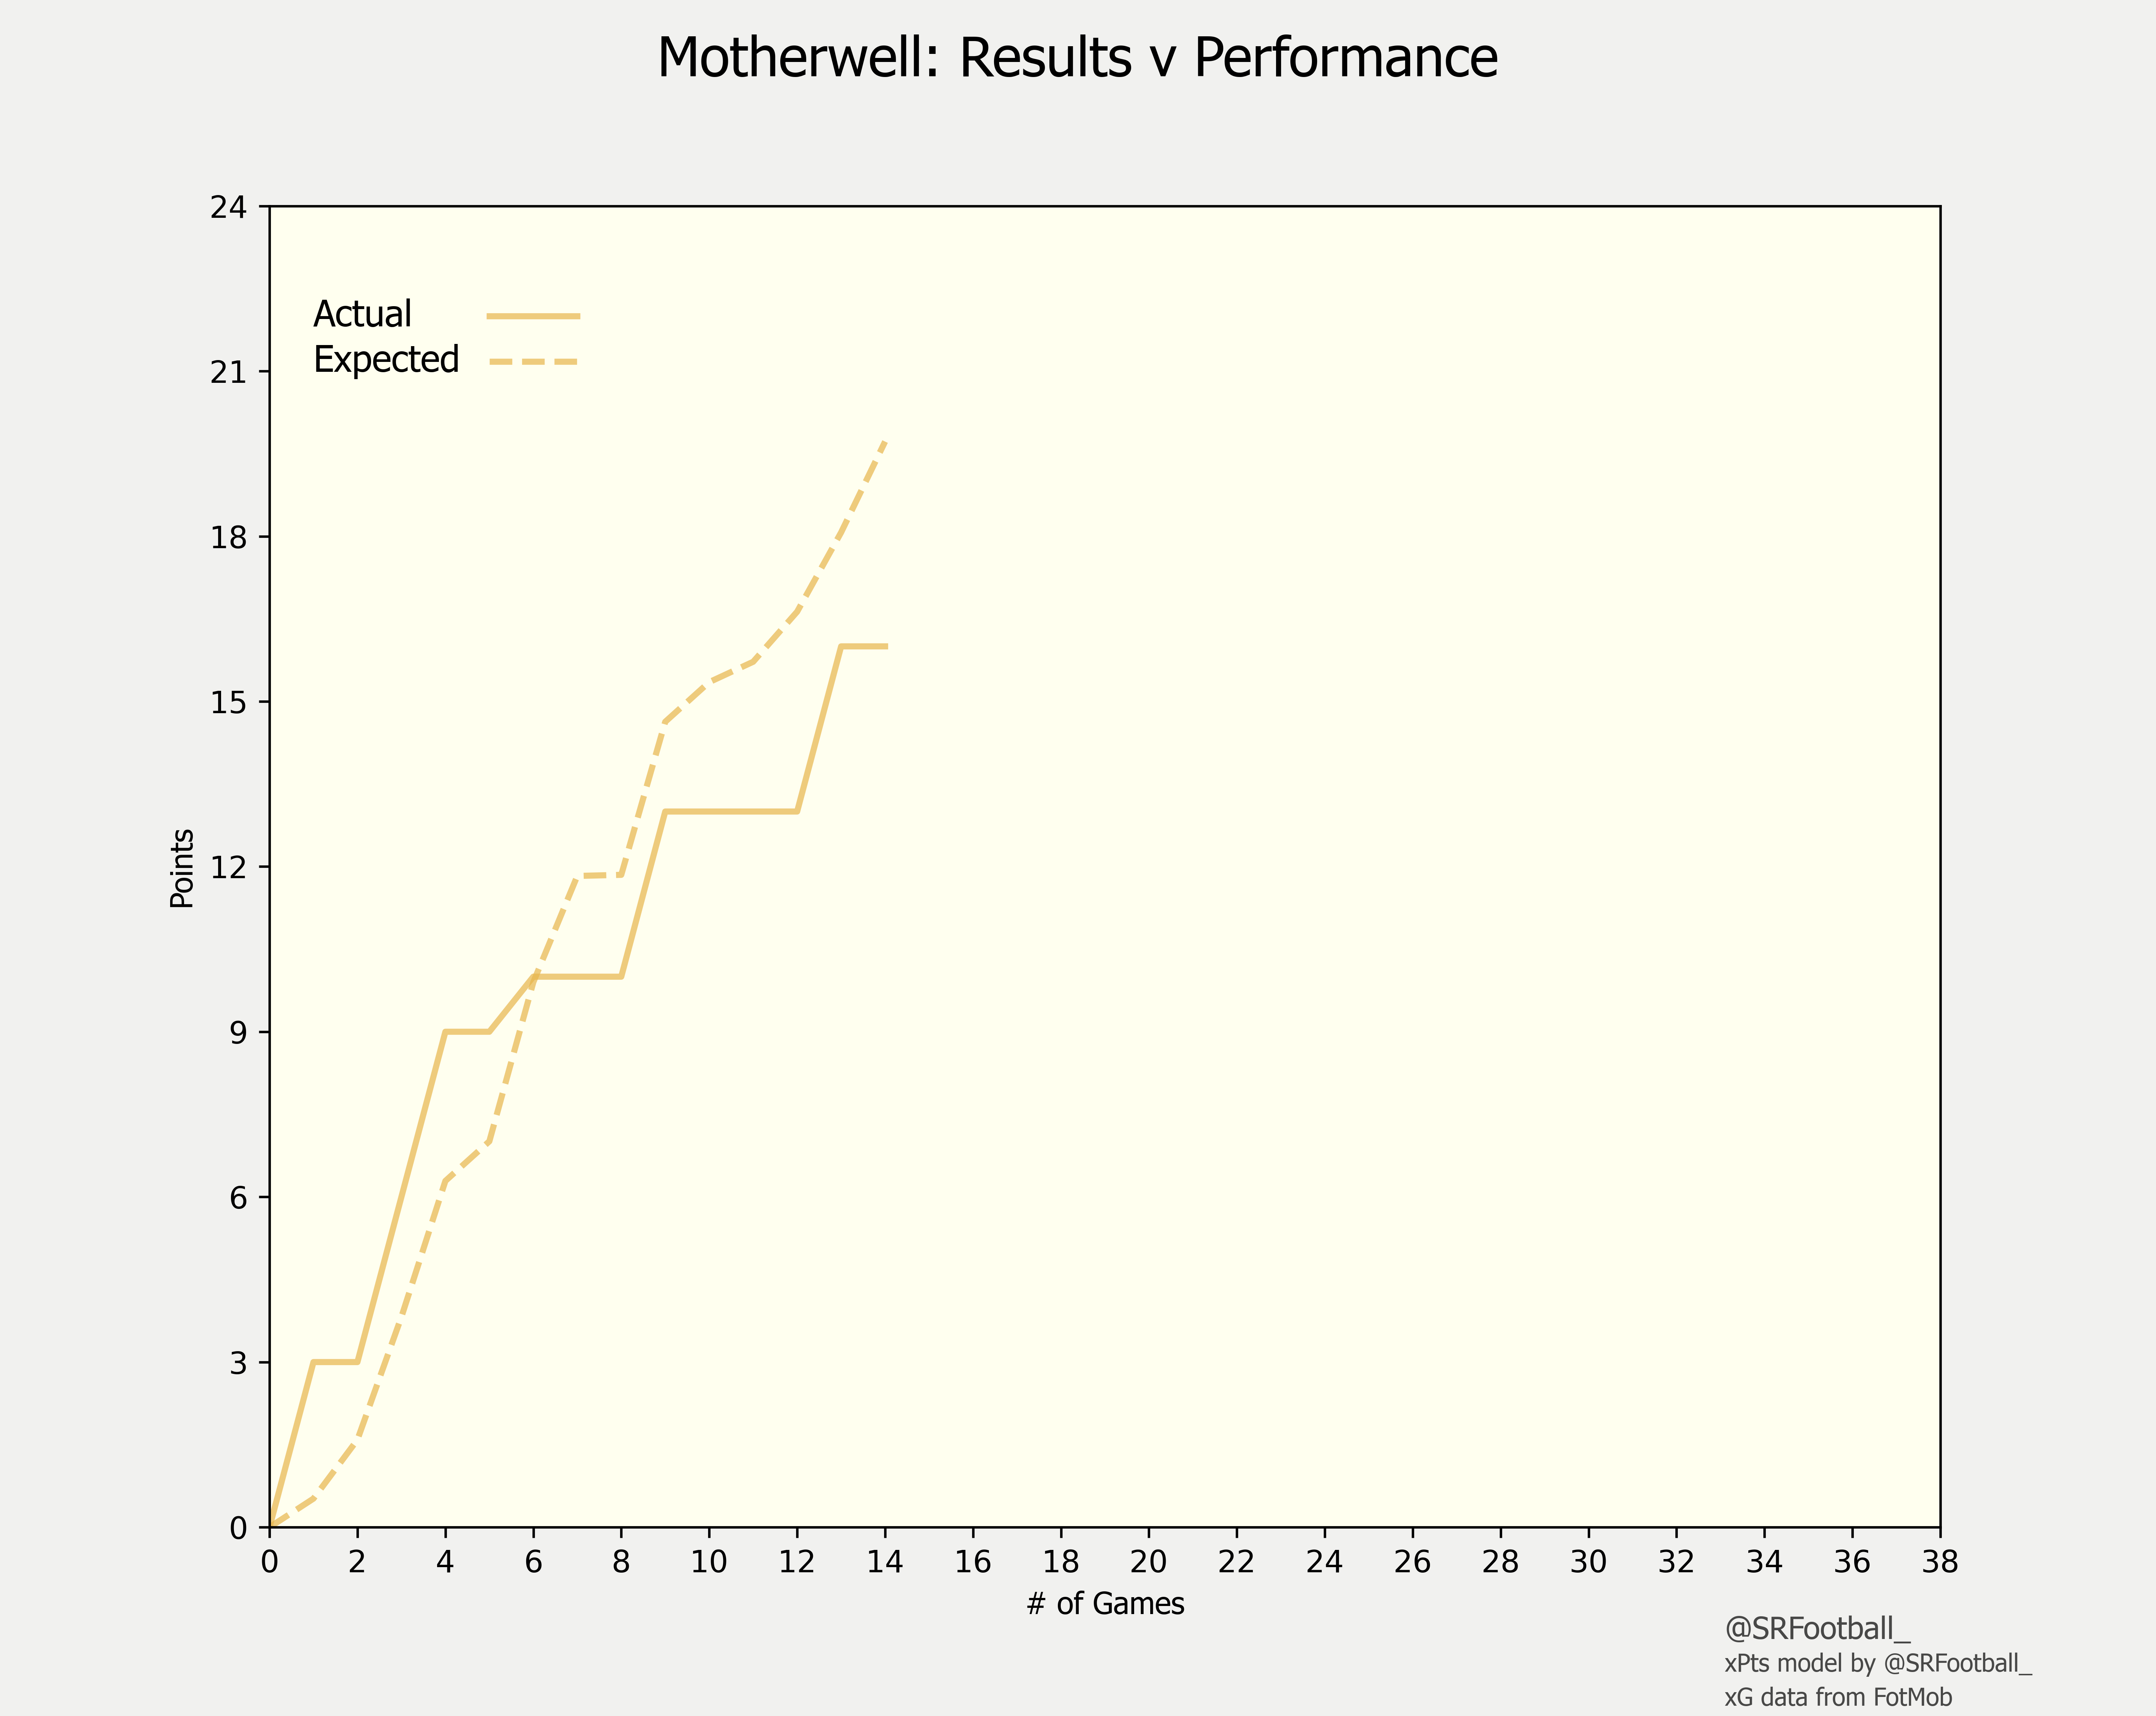
Hearts 3-2 Motherwell
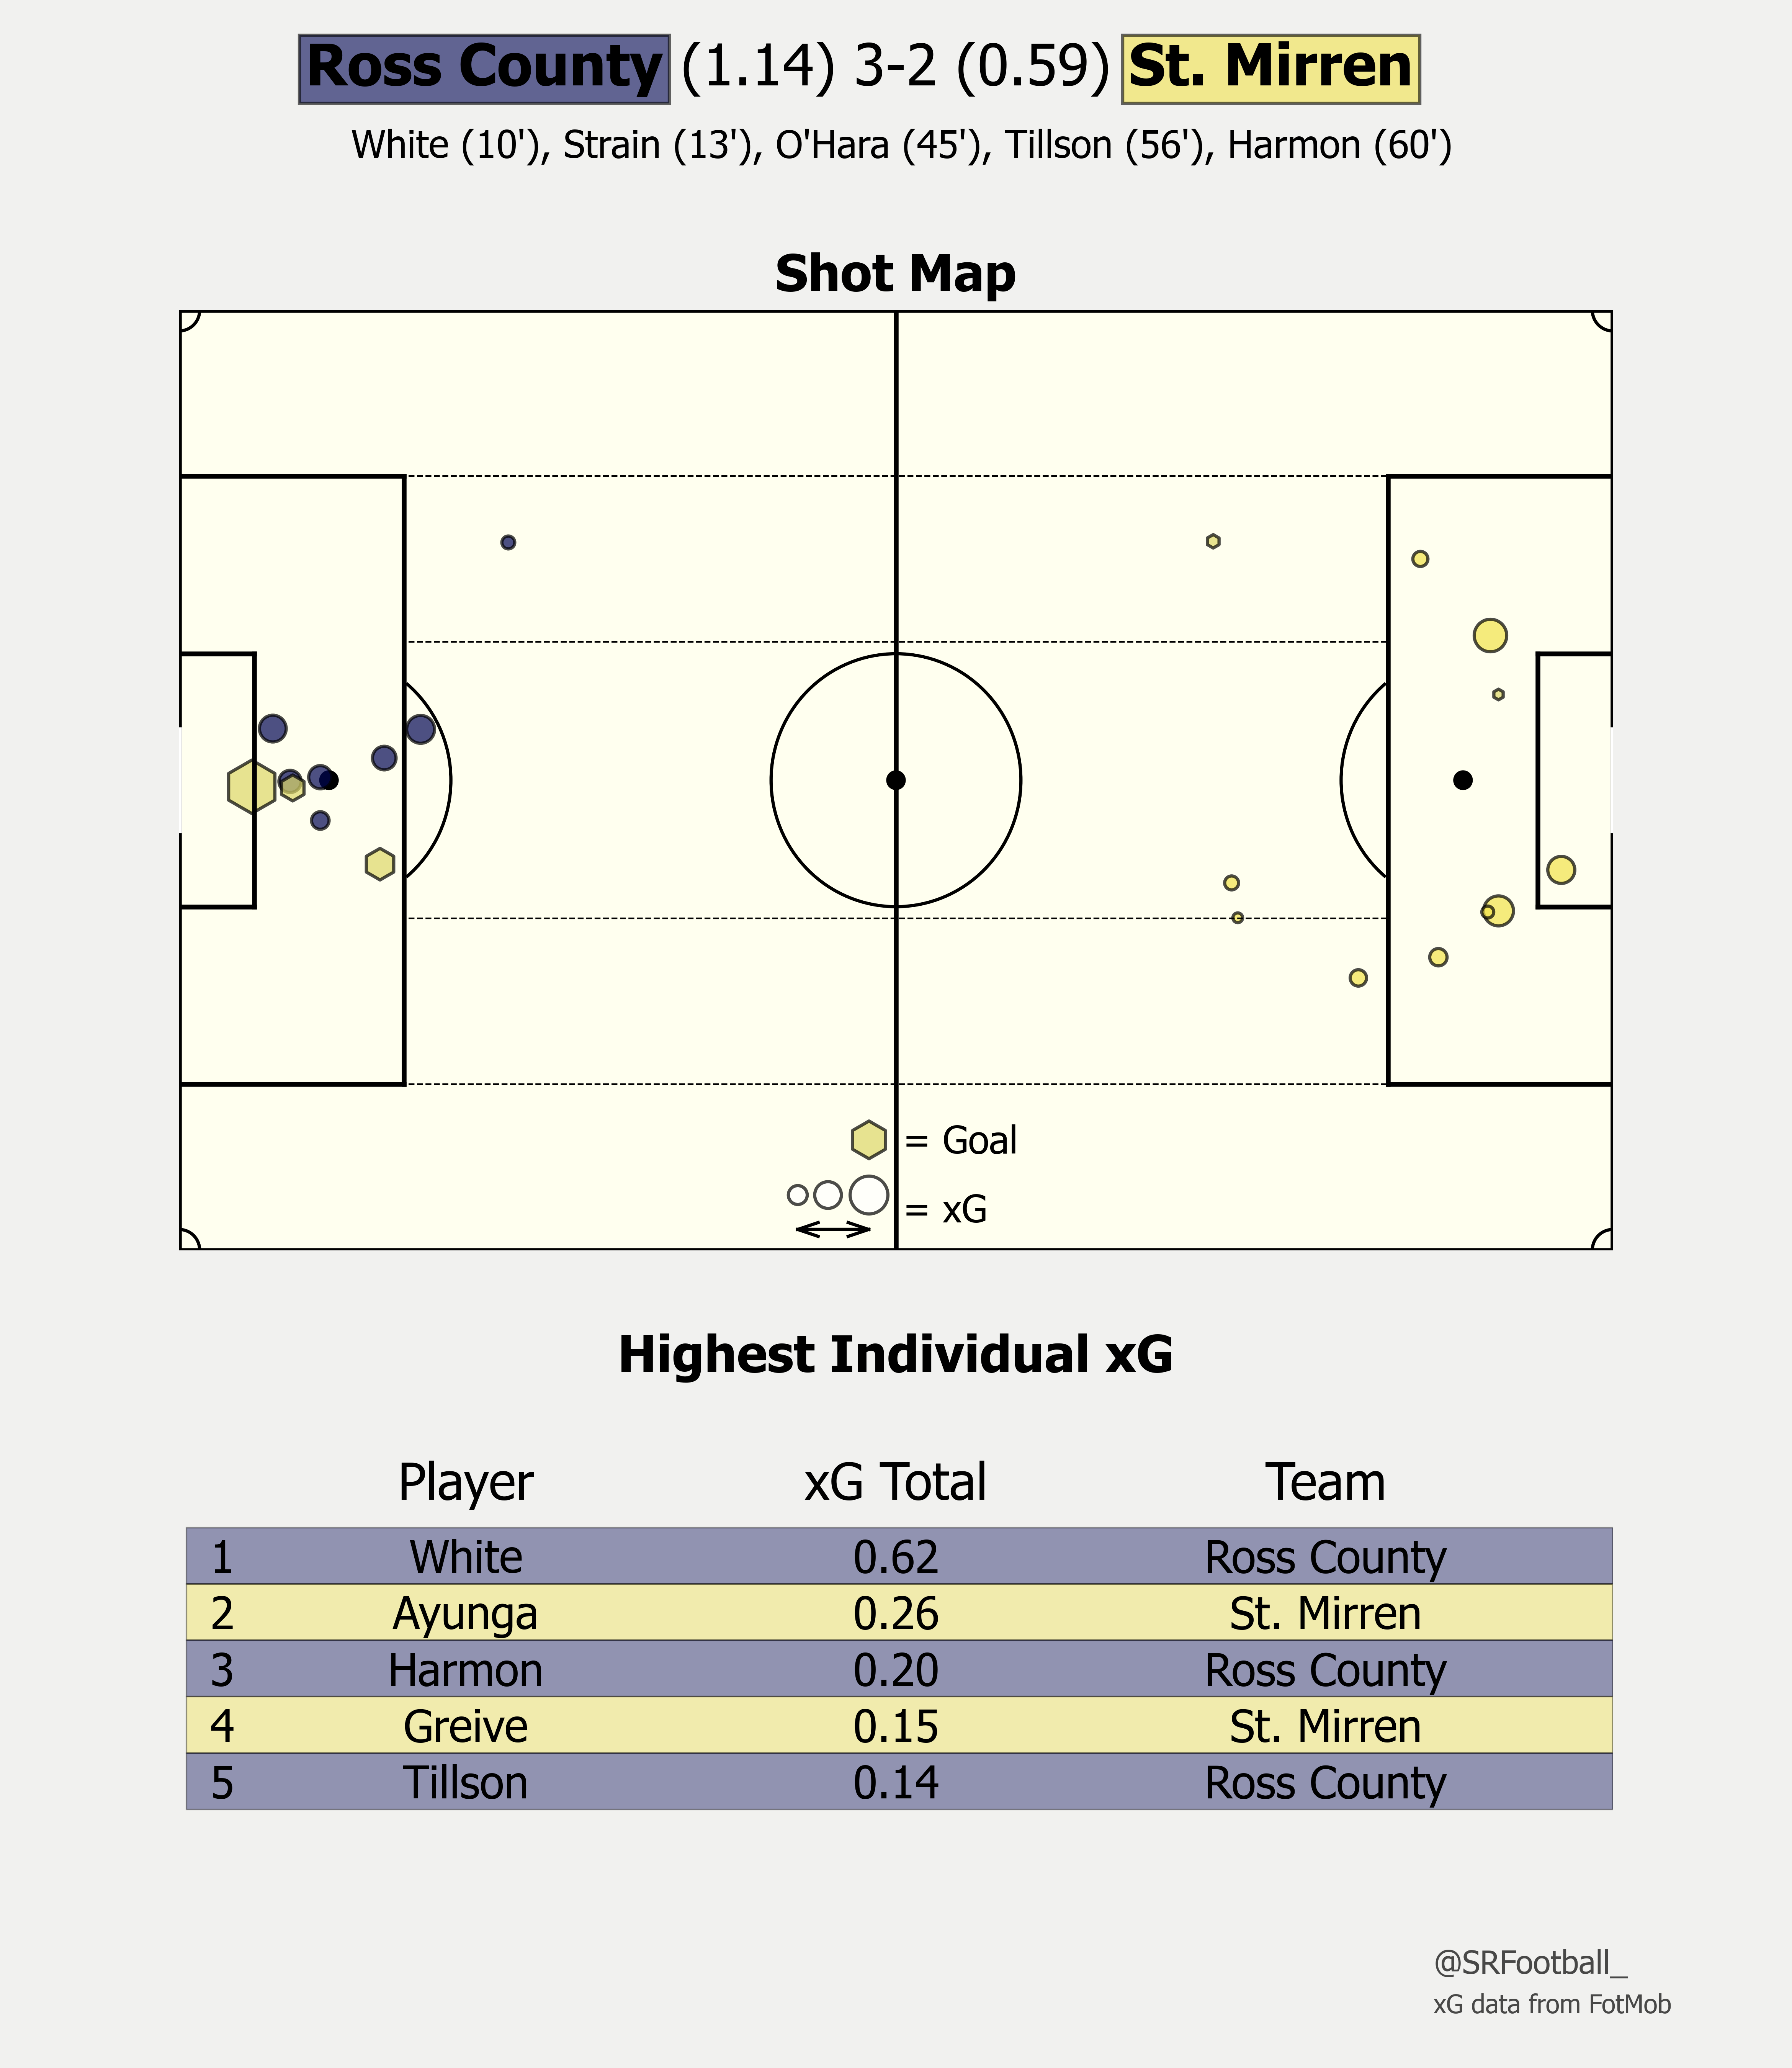
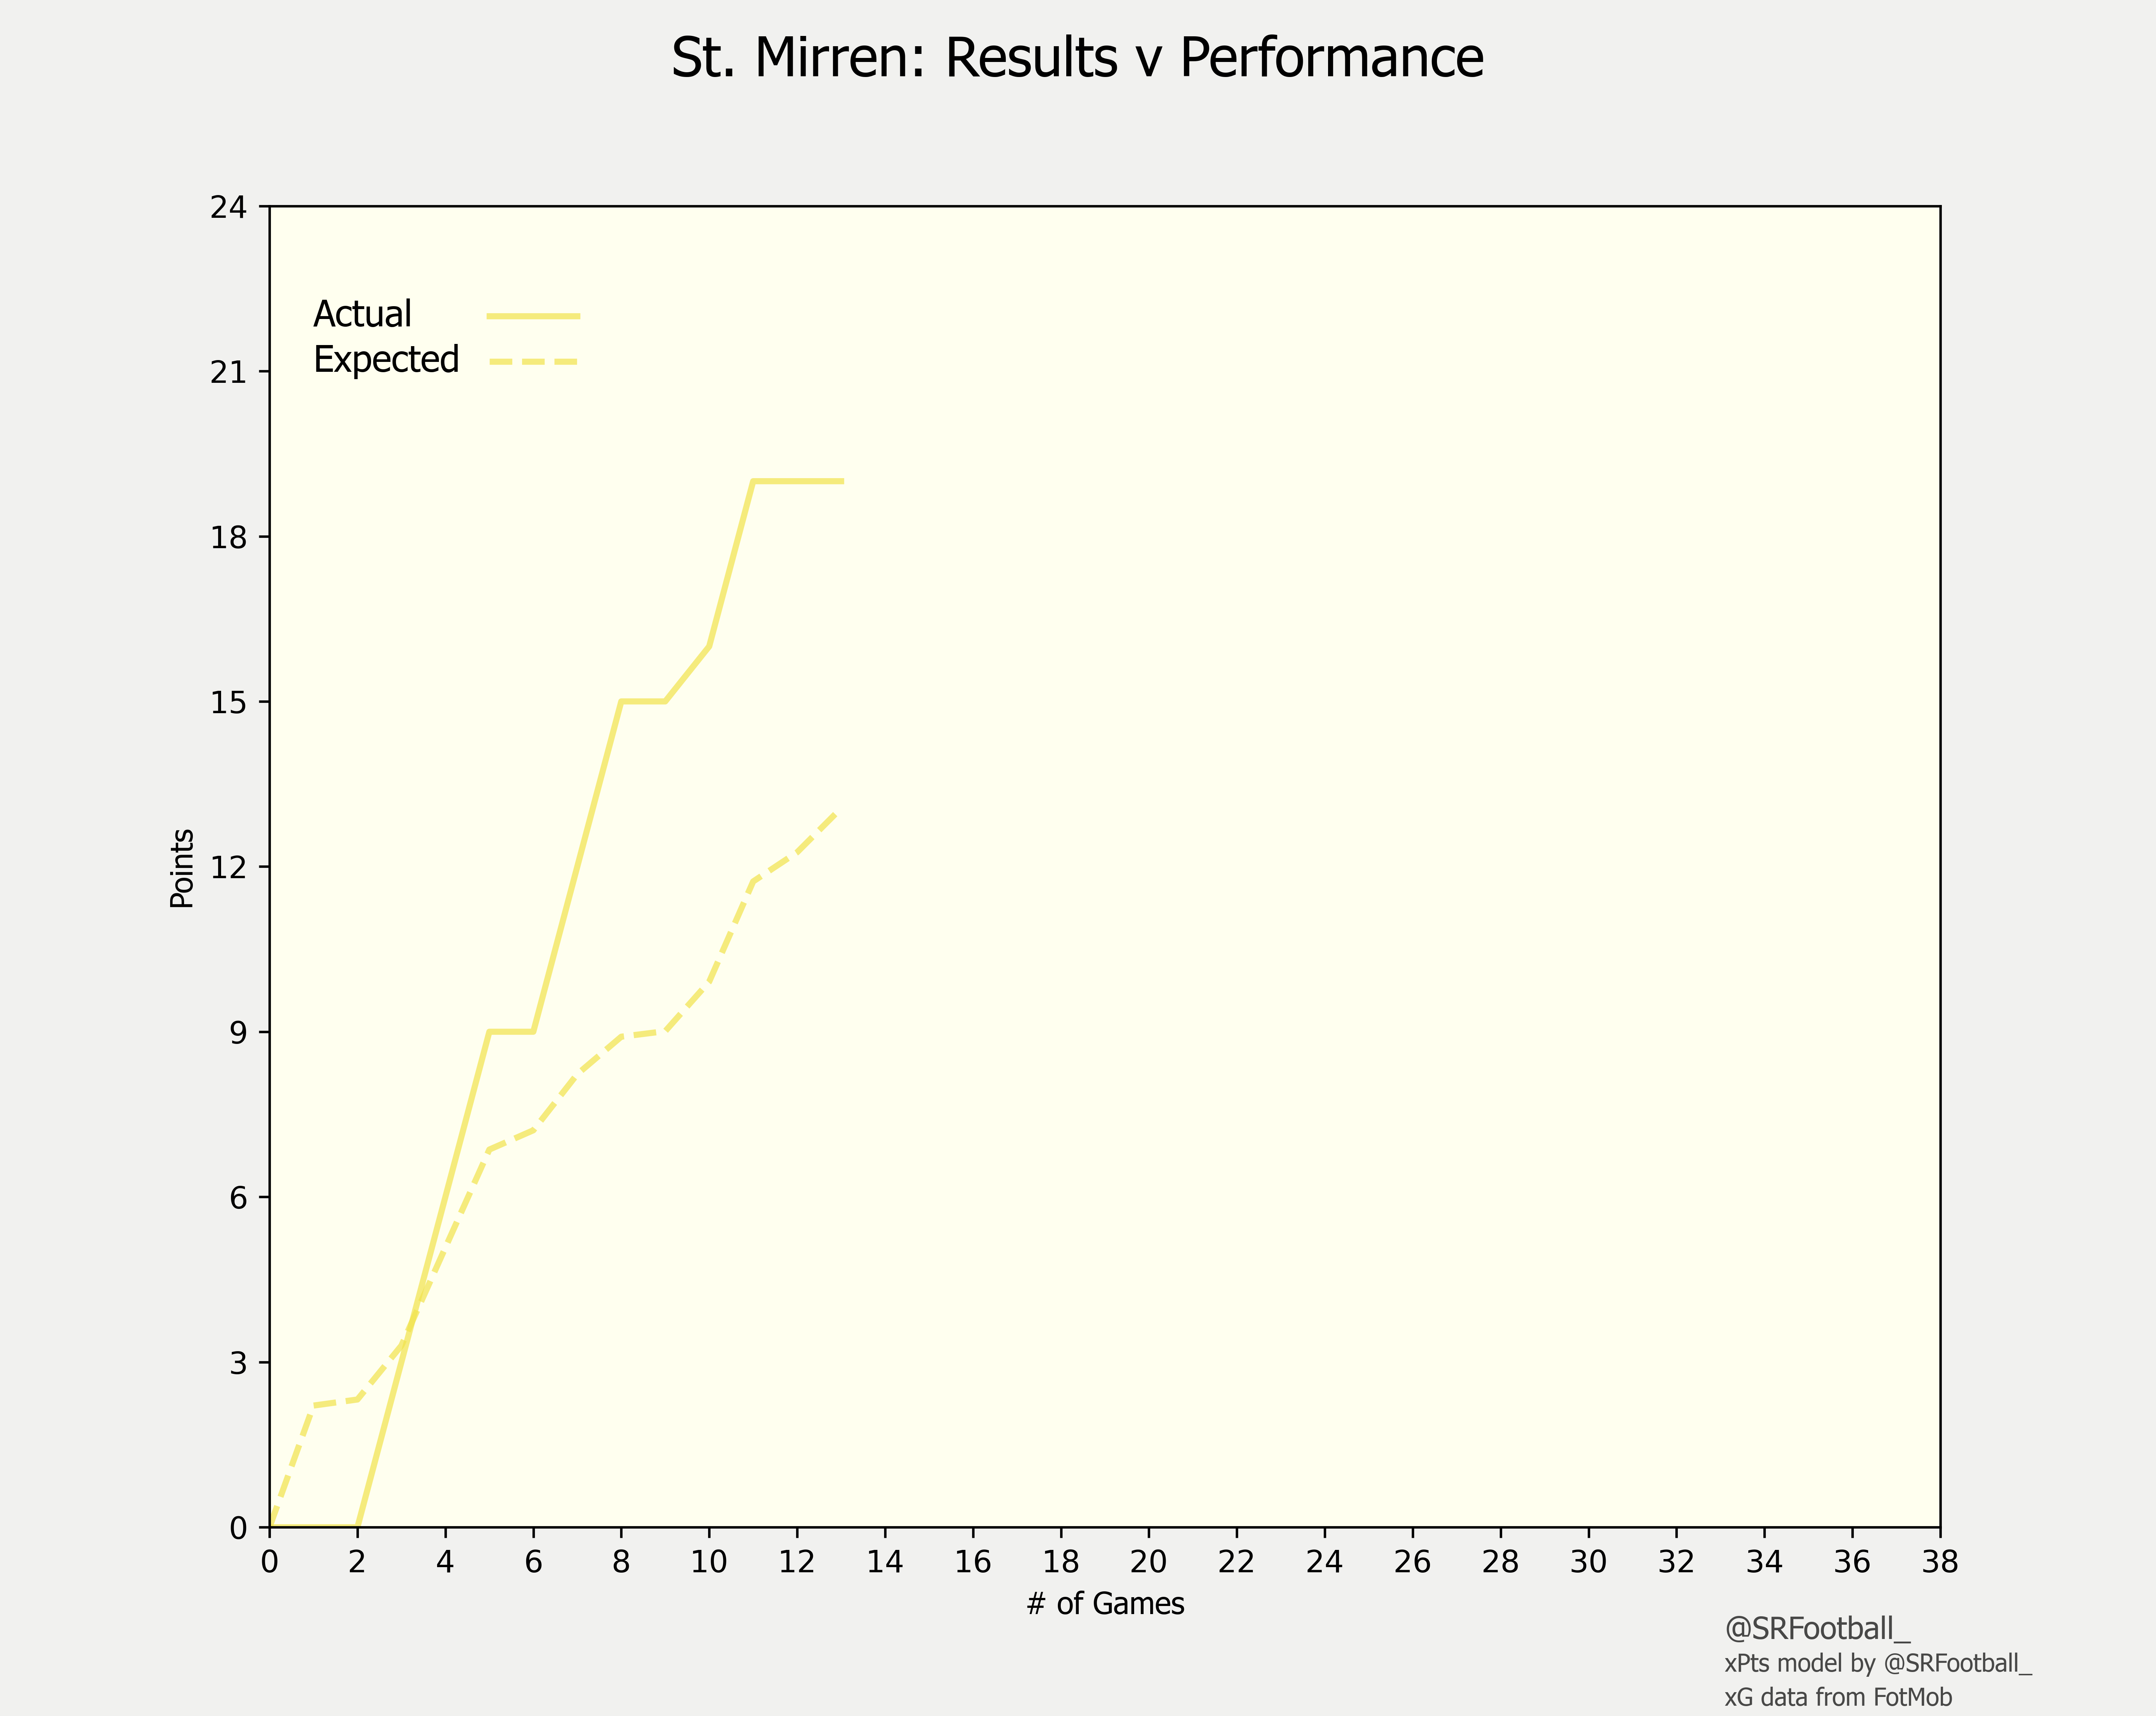
Ross County 3-2 St. Mirren
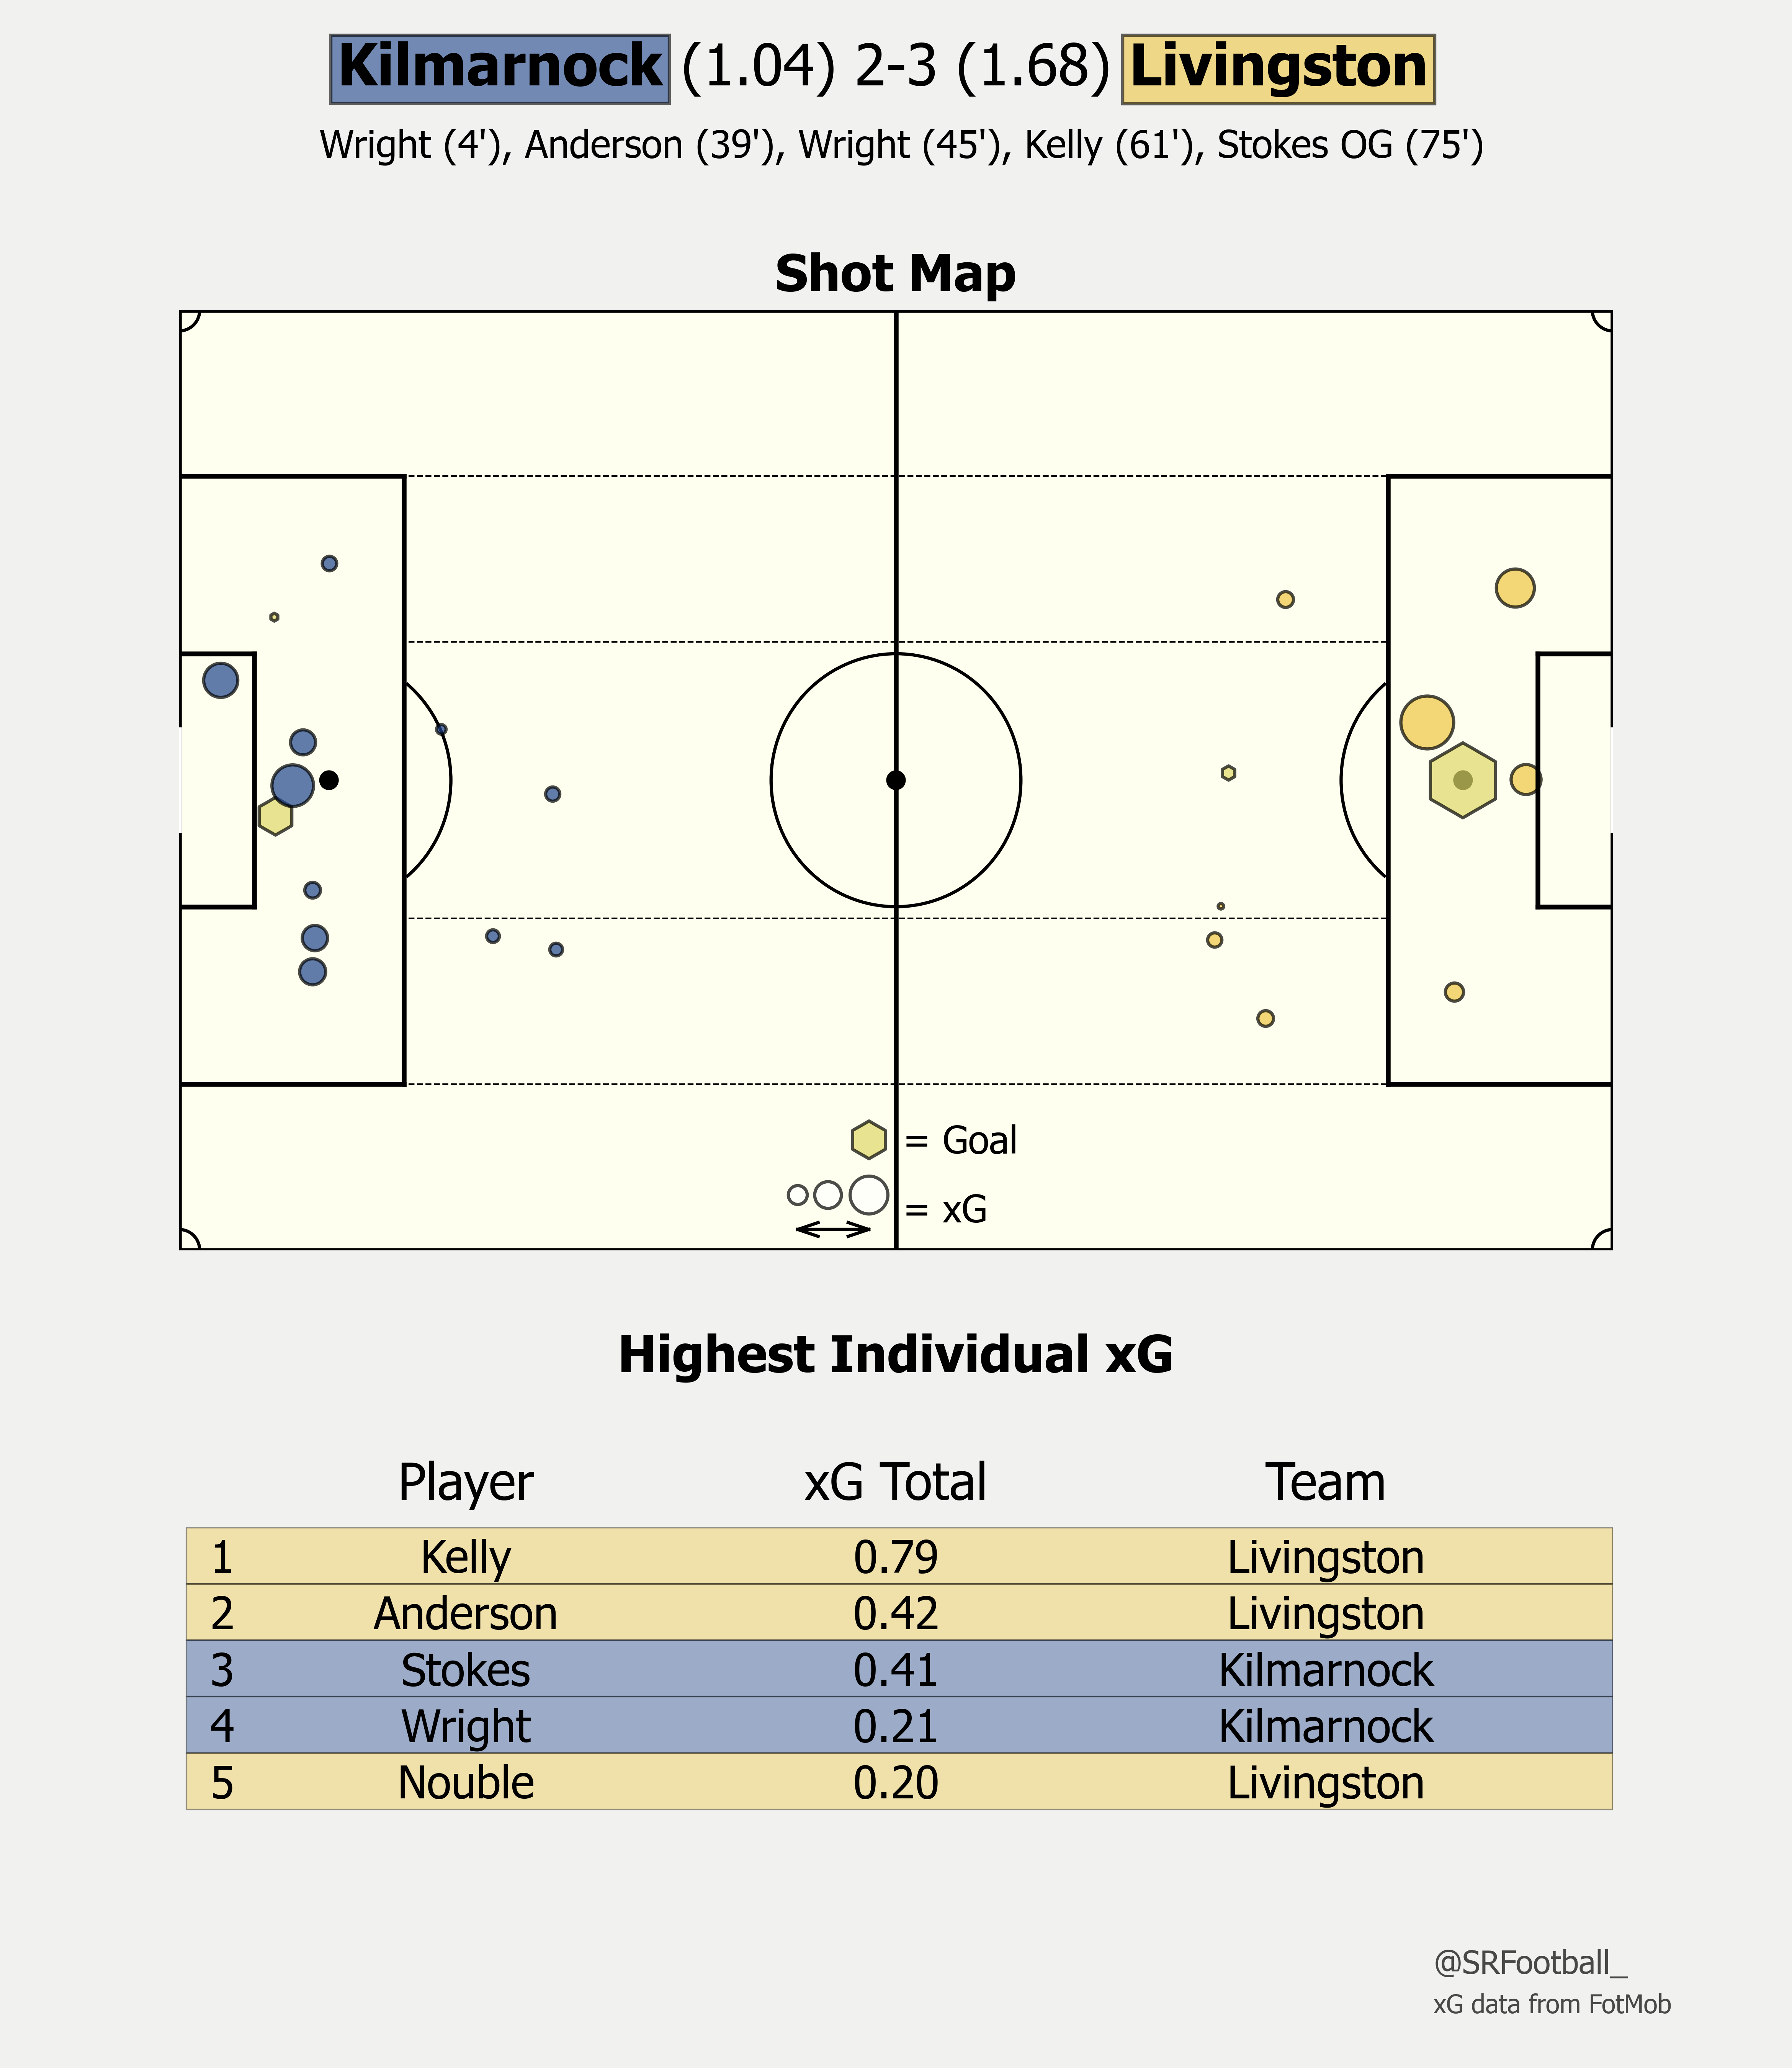
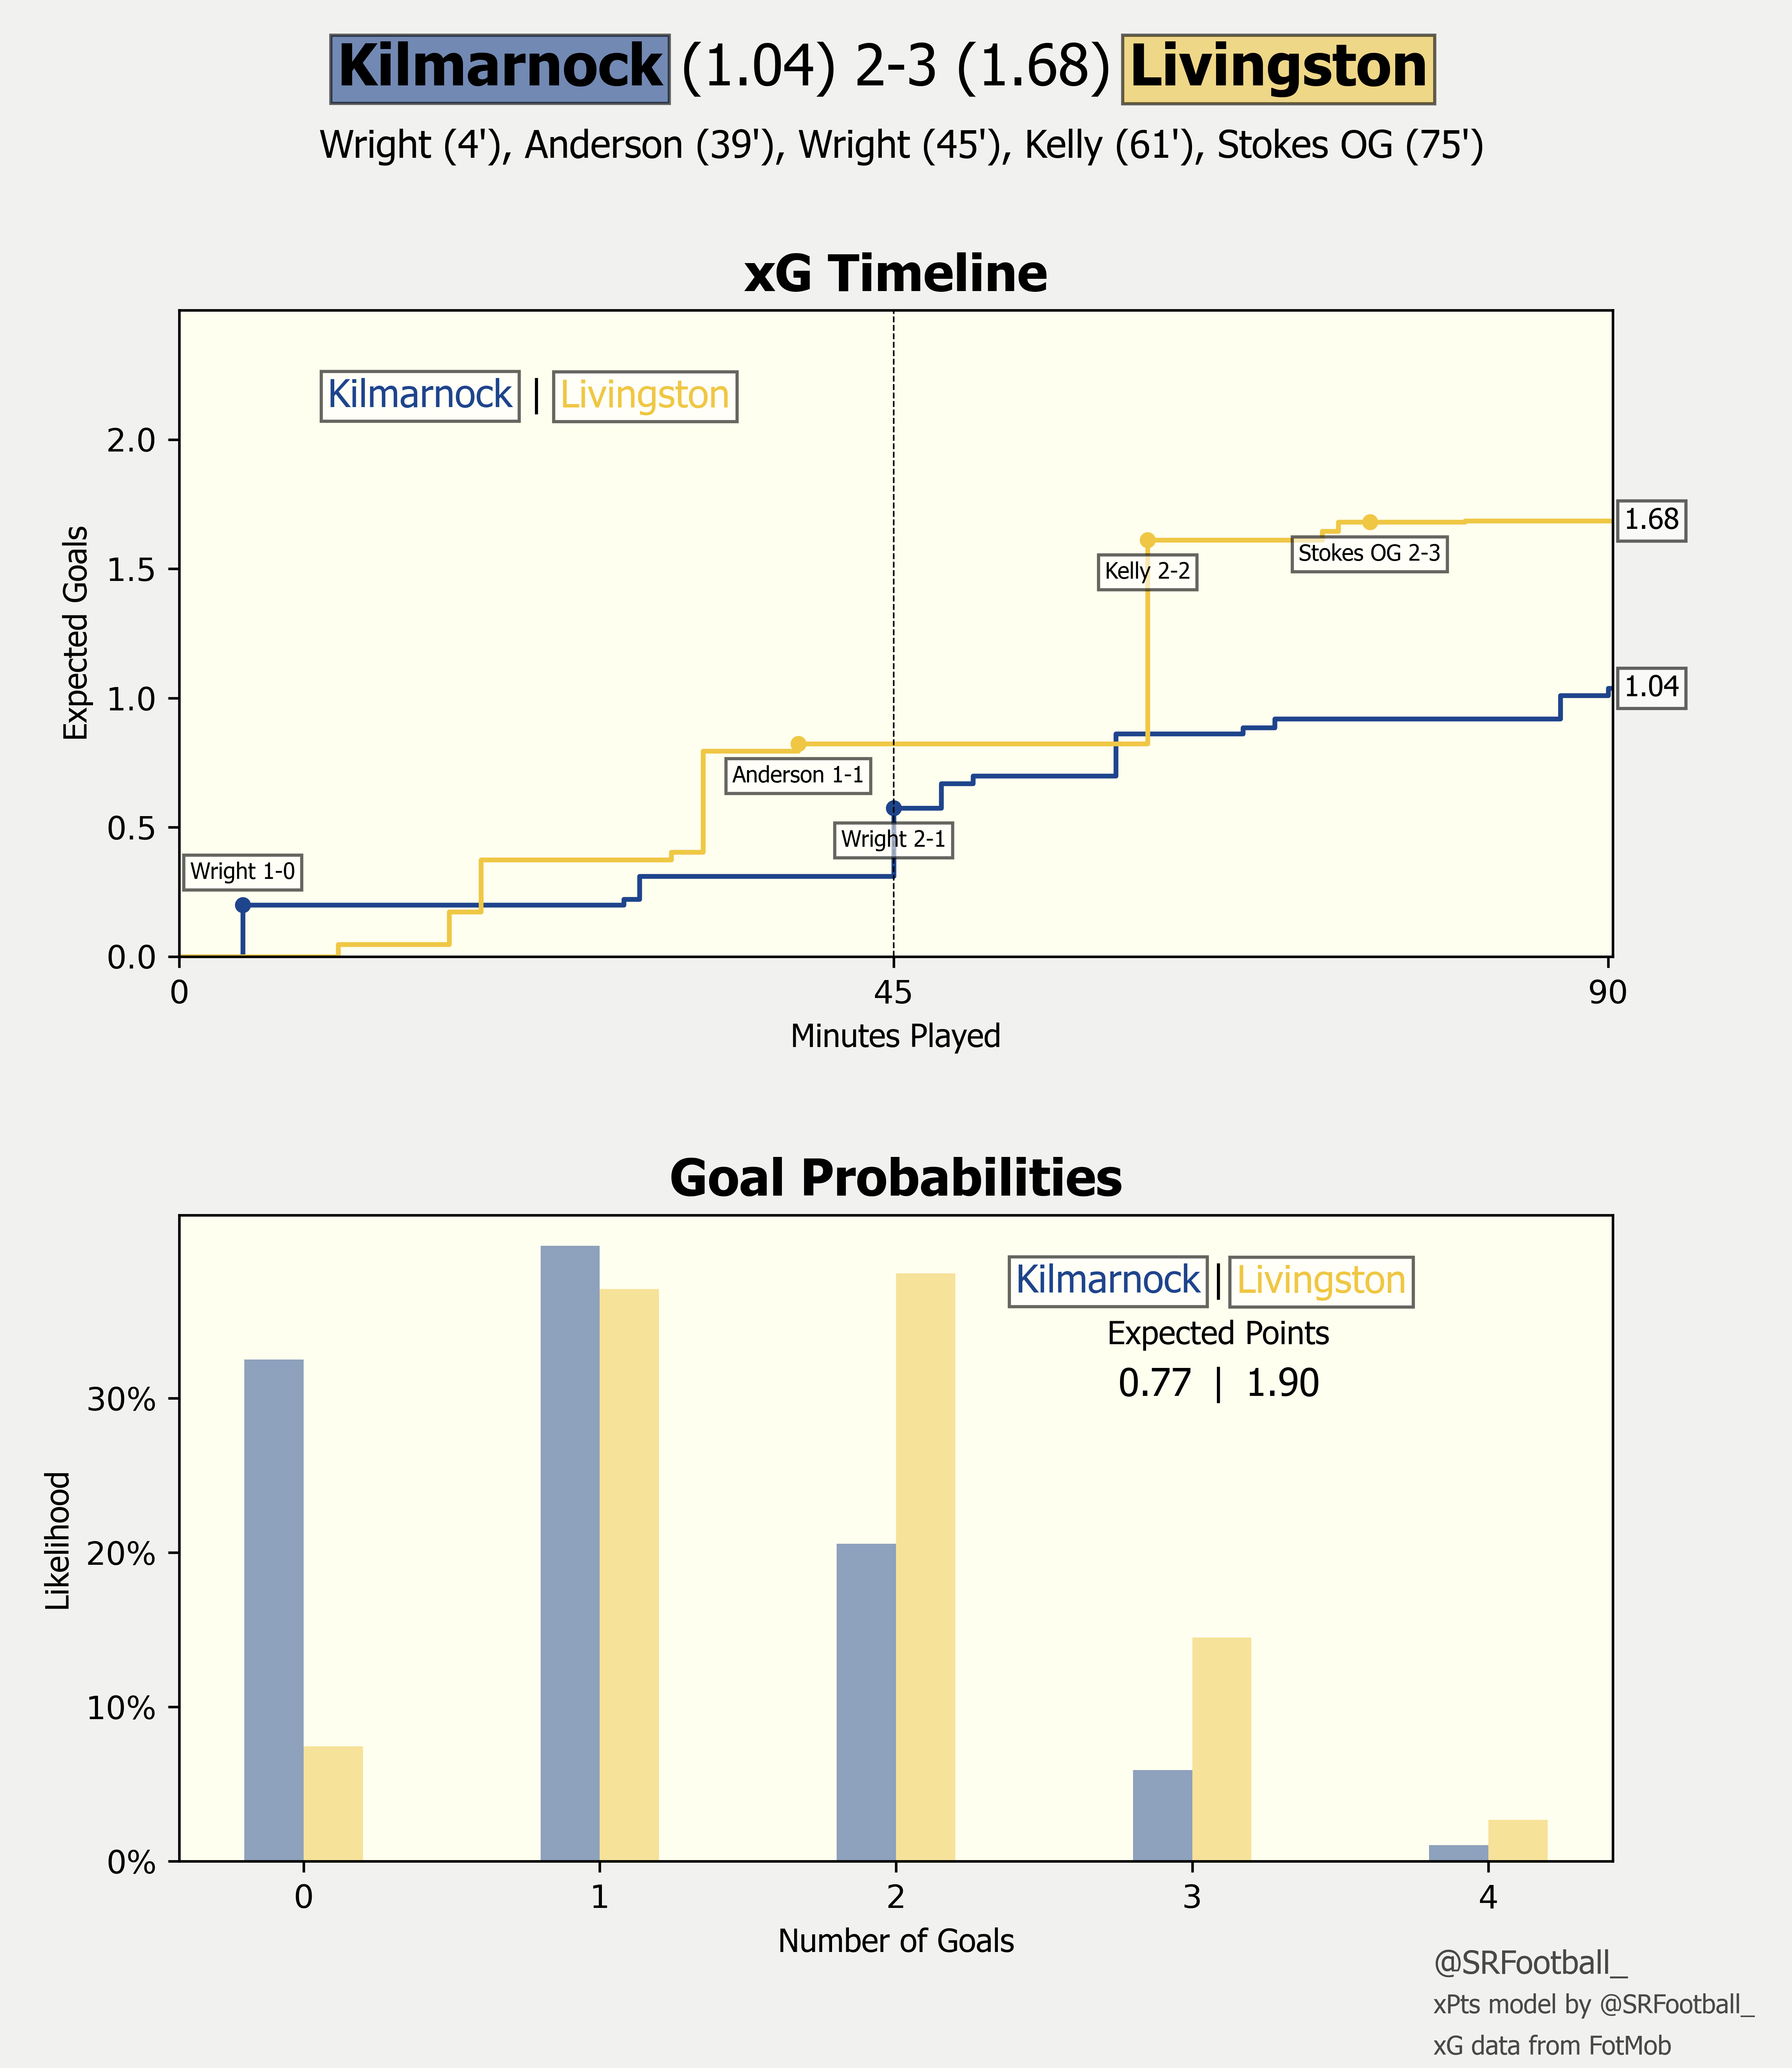
Kilmarnock 2-3 Livingston
League Update
Celtic 4-2 Dundee United
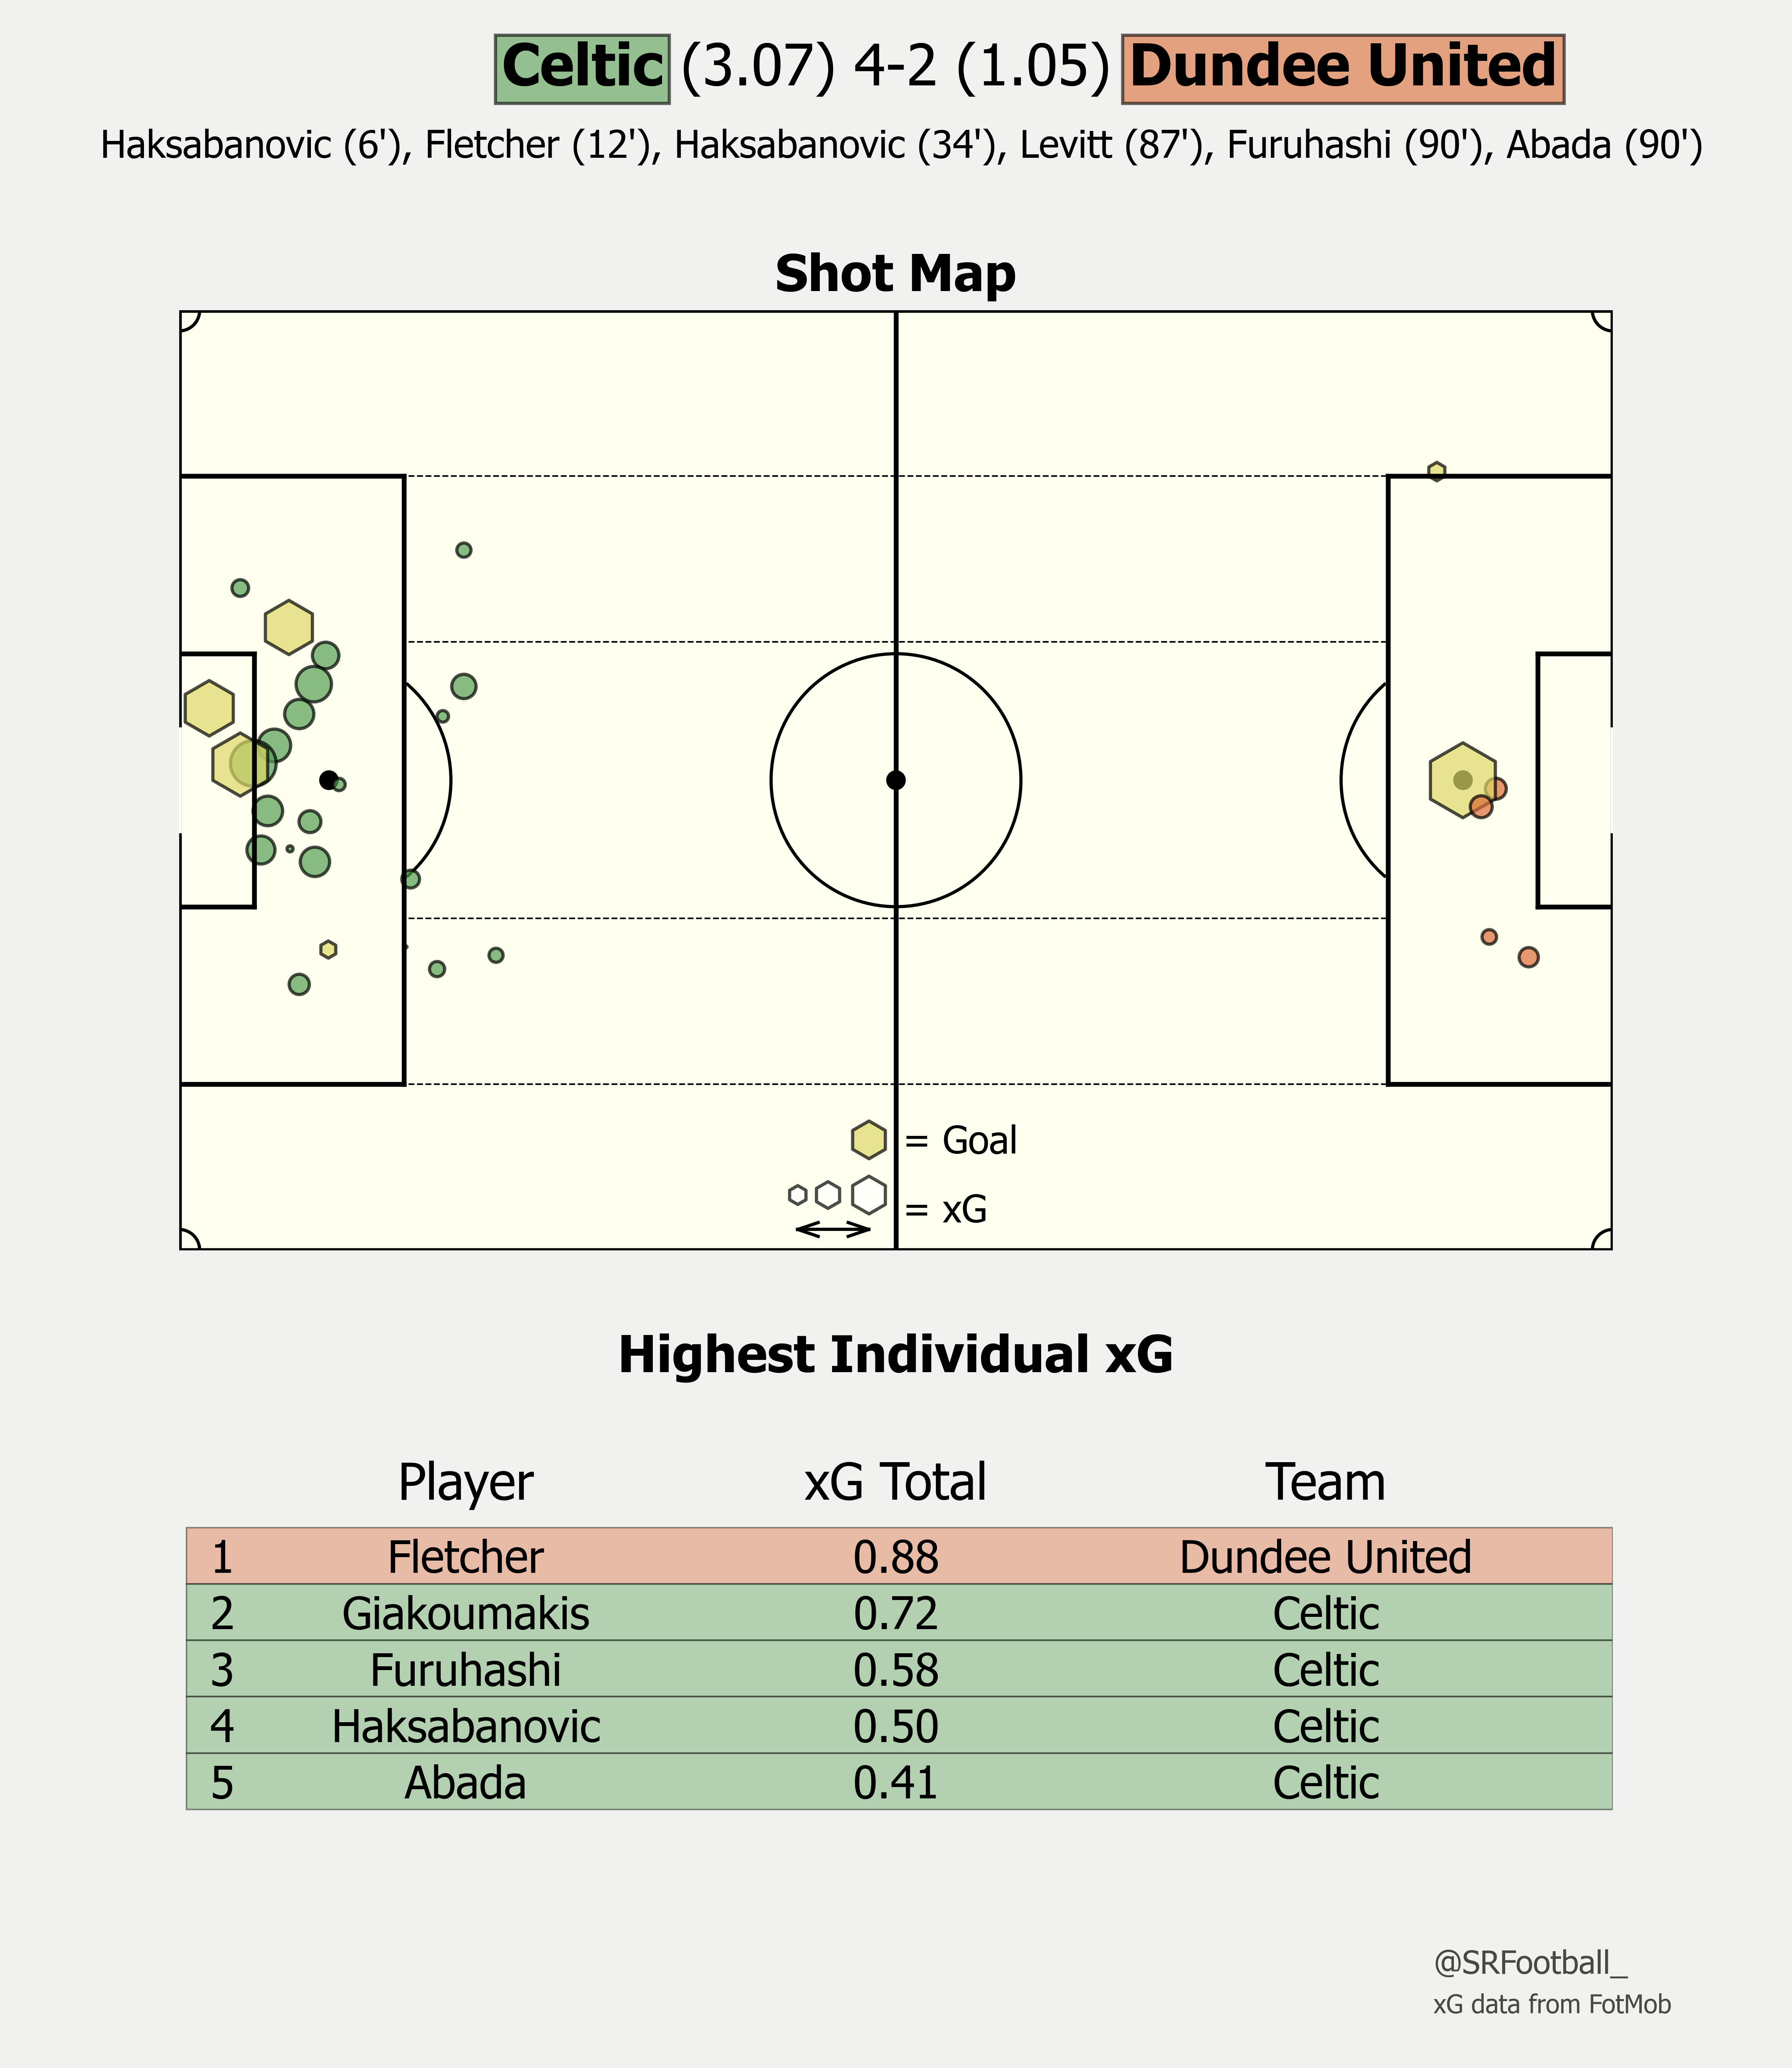
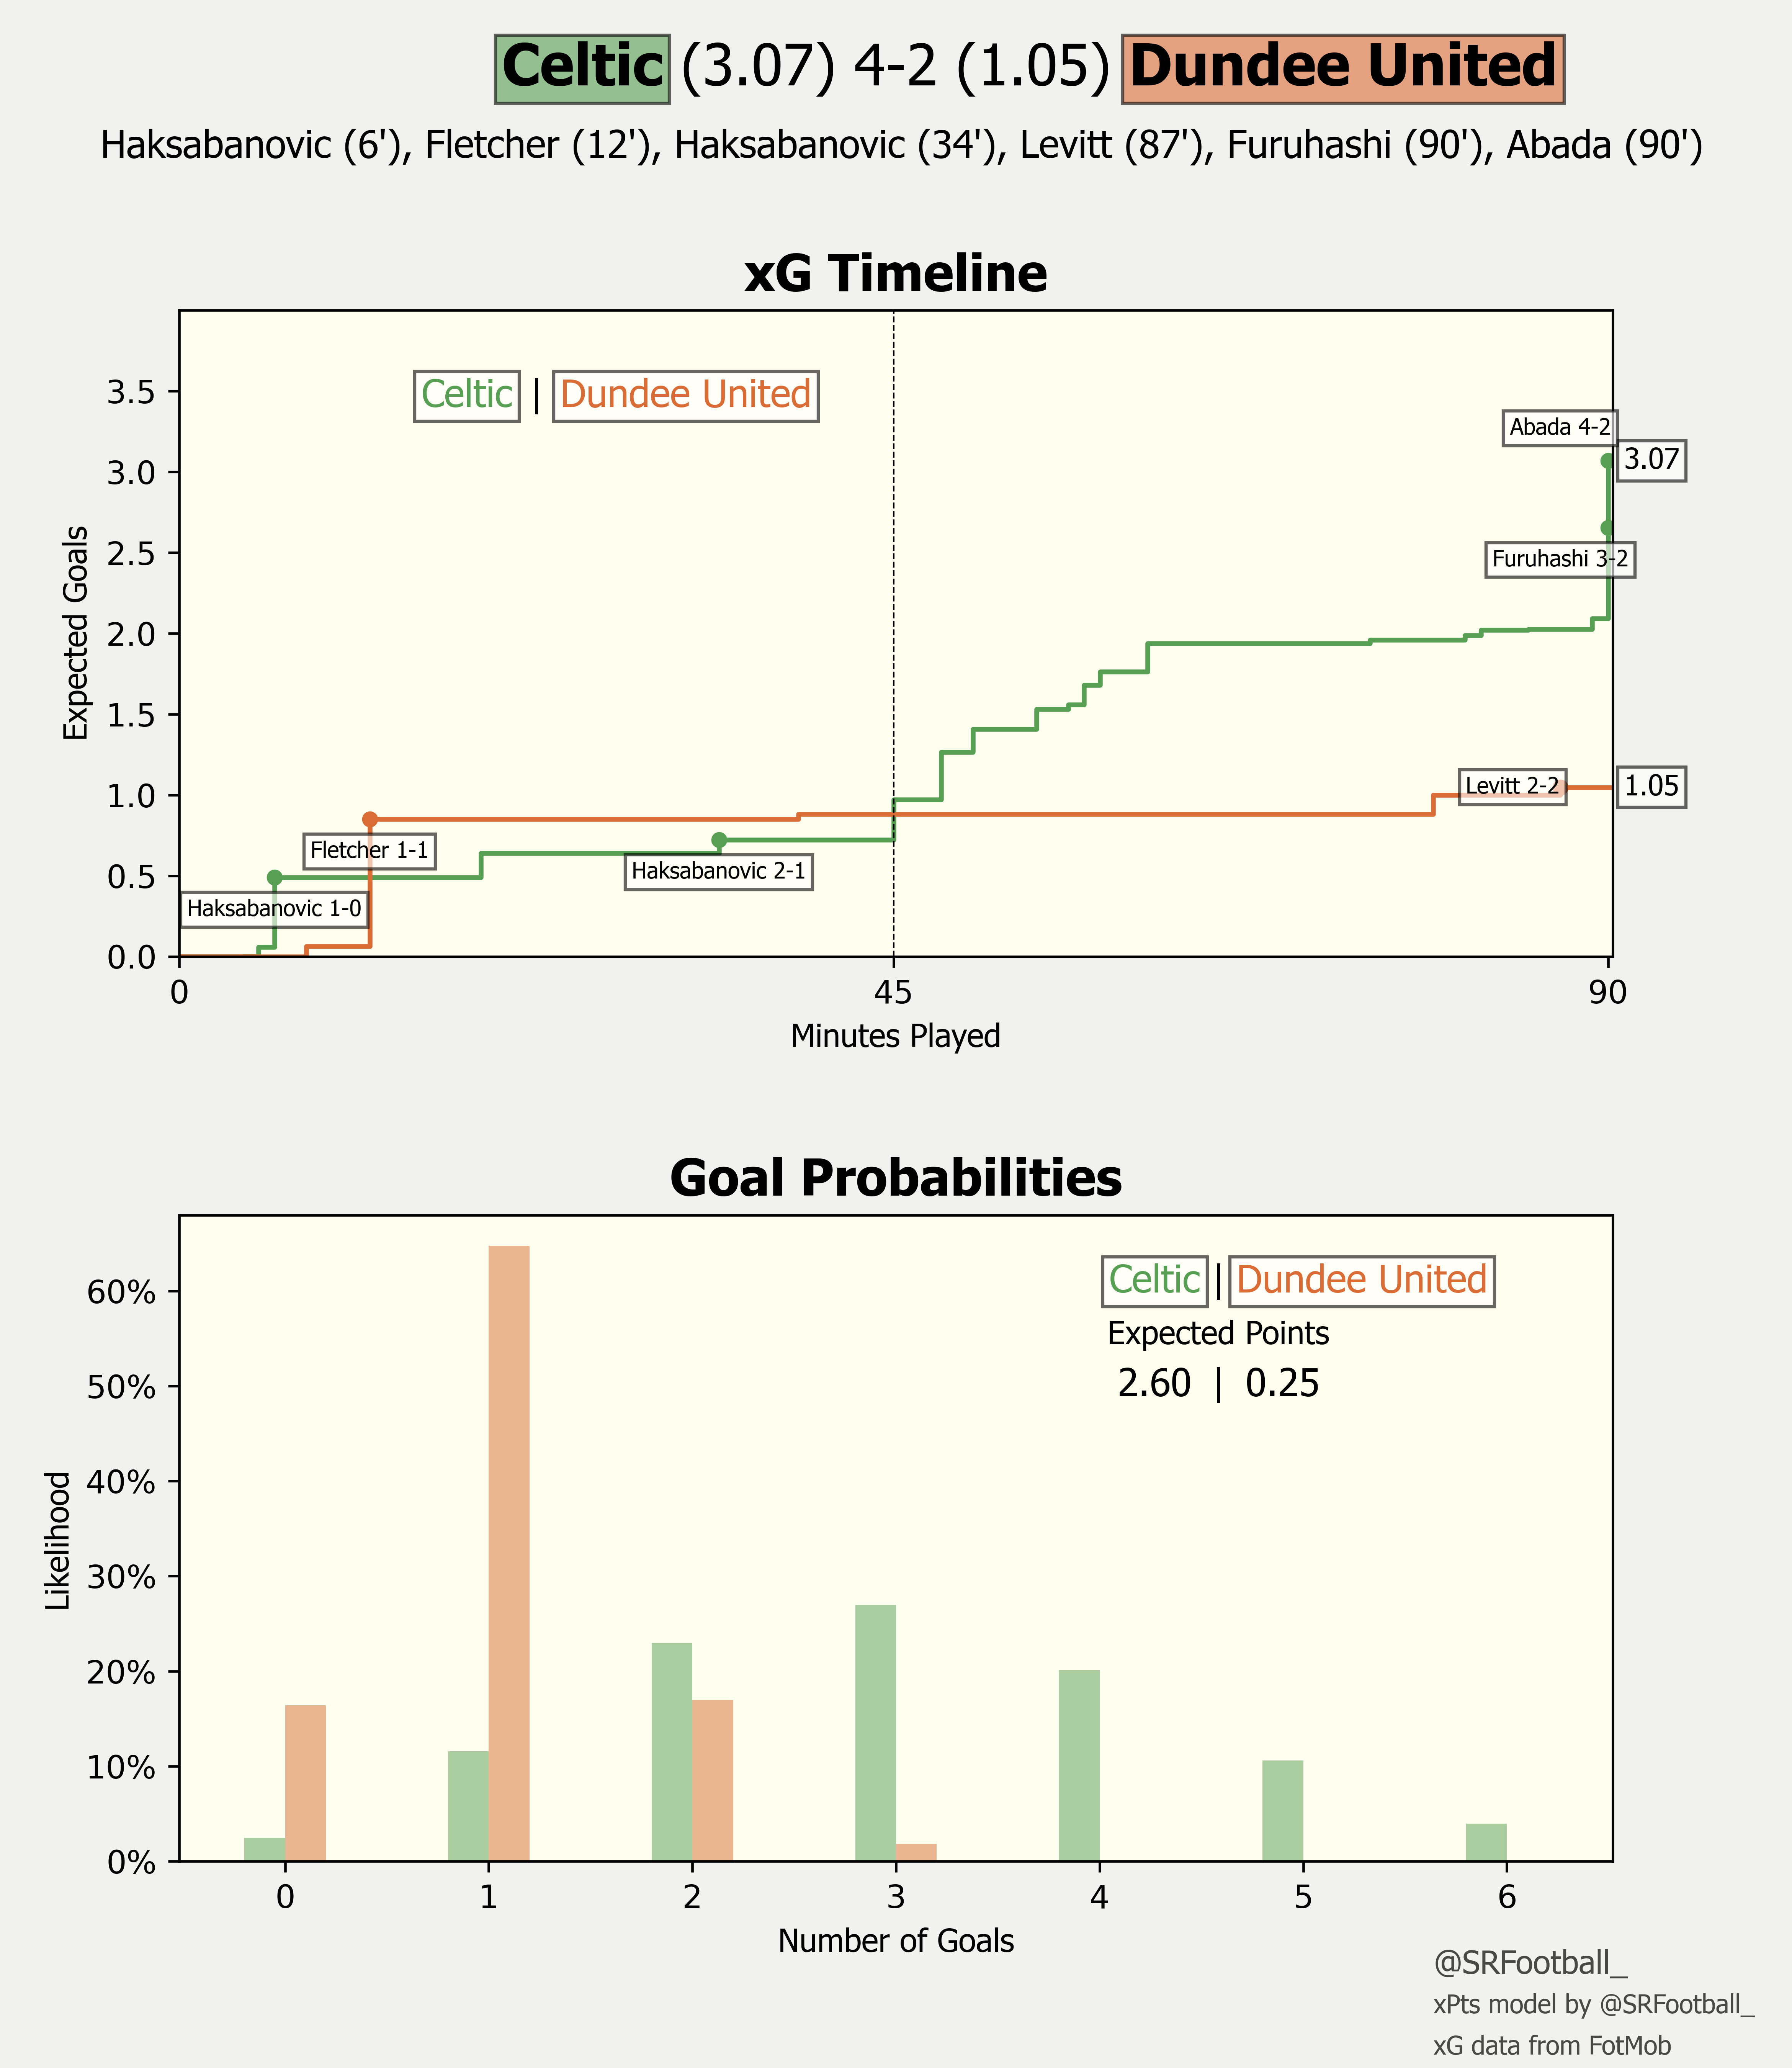
Despite a controversial VAR-awarded penalty for Dundee United, Celtic earned a deserved victory. This was even after an in-swinging cross from Dylan Levitt was missed by Tony Watt and found its way past Joe Hart to make the score 2-2 with just a few minutes of regular time left. 2.60 xPoints indicates that Celtic created sufficient chances to deserve a victory, and how they did this with the personnel used is interesting.
This season we’ve become accustomed to Ange Postecoglou repeatedly rotating the squad in the league. David Turnbull was the most notable player to be rotated in this weekend, but not just because he’s heavily been used as a late sub this season: Turnbull’s inclusion was interesting because Reo Hatate was not excluded. This meant that Turnbull lined up on the right of Celtic’s central midfield triangle instead of the usual left.
Celtic have favoured their left for a long time now. This is for several reasons, (including regularly fielding a left-footed pivot) but also more of Celtic’s key players (Greg Taylor, Reo Hatate, and Jota) playing on this side. Before this match, Celtic averaged only 45.6% of their passes starting on the right of the pitch (league average 50.0%). However, in this match, 48.8% of Celtic’s passes started on the right. This increase gives a clue as to what Celtic did well in this match.
Below is a map showing Celtic’s average pass locations against Dundee United. The shape is normally much more symmetrical - especially the 2-3 base. Matt O’Riley (#33) and Anthony Ralston (#56) both pushed higher, with the former moving more towards the right. Turnbull (#14) positioned ahead of them. Sead Hakšabanović (#9) was also much narrower than wingers in this system are usually. Cameron Carter-Vickers (#20) was also higher than his counterpart, Moritz Jenz (#6) and - between the five players - control was exerted deep in the right halfspace.

The reason for this was to free up Hatate and Jota on the left. Turnbull is usually criticised for his lack of forward incision with his passing, but this game plan turned the possession maintenance trait into a positive. By concentrating build up in that area and threatening an overload, Dundee United were forced to shift towards this side which left space for Celtic’s left-sided creators. The first goal - Hatate picking up the ball and sliding in Jota who has space to advance and cut back for Hakšabanović - exemplifies this perfectly, with the spell before the transition phase involving Turnbull’s close range passing.
The below map shows how Celtic’s passes into Dundee United’s box mirror this theme.

More evidence for this comes in the form of Expected Threat (xT). xT is a metric used to attempt to value the threat created by each pass in a match (see Karun Singh’s formational blog on the topic here). Similarly to xG, it uses historic data of goals scored for calibration but - instead of simply focussing on shots - it iteratively works backwards to attempt to quantify which passes move the ball into areas from which the team are more likely to score. The difference in likelihood from the area in which the pass starts to the area in which the pass finishes is the xT value of the pass. Possession value models such as this are - like all models - useful but imperfect. One imperfection is that negative xT passes are not always bad. Up-back-through passing routines (definition here), for example, require a backwards pass that would usually score a negative xT value. As an illustration of this, Leandro Trossard’s pass in the build up to Trevoh Chalobah’s own goal in Brighton’s 4-1 victory over Chelsea was essential to the routine; receiving the ball before playing back to Moisés Caicedo pulled Chelsea forward, allowing space for Pervis Estupiñán to run into (watch here). However, Trossard’s pass receives an xT value of -0.003 while Caicedo is credited with an xT of 0.019. For this reason, it is good practice to exclude negative values when using xT.
The relevance of xT for this match is not actually with xT itself, but with xT received. By measuring this, we can assess who received the ball in areas that were most likely to progress the ball to create goals. In terms of xT received, Celtic’s top five players from this match are:
Greg Taylor (1.527)
Reo Hatate (1.525)
Alexandro Bernabei (1.325)
Jota (0.858)
Moritz Jenz (0.416)
Notably, these are all left-sided players.
Celtic’s lead at the top of the table is extended and Postecoglou’s flexibility and problem solving within the confines of the Positionist framework he has implemented continues to impress. It is now guaranteed that Celtic will go into the World Cup break as league leaders.

St. Johnstone 2-1 Rangers

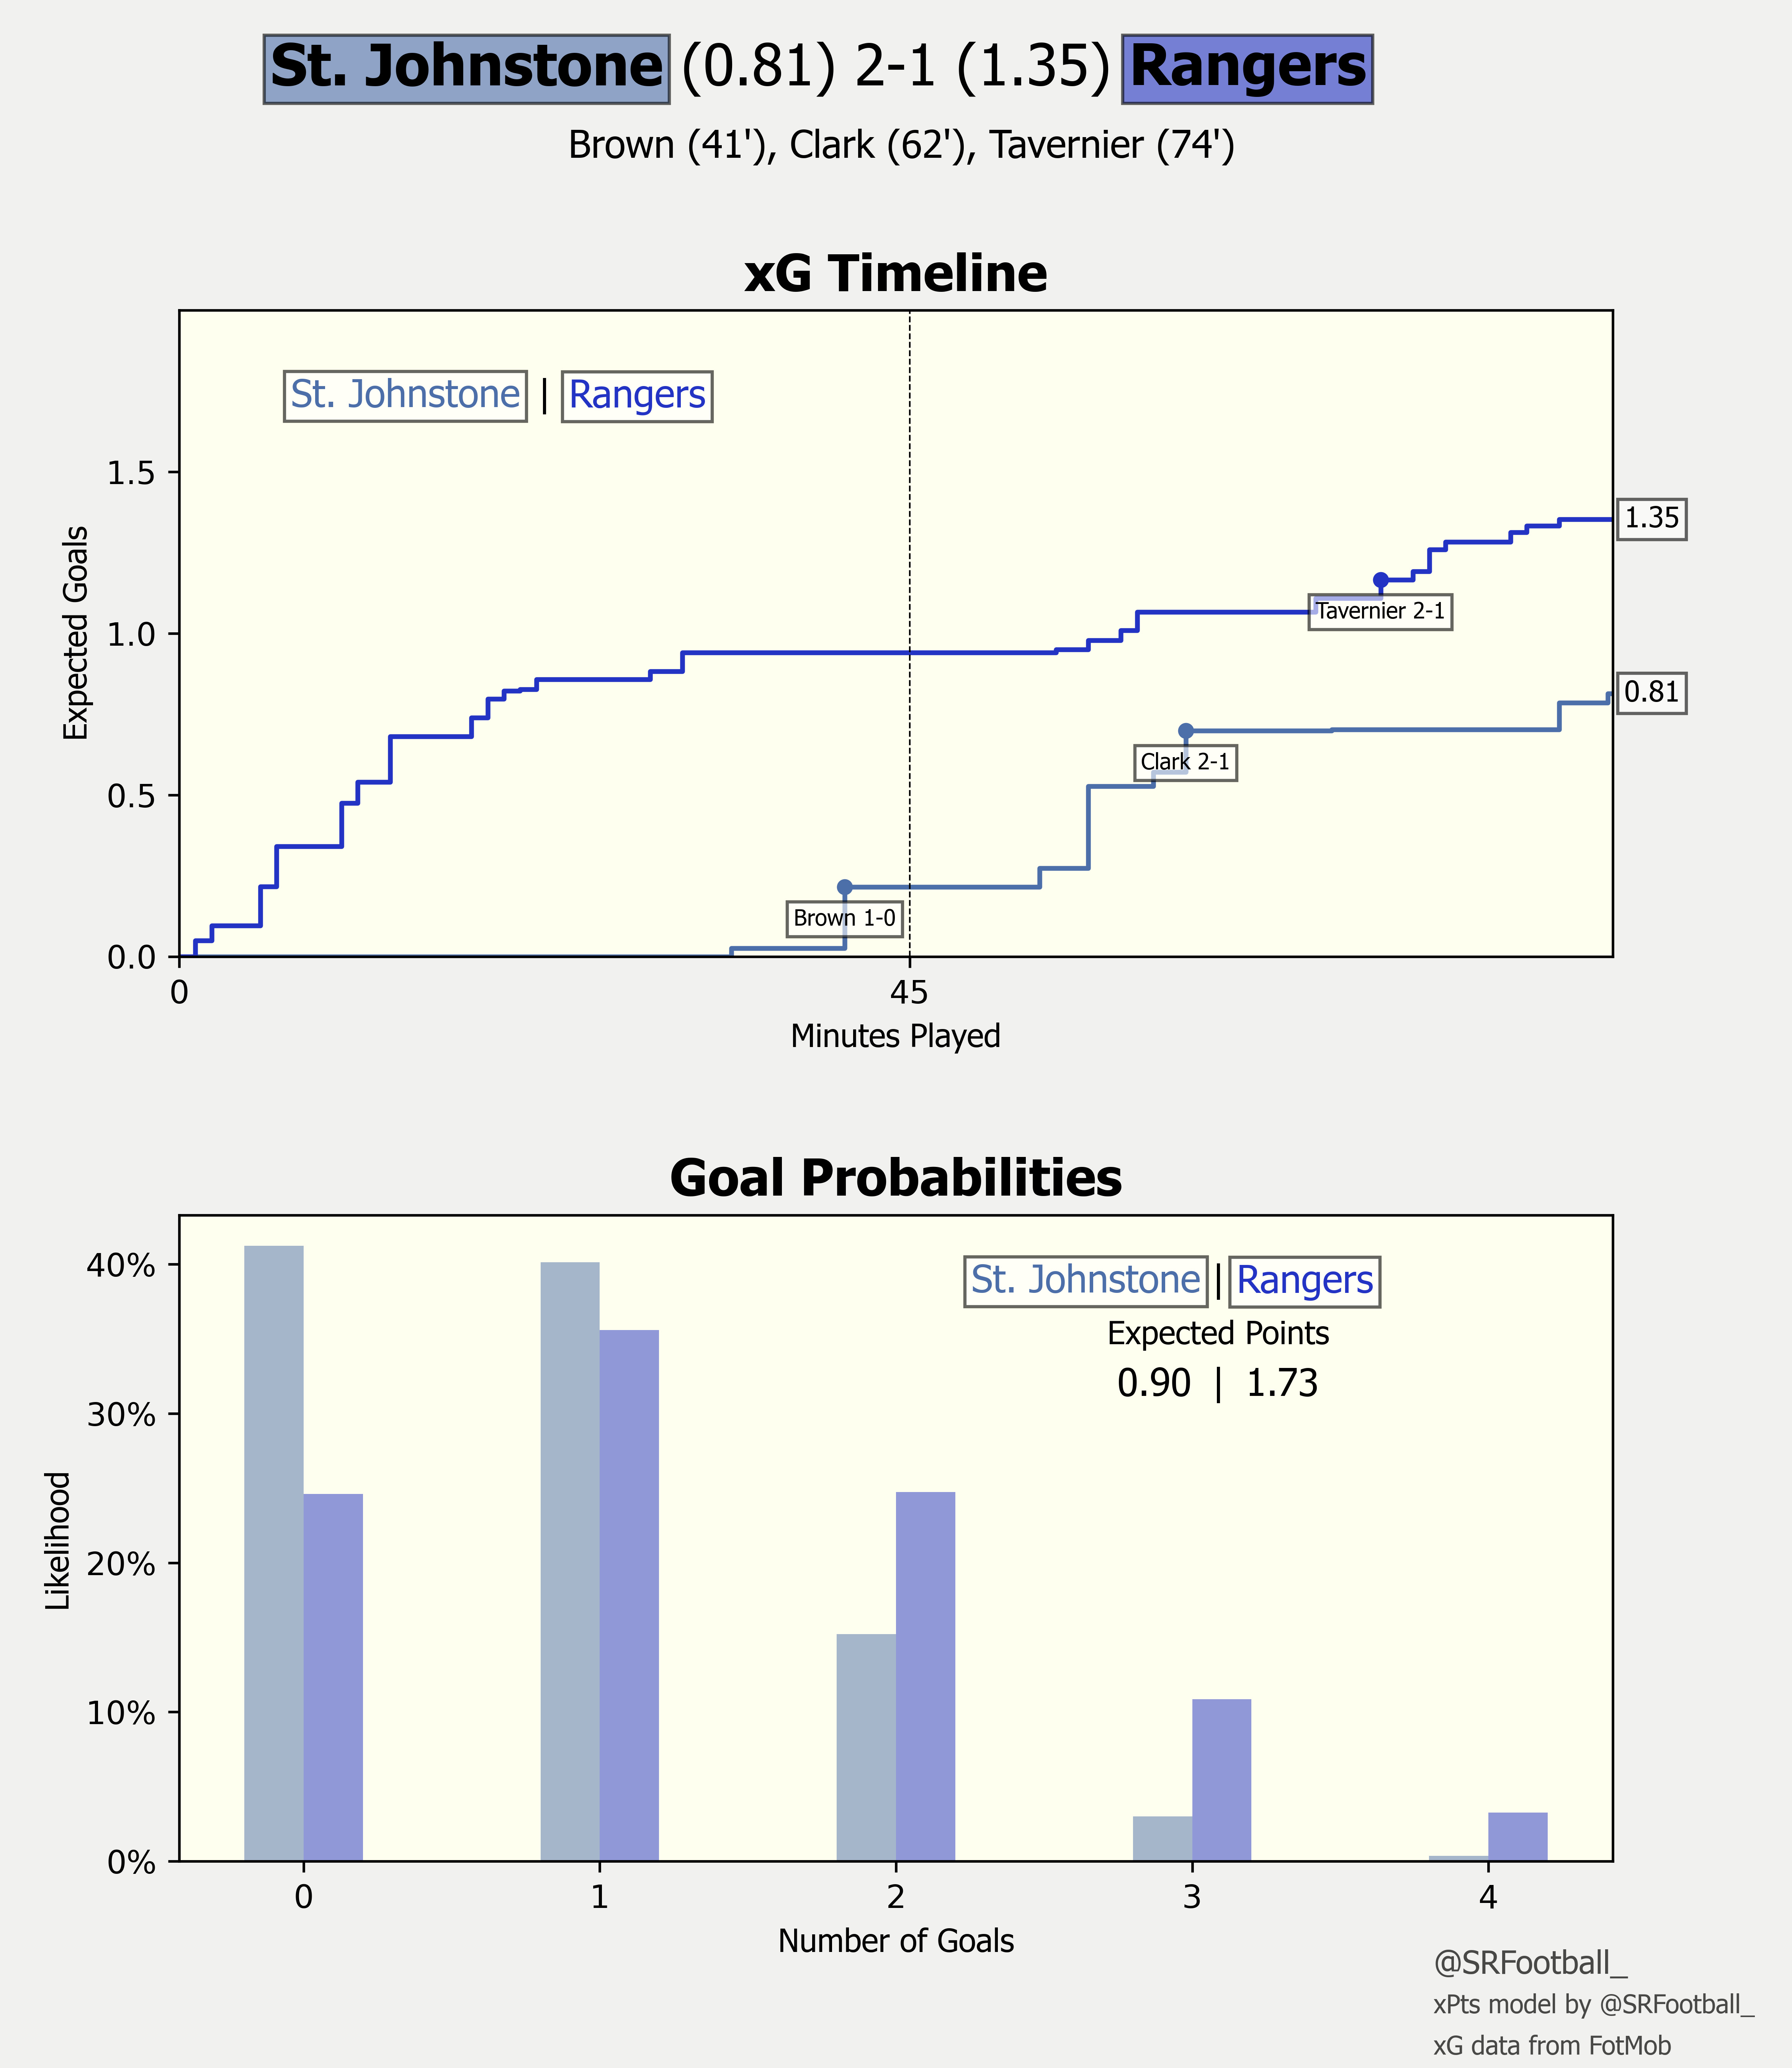
As Rangers’ dominance in this game tailed off, St. Johnstone struck with a James Brown screamer (0.02 xG!). Hitting Rangers for a second on the other side of half-time, they managed to hold on despite a flurry of shots as the final minutes approached.
While 1.73 xPoints doesn’t sound disastrous on the surface - it’s still the lion’s share - it is Rangers’ second lowest of the season, with only the Glasgow Derby disaster adding a smaller value to Rangers’ total. Their current season average of 2.22 xPoints is 0.24 lower than Celtic’s average of 2.46. While the league campaign is still young and plenty of changes can be expected - following the World Cup break and January transfer window specifically, but also as teams face different challenges with having played some teams home or away and not the reverse - this average gap would extrapolate to approximately 9 points over the course of a season. This is, unsurprisingly, concerning for Rangers.
In this game specifically, Rangers’ initial setup and in-game management both raised questions. Starting with a double pivot of John Lundstram and James Sands - as against Aberdeen - forced the former to play a more robust role, often making attacking runs in the right halfspace. With players such as Scott Arfield, Scott Wright, and Rabbi Matondo on the bench, a midfield lacking creativity and progressive ball carrying was a poor choice. A single pivot in either Lundstram or Sands with one of the aforementioned players - perhaps Arfield given his progressive abilities in the left halfspace - partnered with the chosen creator, Malik Tillman, ahead of the pivot would have been more appropriate to bolster Rangers’ attacking prowess.
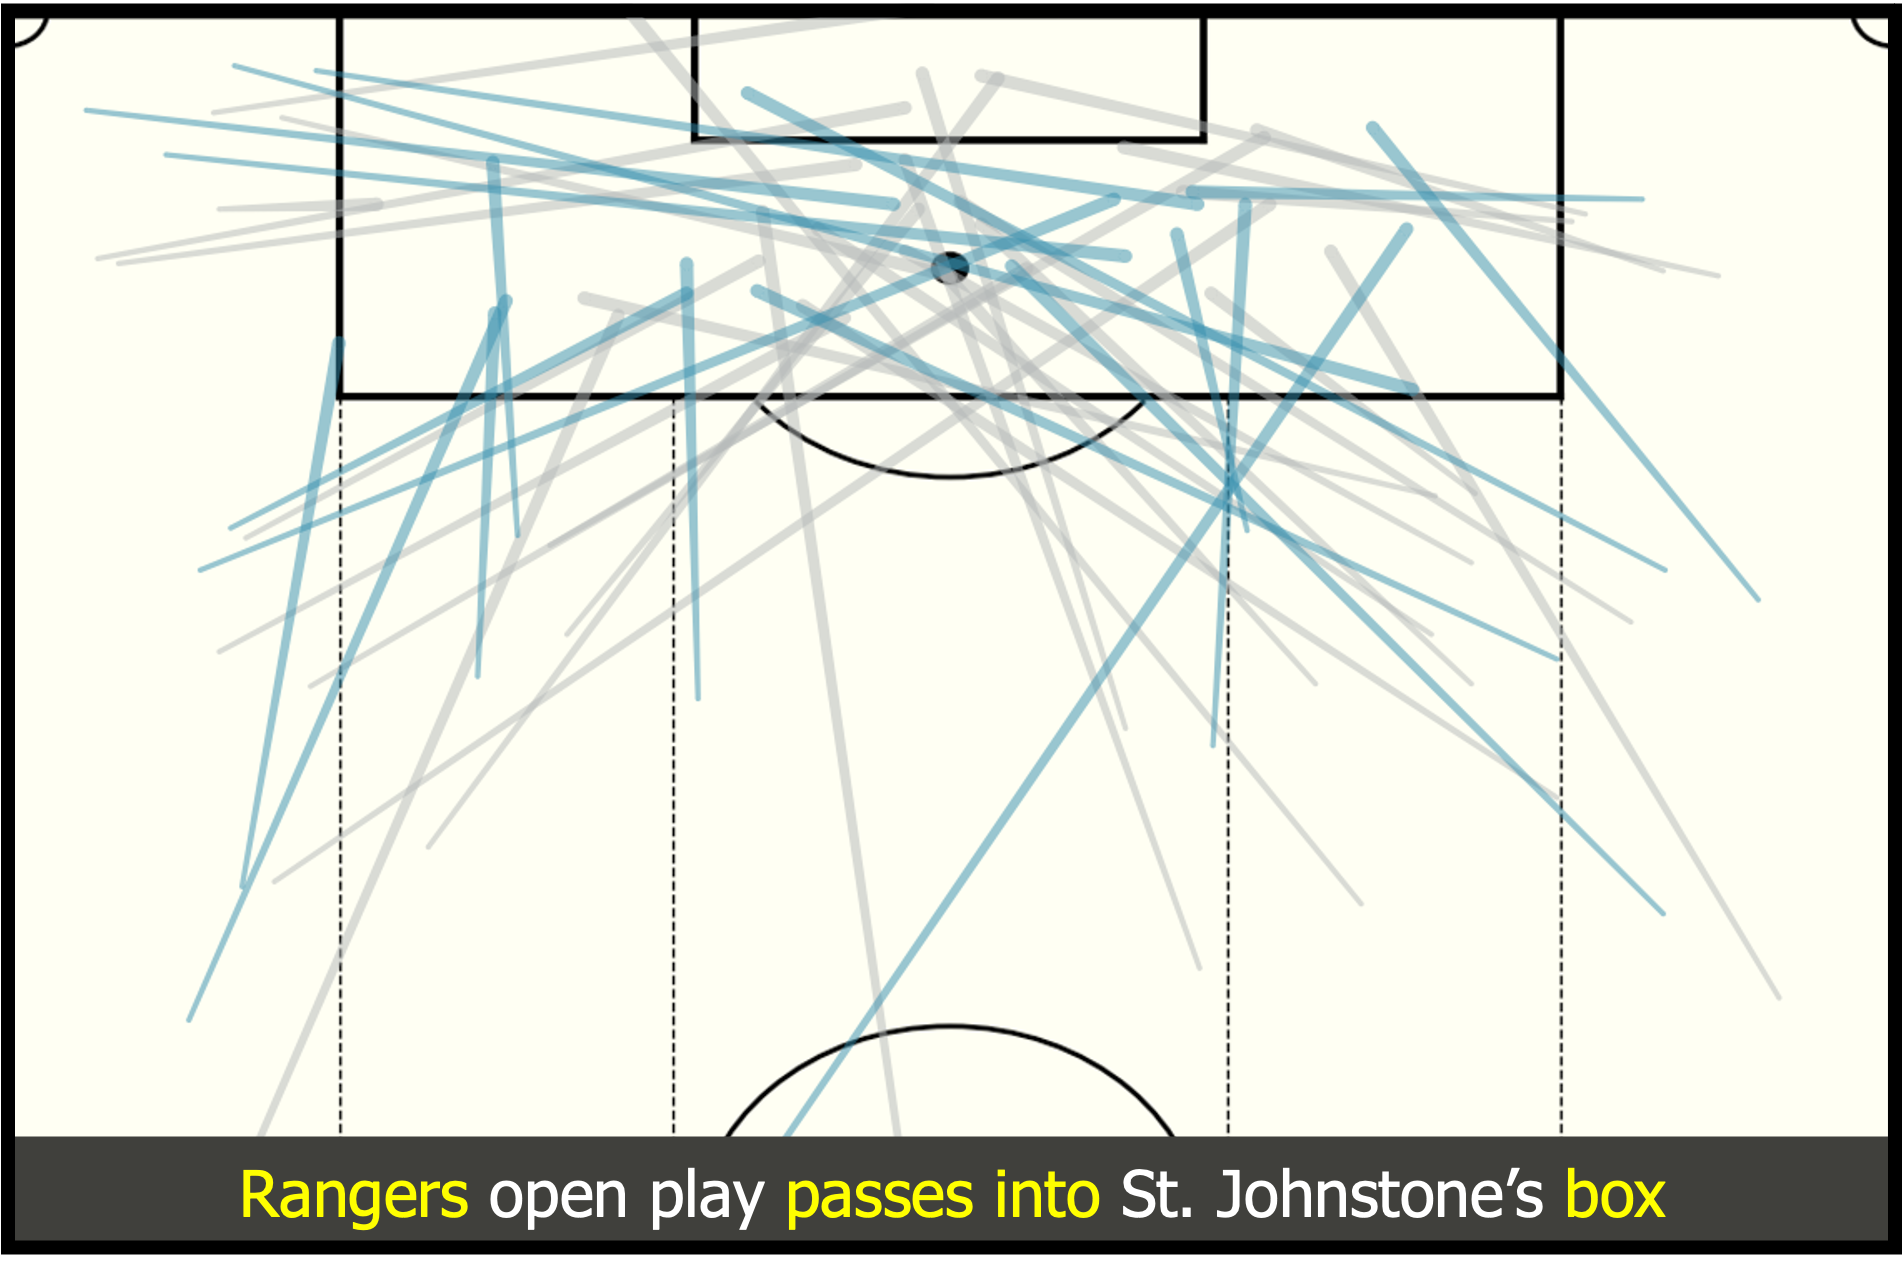
The knock on of this is that the fullbacks - Borna Barisic and James Tavernier - would not have had such free roles as the current double pivot system allows them to advance with lessened concern about the space behind them. Given Rangers’ tendency to revert to hopeful crosses from their fullbacks when faced with a low block, however, this could have been an additional positive. Tavernier scored because of his more free role, but Rangers might have created more chances - and thus increased their chance of winning the game - had the attacking emphasis been switched. As is becoming a regular fixture within this newsletter, here are Rangers’ passes into the opposition box - once again heavily reliant on deep crosses.
Around the hour mark, Arfield was introduced alongside Alfredo Morelos. However, instead of Antonio Čolak being replaced it was Tillman and Ben Davies. The replacement of the latter meant keeping Sands on the pitch - more progressive with the ball than Davies - while adding a more creative option to the midfield but choosing to keep Čolak on the pitch alongside Morelos perhaps indicated that Giovanni van Bronckhorst was favouring the ability to find space - and thus chances - in dangerous areas within the box. However, this hamstrung their ability to actually create contrasted with the hypothetical scenario in which Čolak is replaced - either by another creator or simply a like for like with Morelos.
This match is but another in a string of concerning performances for Rangers. Whether it’s due to a weakened squad from last season, an unlucky set of injuries, or Van Bronckhorst simply making mistakes, improvements are required if Rangers would like to keep up with the juggernaut that is Ange Postecoglou’s Celtic.

Aberdeen 4-1 Hibernian

Hearts 3-2 Motherwell

Ross County 3-2 St. Mirren


Kilmarnock 2-3 Livingston

xPoints Table
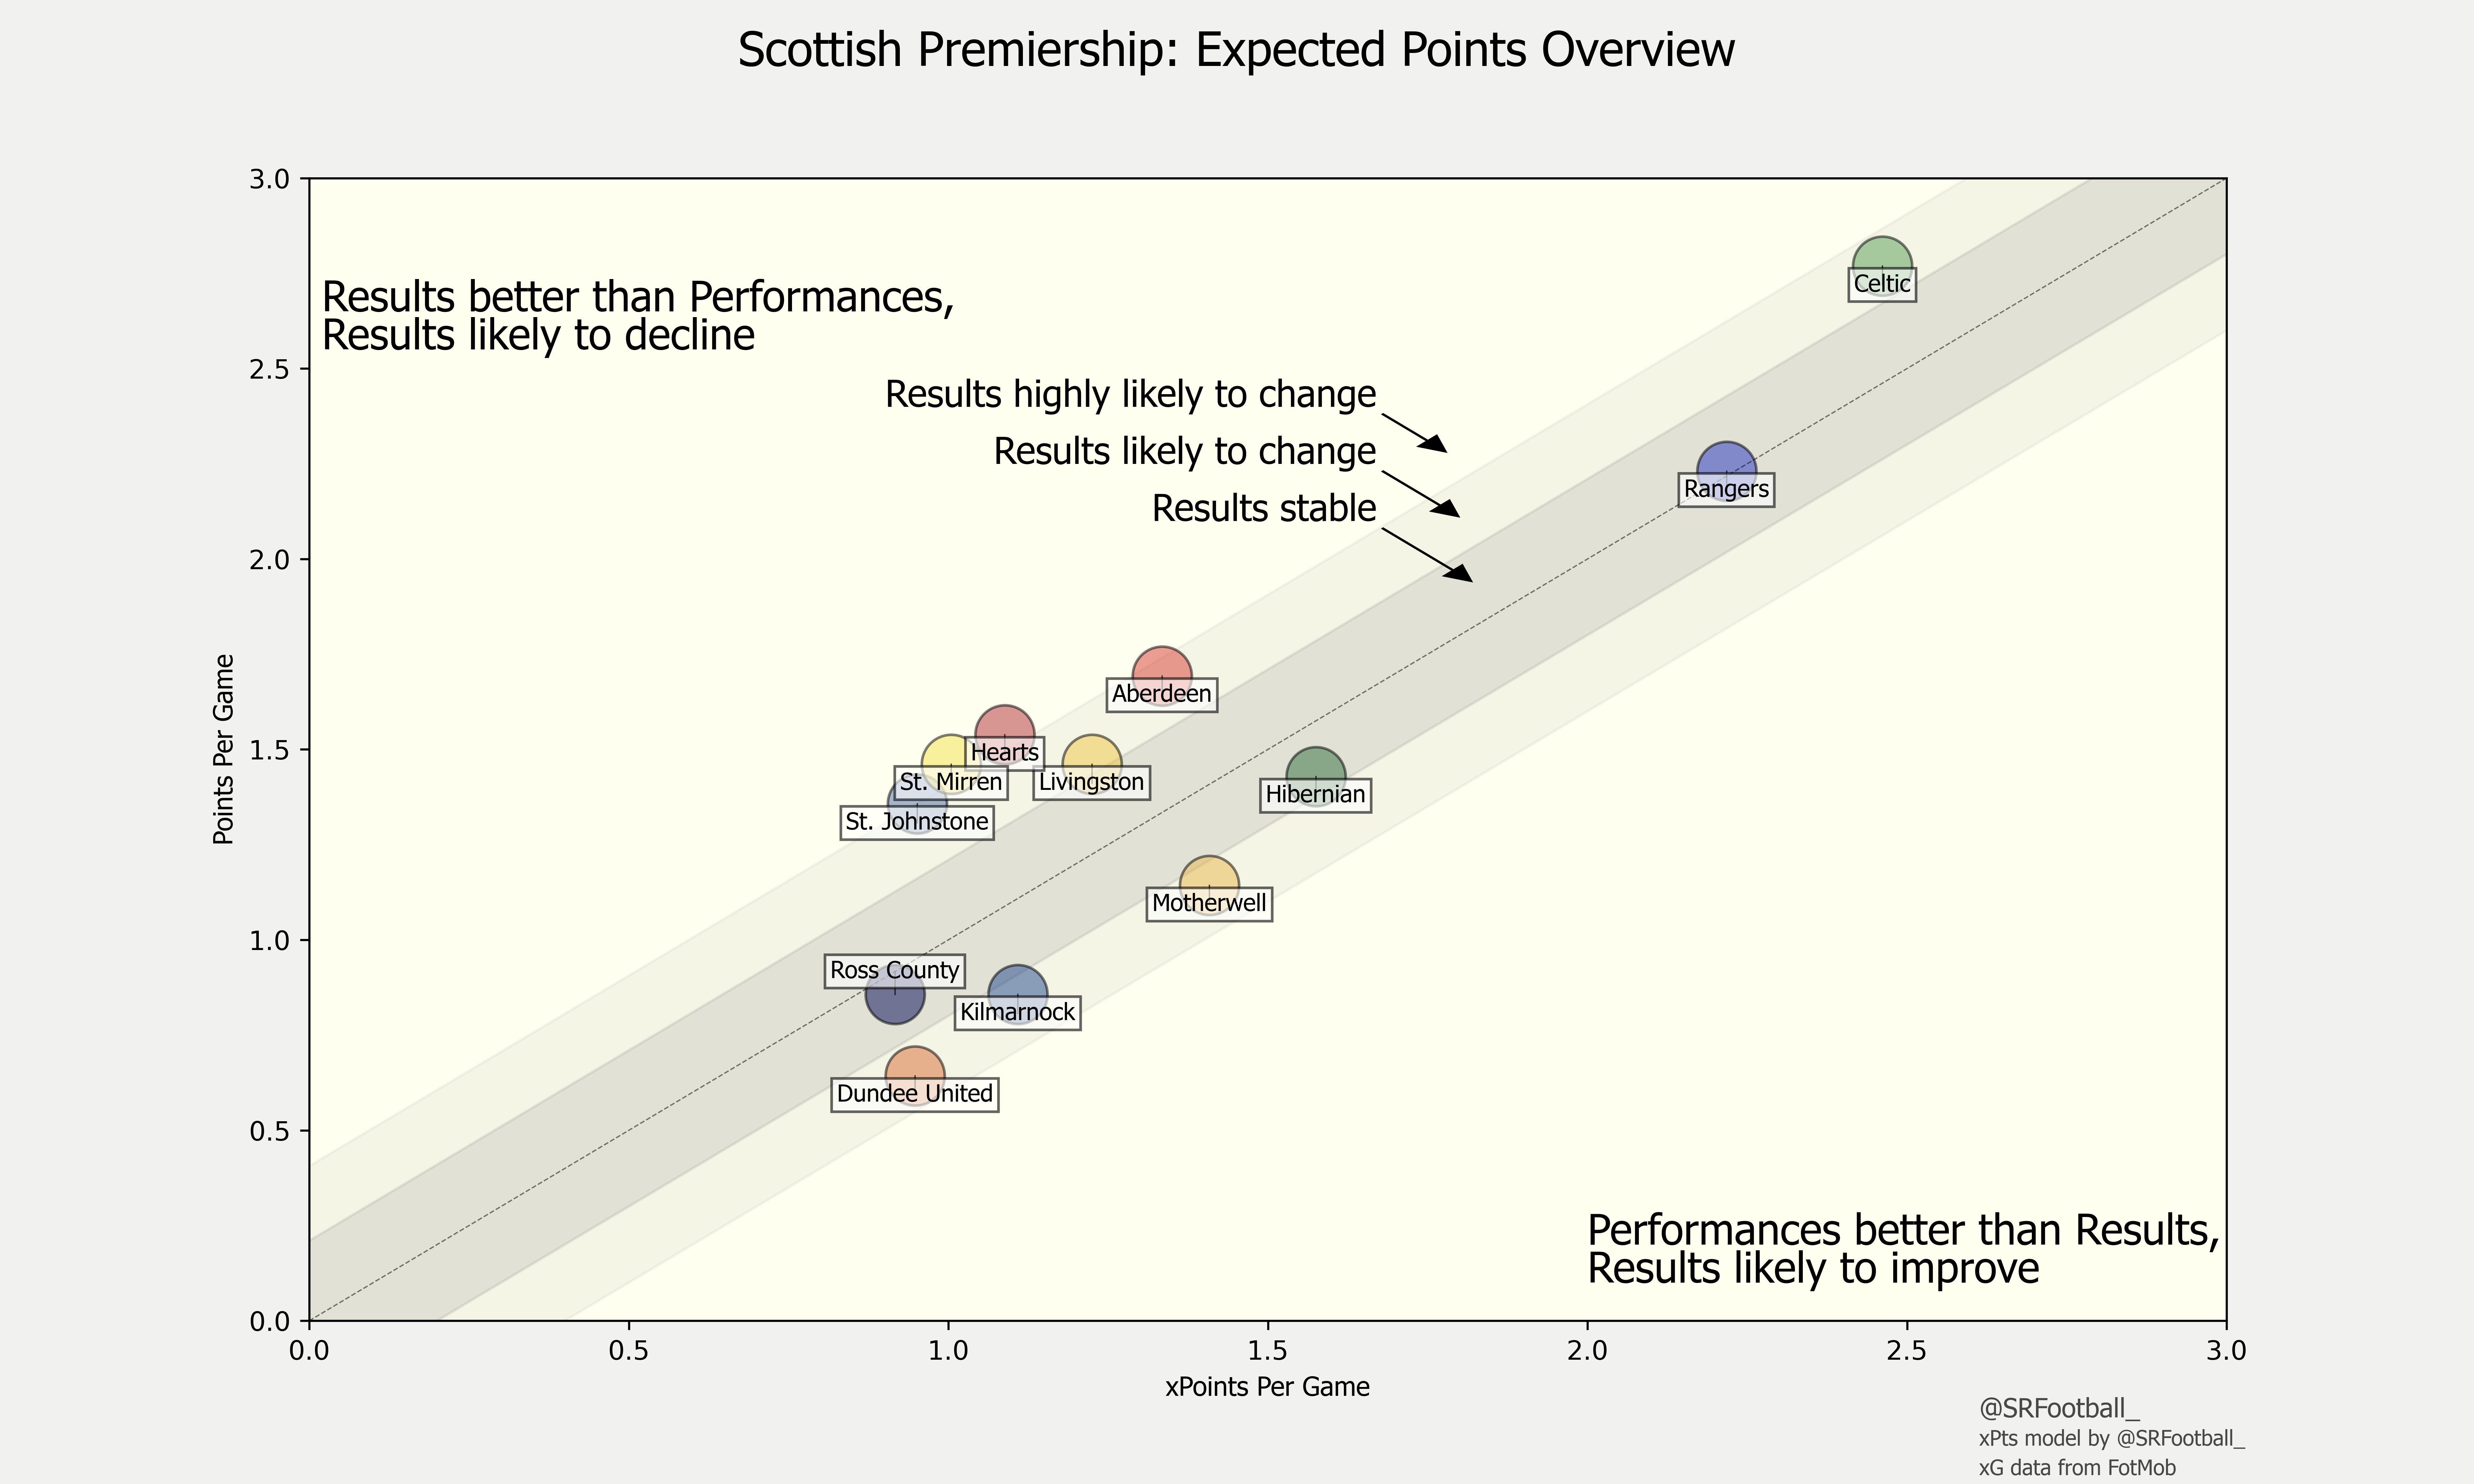
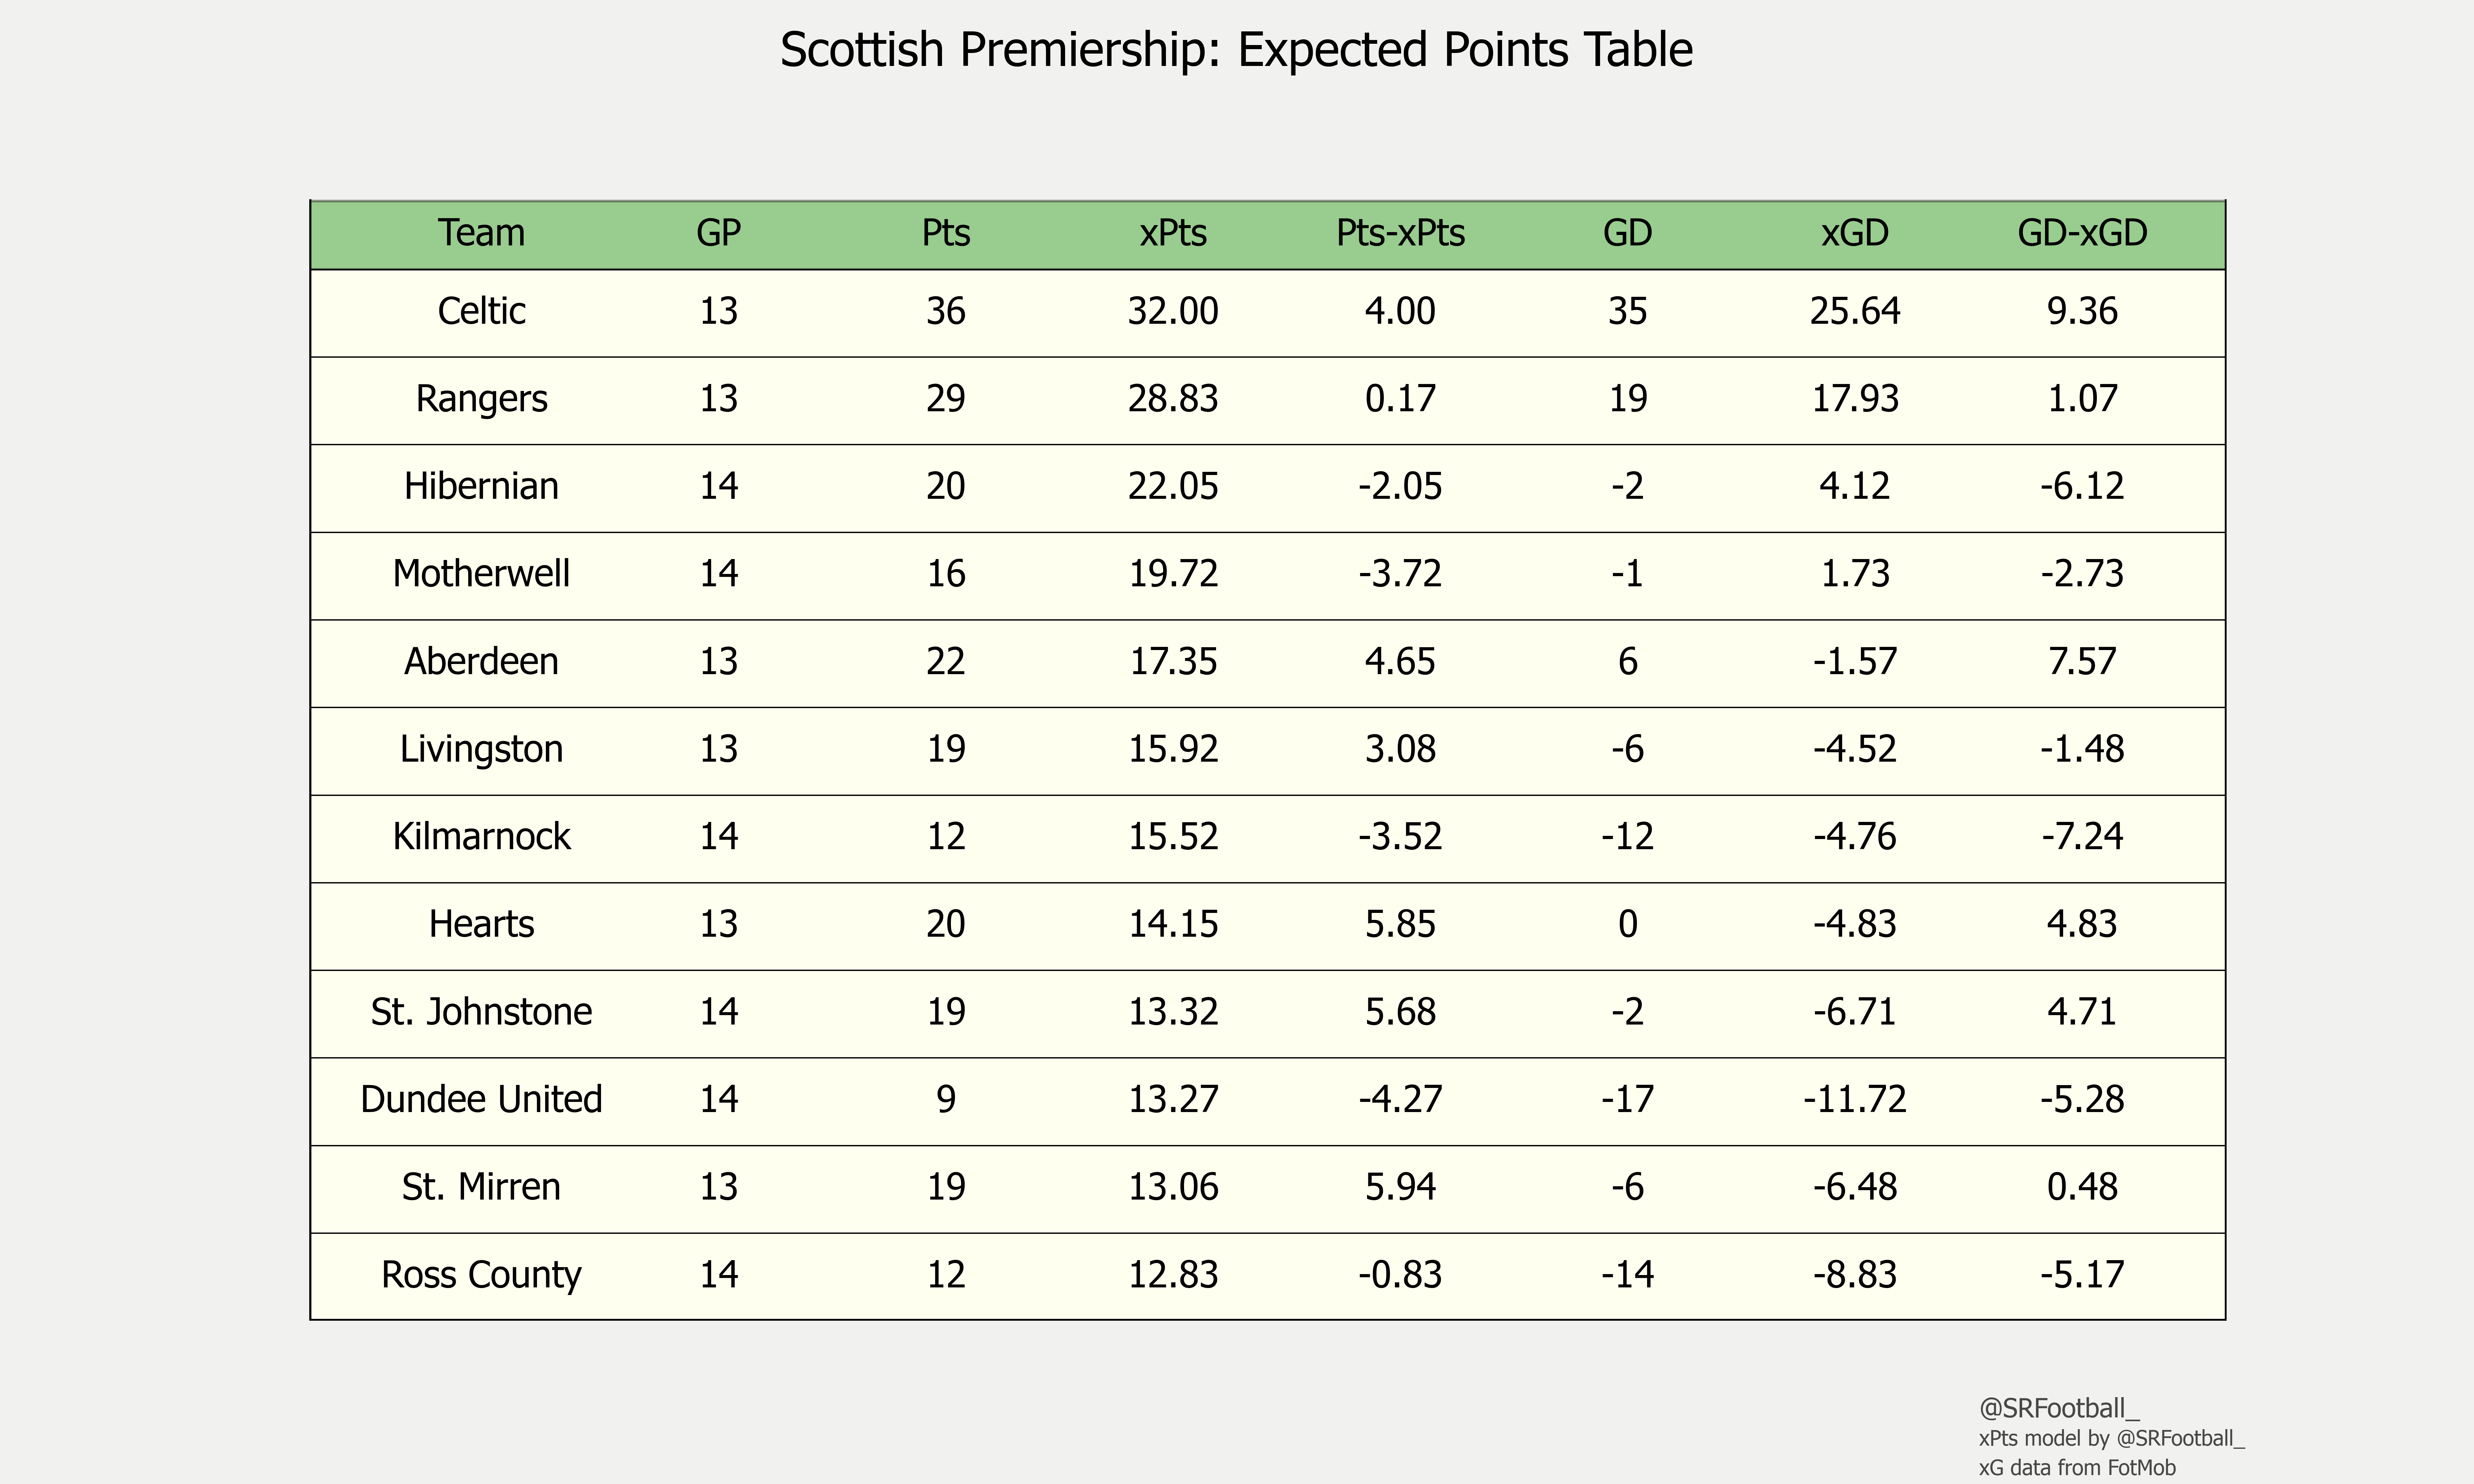
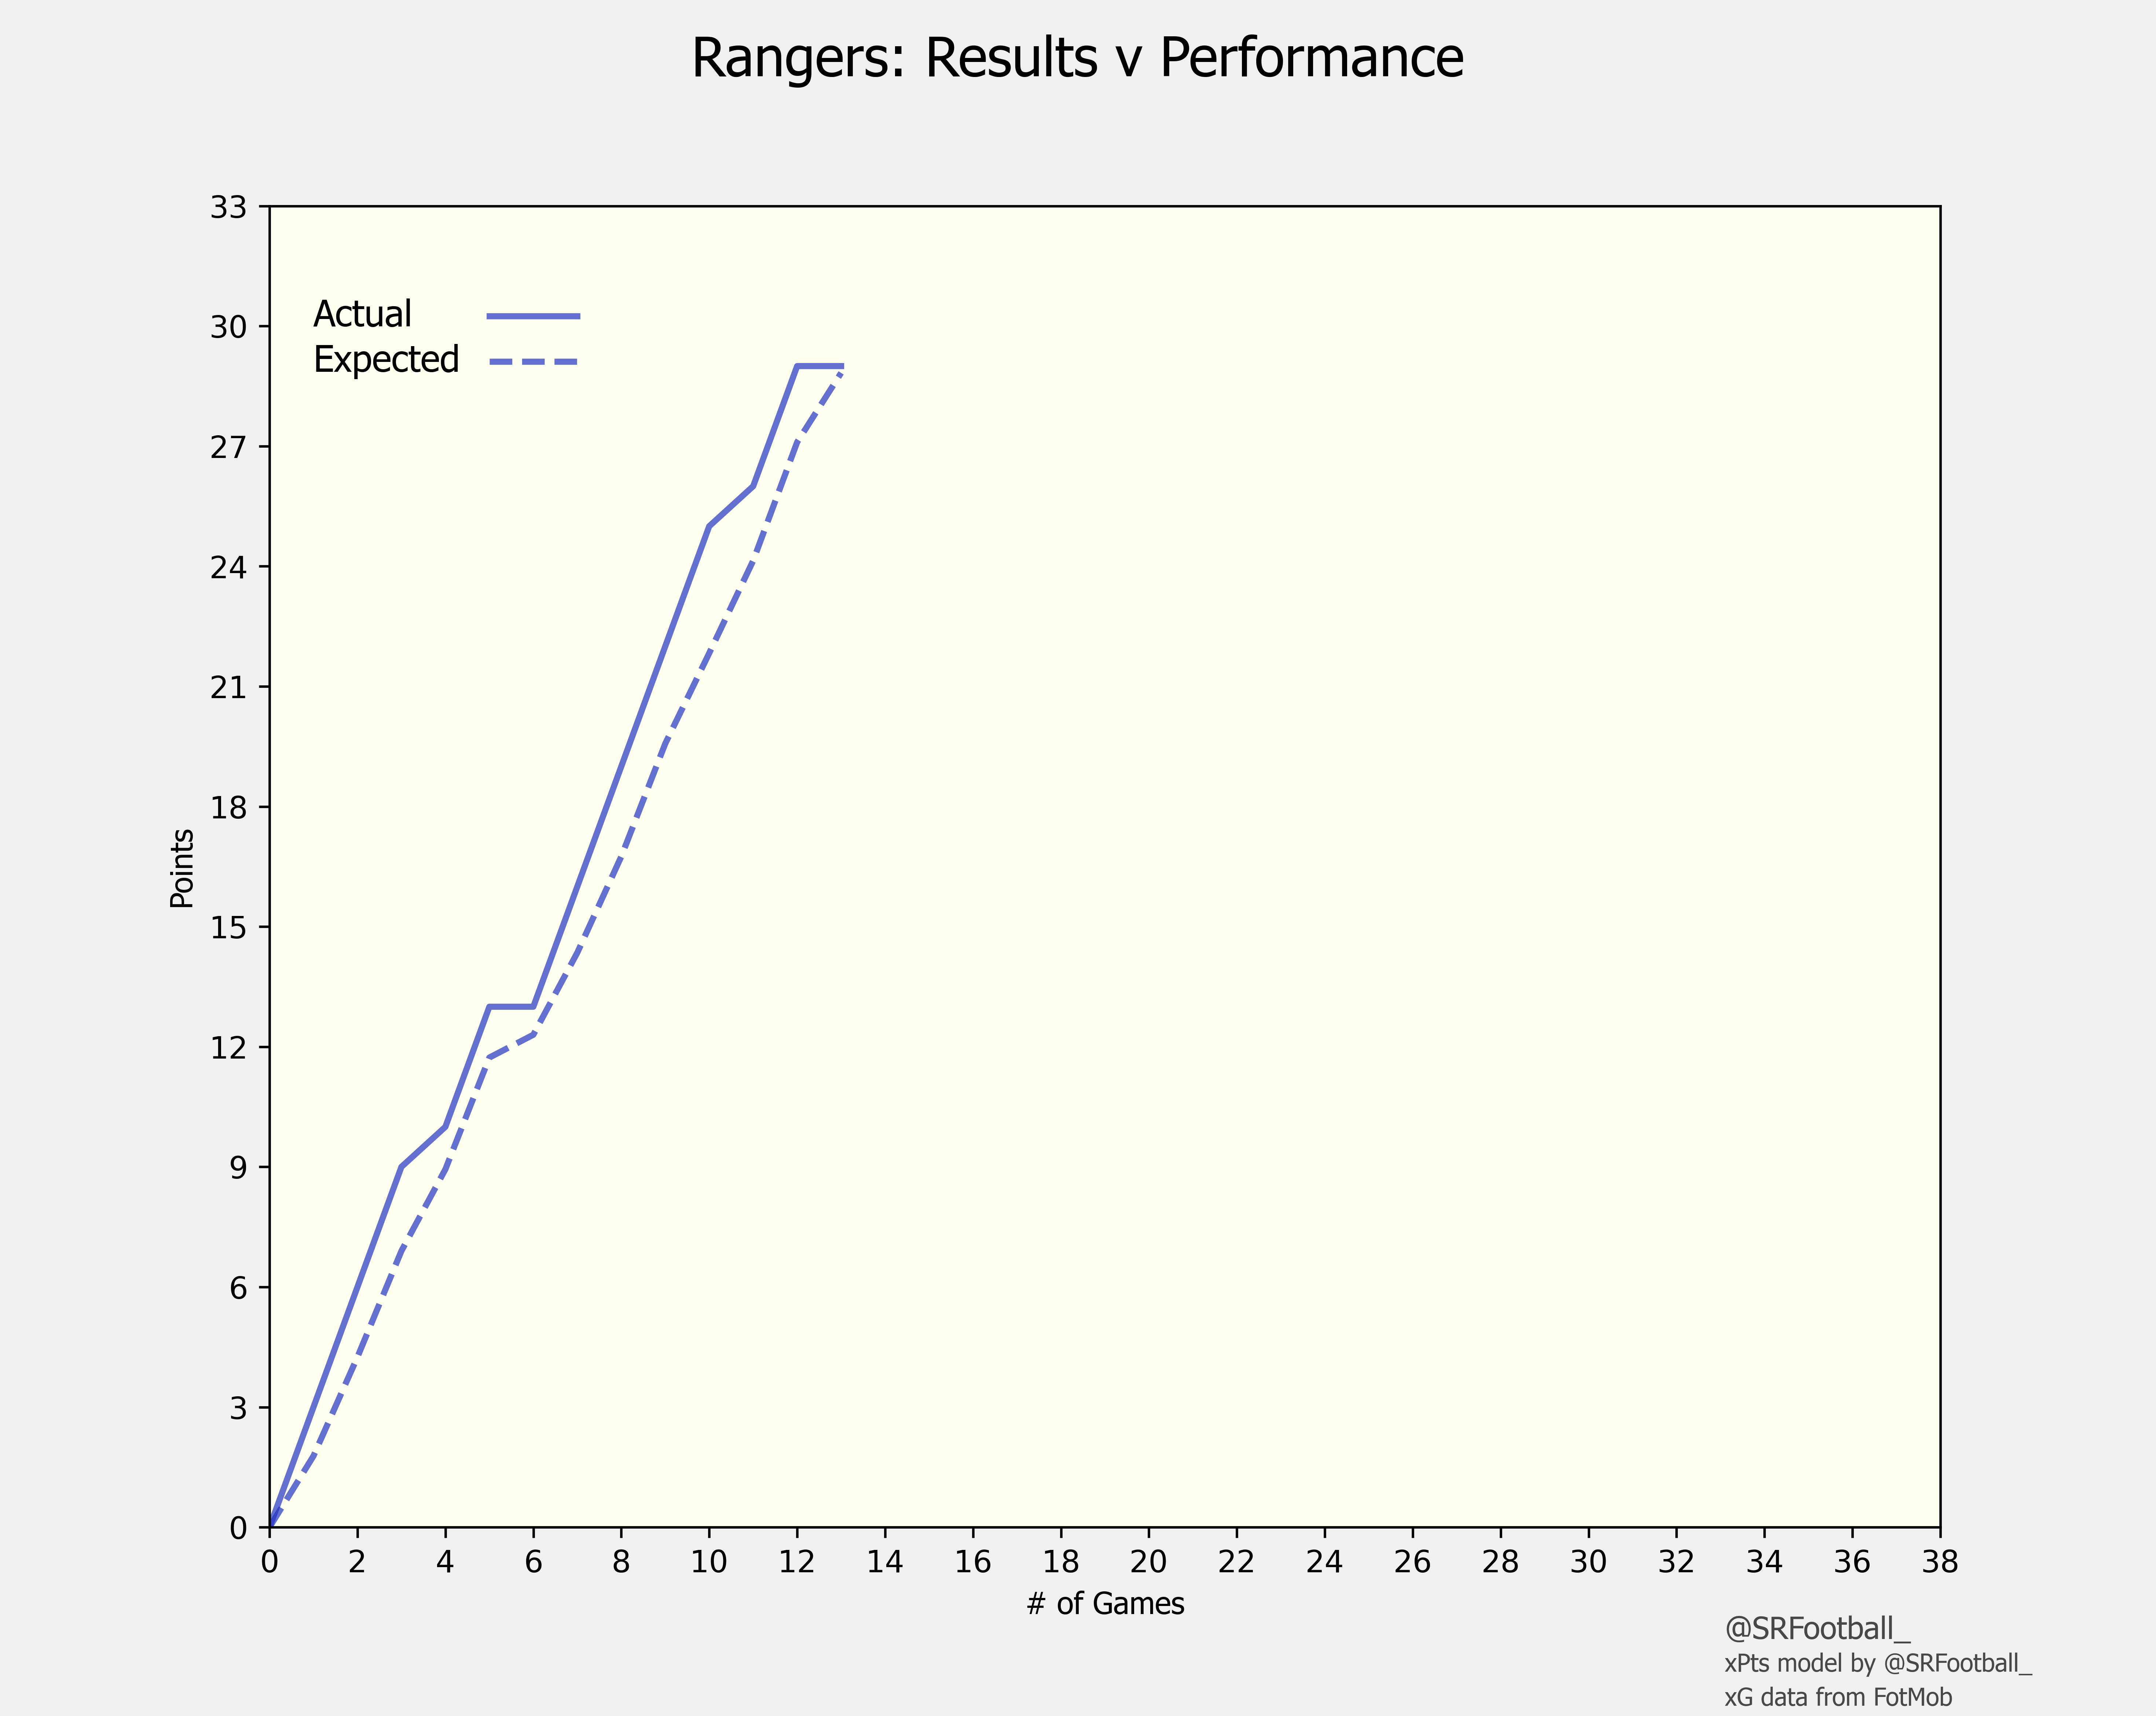
While - by the grace of goal difference - Rangers are now closer to third place than first in the league table, the gap in the xPoints table is more resemblant of what is expected based on team strength. 3.17 xPoints separate Celtic and Rangers while 6.78 xPoints separate Rangers and Hibernian (the latter of which have played an extra match in comparison). This is less of a comment on Rangers’ luck, however, and more a comment on Celtic’s overperformance and Hibernian’s underperformance. As the above visual shows, Rangers are nearly exactly where they ‘deserve’ to be based on their xPoints.
Celtic’s overperformance has strayed into the realms of somewhat unsustainable. This doesn’t mean that Celtic aren’t deserving of their position at the top, though. The gap between them and Rangers is notable and appears to be growing. It simply means that - with the same levels of performance - it is likely that Celtic pick up points at a slightly lower rate in the next similarly observable sample than they have so far. The indicated rate (32 in 13), however, is still above what Rangers can expect should no improvements be made.
The fight to earn top six is not dissimilar to the fight to avoid relegation. While Hibernian, Motherwell, and Aberdeen seem destined to battle for the third best team in the table, the gap between sixth (Livingston) and last (Ross County) is just 3.09 xPoints.