

Peering through the tissues #4: Iterations
Peering through the tissues #4: Iterations
How incremental innovations are pushing the breadth and scope of spatial transcriptomics

Dear Community,
This week’s post will likely be rather short. I am heading to the Netherlands to meet a buddy over the weekend. As much as I want to write a detailed breakdown of two cool papers, I have to cut it short, so the format will be slightly different. But I am up for a chat in the subscriber’s chat to clear your doubts and satiate your curiosity.
It also has been an eventful week. We have a collaborative post with the good and excellent folks from the Moffit research centre who run the Mathematical oncology blog (article link). I hope to write for their blog occasionally on the intersection of Math and Bioinformatics. So, subscribe to their newsletter here and keep yourself informed.
As always, not to sound like a broken tape… The following helps me a lot and would not take any significant time from you and will also help us gather some experts.
Ask your colleagues or friends who are interested in these topics to subscribe.
Tweet and share the post on your social media platforms like LinkedIn or Twitter.
Participate in the subscriber chat. You will find the buttons to do this along the way.
Let’s get started.

“At the close of the nineteenth century, most biologists thought life consisted solely of matter and energy. But after Watson and Crick, biologists came to recognize the importance of a third fundamental entity in living things: information.”
― Stephen C. Meyer, Signature in the Cell: DNA and the Evidence for Intelligent DesignAnd I would add Rosalind Franklin to this.
The flow of information is a crucial part of the design of cells and tissues. Most of the biological field in turn tries to address and understand the flow of information across cells, tissues, and consequently organs. Understanding how this flow works gives us the required insights to understand disease processes and with that information, scientists can manipulate the flow to alter disease states and extend our ability to live.
I have extensively discussed spatial transcriptomics as a new and exciting field of study in the multi-part series(1, 2, 3). This series aims to highlight tools and tool kits that will aid us in recognising the flow of information as Stephen talks about. It is crucial for us to be able to have a broad understanding of how these methods work and how we can implement them in our research context.
When I ventured into writing about spatial transcriptomics, it was and still is a personal journey to cumulatively document the progress of emerging technology. It is also a personal practice that forces me to pay attention and gain insights into how technology evolves. As the legendary vaccine inventor Jonas Salk said in an interview :
Think, observe, and reflect on science and human nature. Ultimately, It is a conversation between you and nature.
So let us continue on this conversation of understanding information within nature using a spatial omics technique developed at Yale university for which you can find a quick overview here.
DBiT-SEQ- Deterministic Barcoding in Tissue.
What is it?
Next-generation sequencing is a procedure for co-mapping of mRNAs and proteins in formaldehyde-fixed tissue.
It uses NGS as a readout.
What is the Key Idea?
A newer approach rather than a bead-based or self-assembled monolayer of DNA-barcoded beads on a glass slide.
Uses microfluidics to replace the "Solid phase capture of biomolecules on tissues"
Can a microfluidics-confined delivery of molecular barcodes to a tissue section enable high-spatial-resolution barcoding of mRNAs or proteins directly in a tissue?
Use a microfluidic chip with parallel changes of varying widths to introduce Oligo-dT-Tagged DNA barcodes and Anneal them to mRNA —> Reverse Transcribe —> obtain cDNA —> High throughput Sequencing.
What are the Key claims?
Easy and direct integration with scRNA-Seq data for rapid cell type identification.
Gene expression profiles in 10µm pixels ie more narrow than visium.
It is likely possible to directly integrate data from scRNA-seq and DBiT-seq to infer cell types and visualize spatial distribution.
What are the Key improvements?
This method is based on two previously published studies:
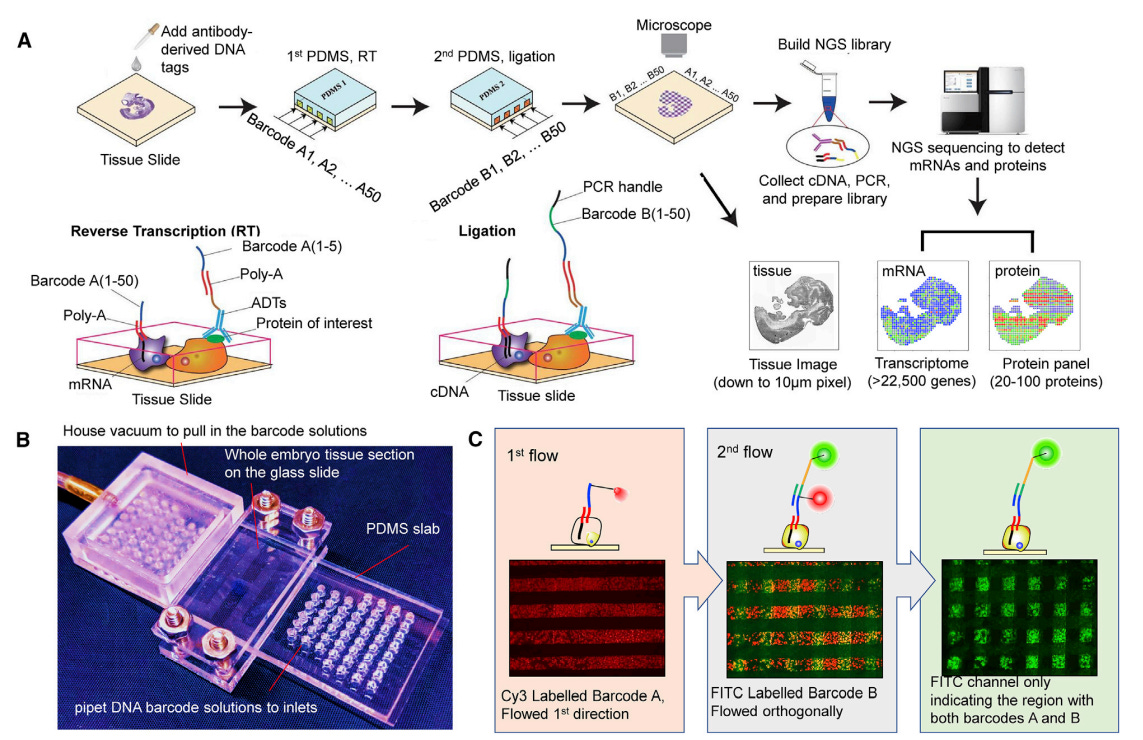
Overview of the procedure and its components. Barcode A: composed of oligo-dT sequence for binding mRNAs, a distinct 8-mer spatial barcode and a 15-mer ligation linker. Barcode B: composed of a distinct 8-mer spatial barcode, 15-mer ligation linker, Unique molecular identifier and a 22-mer PCR handle. PCR handle has a biotin label and can be used to perform cDNA purification using streptavidin-coated magnetic beads. Tissue is imaged after A is applied and B is applied. This helps in morphology and can be used to correlate with the spatial omics map. ADT: Antibody-derived tags contain a 15-mer distinct barcode tagged to the antibody which in turn detects the protein of interest
Innovations and procedure:
Usage of confined microfluidic delivery of molecular barcodes to a tissue section: Enables High-spatial-resolution barcoding of mRNAs or proteins directly in tissue
DNA barcodes A1-A50 are annealed to mRNAs to initiate _in situ_ reverse transcription
This results in stripes of barcoded cDNA inside the tissue.
Next, barcodes B1-B50 are ligated in a perpendicular manner to form intersections in a 2D mosaic
The tissue is then digested to recover cDNA —> template-switching —> PCR amplification —> tagmentation to prepare the library
protein co-measurements similar to Ab-seq or CITE-seq
Demonstrations:
High spatial resolution co-mapping of the whole transcriptome and a panel of 22 proteins in mouse embryos
Detects all major tissue types in early mouse organogenesis
Gene expression profiles of 10-µm tissue pixels were dominated by single-cell transcriptome.
Allows rapid identification of cell types in relation to the spatial distribution
No microfluidic control setup is required, only pipettes.
Data quality
In a 10µM pixel DBiT-seq experiment, they were able to detect 22,969 genes in total with an average of 2,068 genes per pixel
Detection bias dependent on gene length was similar to that of ST
Spatial patterns obtained by smFISH were similar to those of DBiT-seq
Estimated DBiT seq detects 15.5% of total mRNA transcripts. 2x more than Slide-seq

Direct integration with Single-Cell RNA-Seq data
It is always advantageous to be able to integrate data sources from multiple methodologies. As mentioned in my previous post having multiple lines of evidence bolsters your claim and helps us understand our data better. Direct integration with slightly more established scRNA-seq allows us to deconvolute the cell types that are present in spatial sequencing data. To this end, the authors used available mouse embryo data and compared the gene expression patterns in DBiT-Seq.

scRNA-seq data from E9.5 and E10.5 mouse embryos were combined with DBiT-seq E10 embryos.
"Spatial pixels conformed well into single-cell transcriptomes and they identified 24 clusters in the combined dataset"
scRNA-seq as a reference for cell type annotation; they report 53 cell types mapping from DBiT to scRNA on UMAP.
Allows detection of dominant cell type in each pixel; This could be linked with scRNA-seq-annotated cell types to corresponding spatial pixels and visualize cell type distribution on the tissue.

Pipeline and feature identification
They utilized a previously published pipeline: SpatialDE
SDE: can be used for automated discovery of spatial tissue features without using scRNA-seq for cell type annotation
SDE identified 10 features such as eye, ear, muscle, forebrain, epithelium etc.,
Scales with the development process and emergence of internal organs.
Opinions as a Bioinformatician:
Could we improve the number of protein markers measured in parallel, in this study the limitation was 22 protein markers. The answer is yes, it can be the next paper by the same research group I will discuss has significantly more proteins that could be measured.
Have you heard of SomaMers; they are short single-stranded oligonucleotides that have been previously used in diagnostics. They are particularly effective in binding to small molecules and proteins. Could we use them in conjunction to expand the spectrum of proteins that can be targeted? Could this be a better alternative to antibody-derived tags?
Can this be modified to measure the epigenome? short answer; Yes
From a bioinformatics stand-point; how would one be certain about the model being replicated to significantly complex tissue such as cancers with lot of immune infiltration, will this increase the noise and how should one deal with such “background noise“
For this, I will have to deep-dive into the analysis pipelines as they are essential for getting a clear picture.
Five-point summary:
A less technically intensive approach versus solid-phase RNA capture. With more versatility in equipment and reagents; No fancy patented microscope is required.
The demonstration showed the resolution of fine features with high data quality and overall good coverage of the genome versus Slide-seq or HDST.
Ability to integrate with scRNA-seq data to identify the dominant cell type in each spatial pixel.
Correlation of cell morphology and spatial transcriptome at the cellular level by using immunostained tissue slide.
Limitations:
Does not resolve single cells directly.
The theoretical limit of pixel size to 2µm; at this scale tissues can deform and may block the micro channel flow if the channels are small and shallow.
achievable smallest pixel size is 5µm
The number of flow channels in the current version is limited to a 10µm pixel size.
Is it possible to use a different microfluid chamber/pattern? It is yet to be explored; maybe AI aided design of a microfluidic chamber to increase the surface area would be a small project for material scientists among you.
High-plex protein and whole transcriptome co-mapping at cellular resolution with spatial CITE-seq
What is it?
It Extends the co-indexing of transcriptomes and epitopes (CITE) to a spatial dimension.
Profiling of 189 proteins and whole transcriptome in multiple mouse tissues
Based on DBiT-Seq with minor modifications.
What is the key idea?
Utilising a cocktail of 200-300 antibody-derived tags to stain a tissue slide.
Deterministic in-tissue barcoding of both DNA tags and mRNAs for spatially resolved high-plex protein and transcriptome co-profiling.
Uses A1-A50 DNA row barcodes like the previous method which contains an oligo-DT sequence that binds to the polyA tail of ADTs or mRNAs
Post reverse transcription, B1-B50 DNA column barcodes are applied in a perpendicular manner.
Each unique spatial address code AiBj is then used to co-index all protein epitopes and transcriptomes.
Individual library preparation for ADTs and mRNAs followed by sequencing reconstructs the spatial protein or gene expression map
What are the key claims?
Current methods have a higher limit of 100-plex protein mapping in spatial transcriptomics.
Approximately 2-3 fold improvement. Spatial-CITE-Seq is the highest multiplexed platform to date.
Theoretically could be expanded to 1000-plex protein mapping
What are the key improvements?
This is based on DBiT-seq mentioned above. You will find the full-length article in the references.
Increase in protein measurement from 22 to 189 (mouse) 273 (human) along with the whole transcriptome.
The ability of A1-A50 to bind to poly-A tails of ADTs or mRNAs
The initial step is to use the cocktail of ADTs to stain the tissue slide.


Data quality:
In tonsil tissue, the average protein count per pixel is around 239 and an average of 4309 UMI’s per pixel.
Spatial protein clustering allowed the identification of seven distinct clusters.
Spatial transcriptome allowed the identification of eight clusters. The correlation of these clusters was deemed to be usable but with some amount of noise.
Integration of scCITE-seq and spatial-CITE-seq using Seurat revealed that the two methods share highly concordant protein expression patterns in the UMAP space.
By performing scSEQ on the same tissue they were able to successfully transfer labels and therefore it is a useful method if you are trying to understand multiple modalities of the disease.
Conclusion
I am sorry that I have cut this short and abruptly, It’s 6 pm on a Friday evening in lively and vibrant Amsterdam. I am heading for a walk and to find some food.
I think DBiT-seq and related spatial sequencing technologies hold a lot of promise to understand the information flow within the tissues. As discussed in earlier posts, innovations such as these two methods stand on previous experiments and incremental advances letting us appreciate, observe and introspect the complexity of cellular communication. I can imagine a future where these methods along with advanced computational approaches will be implemented in clinical settings to diagnose and even monitor the progression of the disease.
If you have any questions, I am sure you have plenty since there are a lot of loose threads in this post. Message me in the community chat, and I will answer you to the best of my ability.
References
Liu, Yang and Yang, Mingyu and Deng, Yanxiang and Su, Graham and Guo, Cindy and Zhang, Di and Kim, Dongjoo and Bai, Zhiliang and Xiao, Yang and Fan, Rong, High-Spatial-Resolution Multi-Omics Atlas Sequencing of Mouse Embryos via Deterministic Barcoding in Tissue (October 8, 2019). http://dx.doi.org/10.2139/ssrn.3466428
Liu, Y., DiStasio, M., Su, G. et al. High-plex protein and whole transcriptome co-mapping at cellular resolution with spatial CITE-seq. Nat Biotechnol (2023). https://doi.org/10.1038/s41587-023-01676-0
Socials
Prof. Dr. Rong Fan: Twitter, Lab site
Dr. Yang Liu: Twitter
If you enjoyed the article, Please leave a like and comment below. And if you appreciate the work, maybe scan the QR code and buy me a coffee.
See you next week with a cool new paper on a similar technology that is going to change the field.